


 English (pdf)
 Article in xml format
 Article references
 Send this article by e-mail
 Cited by SciELO
  Similars in
SciELO
Similars in
SciELO 
 Permalink
Introduction
Tectona grandis L. f., popularly known as teak, is a species from the monsoon rainforest in the Asian continent, with natural distribution in India, Myanmar, Thailand, and Laos (1), (2). Commercial teak plantations were introduced in Brazil to ensure wood availability for regional industry (3). Teak log production represents 0,4% of the total wood produced in Brazil, with an average annual productivity of 15 m³ ha-1 (4). Currently, there are 94 thousand hectares of commercial teak plantations (5) located in the Midwest and North regions.
Teak is a fast-growing species, whose wood is considered noble for its durability, it is resistant to fire, pests, and diseases, therefore, it is widely used in luxury furniture and shipbuilding (6). Thus, teak is an alternative to native forest species of high economic value, providing a sustainable option for the Brazilian forest-based industry and reducing the pressure to exploit tropical rainforests (7), (8).
Detailed knowledge of teak stand structure is necessary for sustainable management plans. Thus, it is important to consider the spatial relationships of forest variables in a precision forestry context (9), (10). Geostatistics is a technique based on the theory of regionalized variables (11) that provides analysis of the spatial distribution of variables and estimation at unsampled locations for thematic maps (12), (13).
Geostatistics has been applied to manage teak stands (14), (15), since they require a particular management regime of the main forest species, such as Eucalyptus and Pinus genera. Additionally, covariables can be used to increase the accuracy at the spatial level (16), (17). Remote sensing variables can assist in geostatistical modeling (18) due to their low acquisition cost and the correlation between reflectance values and forest variables (19), (20).
This evidence is based on information obtained by different remote sensing technologies, which have shown wide application for forest cover representation, forest structure mapping, improving the accuracy in forest estimates, and supporting forest operations (21), (22). However, the integration of remote sensing variables, such as vegetation indices, with geostatistical modeling in forest stands has not been sufficiently studied (16), (23), (24). For teak plantations, this gap remains unexplored and, therefore, the aim of this study was to model the spatial distribution of teak stand variables, adding covariables.
Material and methods
Study area. The study was carried out in 19-year-old teak stand in Mato Grosso State, Brazil, with 213 hectares in the initial spatial of 3 m x 3 m. The region's climate is tropical Aw (Köppen), with a dry season in the winter, an average rainfall of 1,300 mm year-1, and an annual average temperature of 25º C (25). Selective thinning was carried out at six, nine, twelve, fourteen, seventeen, and nineteen years old, with an average removal of 35% of the initial planting, and 17%, 11%, 5%, 9%, 3% of the total remaining trees, respectively. Pruning was performed in the second, third, and fourth years.
For data collection, 46 geo-referenced plots of 900 m² (30 m x 30 m) were allocated. In these plots, variables were obtained after thinning: V - stand volume (m3 ha-1), G - basal area (m² ha-1), - arithmetic mean of diameters at breast height (cm), dg - quadratic mean diameter (cm), ddom - dominant diameter (cm); - arithmetic mean of the heights (m); and hdom - dominant height (m).
Remotely sensed data and imagery processing. Landsat 8 Operation Land Imager image was acquired, in march 2018, on the Earth Explorer portal of the United States Geological Survey (26). The image was reprojected to Universal Transverse Mercator, Datum SIRGAS 2000 - Spindle 21 South, and an atmospheric correction was applied in QGIS software (27). The fusion of multispectral bands with panchromatic was performed to obtain a higher spatial resolution image.
Vegetation indices were calculated from arithmetic operations carried out between the image bands: Simple Ratio (SR), Normalized Difference Vegetation Index (NDVI), Enhanced Vegetation Index (EVI), Soil Adjusted Vegetation Index (SAVI), Atmospherically Resistant Vegetation Index (ARVI), Visible Atmospherically Resistant Index (VARI), and Leaf Area Index (LAI) (28). In addition, Principal Component Analysis (PCA) and Tasseled Cap Transformation were performed. The first one aims to produce uncorrelated principal components (PC), while the second one results in an orthogonal transformation of the sensor bands that redesigns the data in three axes: Brightness, Greenness, and Wetness (29), (30).
Geostatistical analysis. Exploratory analysis was applied to verify the relationship between forest and remote sensing variables and the presence of outliers. These analyses consisted of the Anderson-Darling's test for data normality at a 95% probability level, linear correlation analysis, and frequency histograms to identify positive-skew distributions, which can hinder geostatistical modeling due to the weight of few observations in the estimation at unsampled locations (31).
Semivariances were calculated to identify the spatial dependence of the sampling units. Spherical, Exponential, Gaussian, Pentaspheric, and Circular semivariogram models were fitted by the gstat package (32) of R software (33) to describe the spatial dependence structure. The semivariograms were determined in four spatial directions, 0º, 45º, 90º, and 135º, to verify anisotropy. If detected, the angle was adjusted to obtain a semivariogram model with common parameters in all directions (31). The best fit was selected based on the smallest weighted sum of squared deviations (WSSD) and highest coefficient of determination (R²).
The interpolation of forest variables was carried out by the geostatistical univariate method of ordinary kriging, as well as by the multivariate method of kriging with external drift, considering the remote sensing variables as covariables.
Ordinary kriging. In ordinary kriging (1), the estimate at the unsampled point results from a combination of values found in the close neighborhood (31) whose average is unknown. In this method, weights (33) are influenced by the fitted semivariogram, considering the distances between the sampling points and the point to be estimated . Thus, higher weights are assigned to the nearest points, which minimizes the grouping effects or data redundancy (34).
Kriging with external drift. Kriging with external drift (2), or universal kriging, is a method that allows estimating a variable considering the information of a covariable known throughout the area (35). Thus, considering as the primary variable and as the covariable, this correlation can be described through a linear relationship. This indicates that the spatial variability of the secondary variable is related to local trends.
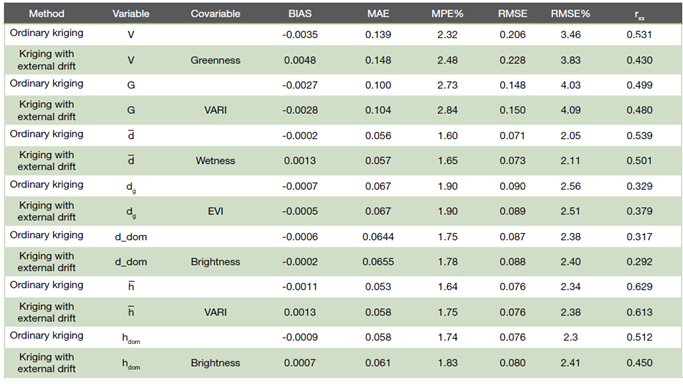
The kriging methods estimates were compared by leaving-one-out cross-validation (36) using the gstat package (32). BIAS, mean absolute error (MAE), mean percentage error (MPE), absolute root mean squared error (RMSE), percentage root mean squared error (RMSE%), and Pearson's linear correlation between observed and estimated values (33) were also applied.
Results and Discussion
Exploratory analysis of teak stand and remote sensing variables. The low variability of forest variables (Table 1) is indicative of data homogeneity, which may be the result of thinning applied in teak stand. Thinning tends to change the forest structure, especially selective ones, by removing trees with smaller sizes and phytosanitary and quality problems, such as stem tortuosity and bifurcation (37), (38). Remote sensing variables with the highest coefficient of variation (cv%) values (e.g., PC = 43.5%) were more influenced by variations in vegetation cover of the study area, while the variables with lower values (e.g., VARI = 15.5%) were less affected.
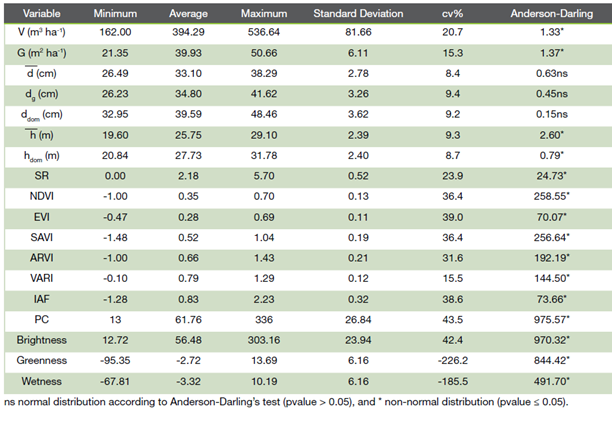
Data normality was verified for variables arithmetic mean of diameters at breast height, quadratic mean diameter (dg), and dominant diameter (ddom) through Anderson-Darling's test (Table 1). The absence of normality was observed for remote sensing variables at a 95% probability level. Log-transformation was applied for forest variables, aiming to reduce the asymmetry of their distributions (39). However, it was not possible to transform remote sensing variables since some vegetation indices showed negative values.
The negative-skew distributions were observed for variables volume (V) and basal area (G), in which the highest frequency class (mode) has moved to the right of the distributions (Figure 1). This result is evidence of changes in forest structure caused by thinning in long rotation teak stands (40).
Arithmetic means variables of heights and dominant height (hdom) distributions showed similar behavior (Figure 1) since the stand structure was simplified by successive thinning to trees with greater dominance. The tendency of bimodal distributions for these variables can indicate two site classes with different productivity. Additionally, data dispersion and correlations showed linear dependence between the forest variables. Also, a higher correlation between volume (V) and basal area (G) showed the influence of diameter in the quadratic form to determine the volume (41), (42).
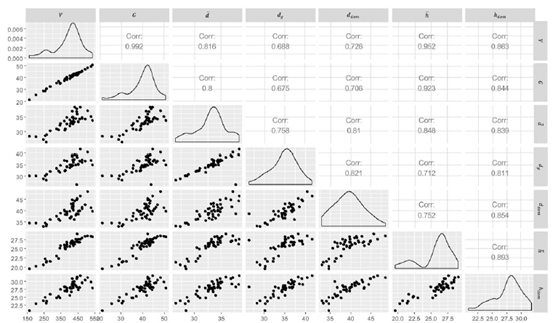
Figura 1. Relaciones entre las variables de rodales de teca.
Evaluating the scatterplots of remote sensing variables (Figure 2), unimodal distributions with asymmetry were observed for Simple Ratio (SR), Normalized Difference Vegetation Index (NDVI), Enhanced Vegetation Index (EVI), Soil Adjusted Vegetation Index (SAVI), Atmospherically Resistant Vegetation Index (ARVI), Visible Atmospherically Resistant Index (VARI), and Leaf Area Index (LAI).
Moreover, the strong linear dependence between these variables is evidenced by the lower data dispersion (43), since they are derived from the same information, as the near-infrared (NIR) and red band (RED) reflectance. Principal Components (PC) and Brightness showed a strong linear dependence and positive-skew distributions, while Greenness and Wetness presented high correlation and negative-skew distributions (Figure 2). These variables also showed extreme values, indicating possible outliers (44).
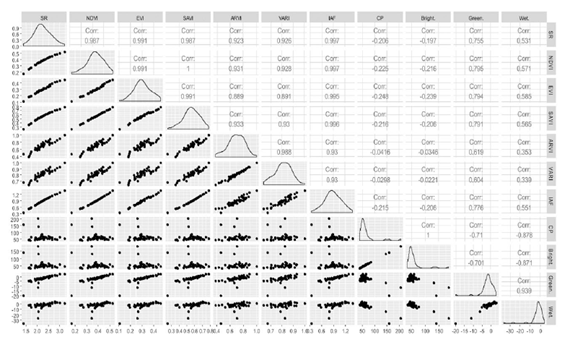
Figura 2. Relación entre variables forestales y de teledetección.
Using thematic maps of vegetation indices (Figure 3), green-colored areas indicate higher values and stronger vegetative vigor, while areas with red, orange, and yellow colors showed less vegetative. Thus, it was possible to distinguish sites with dense vegetation from areas with sparse vegetation and exposed soil (Figure 3). This behavior was inverted for PC (Figure 3g) and Brightness variables (Figure 3h).
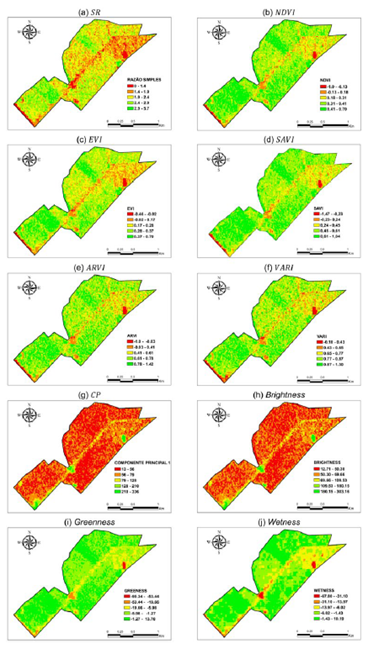
Figura 3. Mapas temáticos de variables de teledetección en plantaciones de teca.
The central linear strip in the stand (Figure 3) represented exposed soil due to a firebreak and therefore low vegetation index values were obtained. In addition, six selective thinning have been carried out since the stand's establishment, with a decrease in initial average density from 1,111 trees ha-1 to 139 trees ha-1. The final density ranged from 89 trees ha-1 to 189 trees ha-1, in which the lowest values of remote sensing variables also indicated the sites with less dense vegetation (45) due to more intense thinning in teak stand.
Relationship between forest and remote sensing variables. The teak stand variables showed weak linear correlations (46) with remote sensing variables (Figure 4). Higher negative values were observed between V and with PC and Brightness, while the greatest positive correlation occurred between V with Greenness. For dg, there was not a correlation between PC and Brightness. These results may be indicating a rejection of the hypothesis formulated in the present study, in which remote sensing as covariables in geostatistical modeling does not allow predicting teak stand variables. However, spatial dependence also needs to be assessed for a complete evaluation of the data (47).
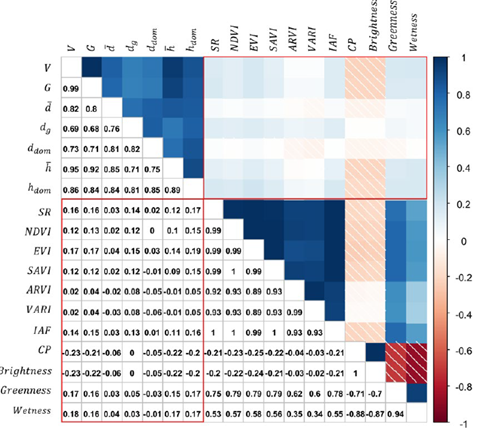
Figura 4. Correlación entre las variables del rodal de teca y las covariables de teledetección.
The lack of high correlations between forest and remote sensing variables can be explained by the vegetation cover aspect generated by a satellite image, which is the result of a process involving many environmental parameters and factors (48). Therefore, a measurement obtained by a remote sensor cannot be only explained by the intrinsic vegetation characteristics since an image is interfered by the atmosphere effects, canopy attributes, radiation sources, and soils (49), (50).
Ordinary Kriging. The fitted semivariograms for forest variables showed spatial dependence and better statistics with the Spherical model, except for ddom with the Exponential model. The nugget effect showed values lower than 0.02 and indicates the statistical quality of the fitted models. In addition, the range presented minimum values of 222 m for ddom and a maximum of 913 m. The other fits resulted in ranges between 761 and 881 m (Figure 5).
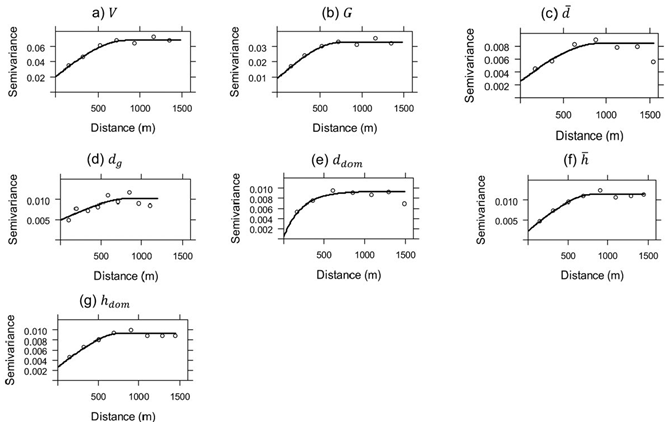
Figura 5. Semivariogramas ajustados para las variables de la teca.
In addition, semivariances showed low dispersion around the estimated average line for forest variables (Figure 5). The increasing behavior of the semivariance line and the subsequent stabilization around a maximum distance, defined by the range parameter, confirms the quality of semivariogram fits in this study (51). Thus, the interpolation was performed by ordinary kriging, in which thematic maps with heterogeneous spatial patterns were obtained (Figure 6).
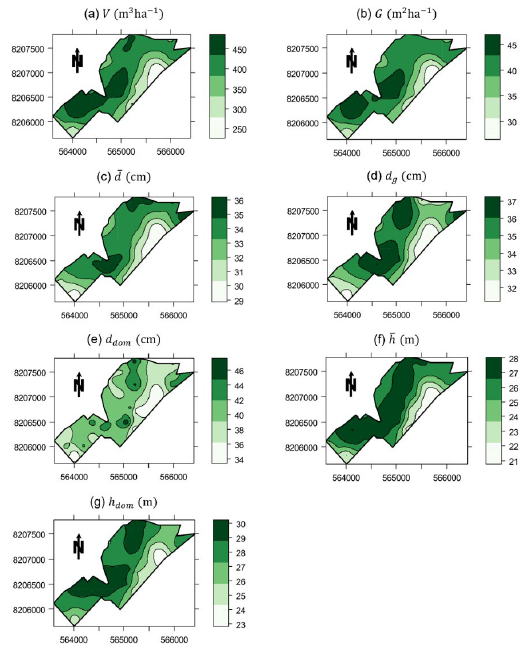
Figura 6. Distribución espacial de las variables de los rodales de teca mediante kriging ordinario.
The central region of the maps showed the highest values of volume (V), basal area (G), mean quadratic diameter (dg), mean height, and dominant height (hdom); while the East region presented the lowest values for all forest variables (Figure 6). These results indicate the influence of site quality, which is better in areas where the forest variables had higher values (34), which can be confirmed by the greater dominant heights present in the same region (Figure 7 g ).
Kriging with external drift. Kriging with external drift was initiated by fitting semivariograms (Figure 7), however, in this method, remote sensing covariables were used to explain a portion of forest spatial variability. The spherical model provided the best fit, except for ddom with the Exponential model. These fits resulted in low nugget effect values, showing the goodness of statistical quality of the modeling (52).
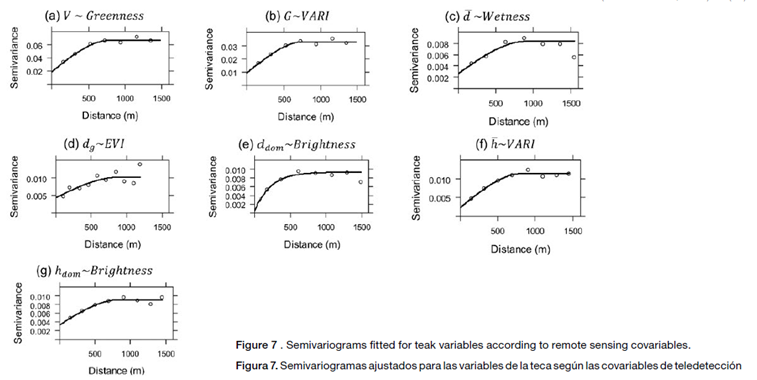
Figura 7. Semivariogramas ajustados para las variables de la teca según las covariables de teledetección
Range values were similar to those obtained by ordinary kriging, in which lower values were obtained for volume (𝑉), basal area (G), arithmetic mean of the heights, and dominant height (hdom) with the covariable Wetness (Figure 7). These results demonstrate the influence of this covariable on the spatial dependence of forest stands (40). On the other hand, Brightness, which expressed an index of soil brightness (30), resulted in the highest range values (Figure 7). Covariable Greenness resulted in the best-fit volume variable (V), with the highest coefficient of determination (R²), equal to 0.990. Basal area (G) and arithmetic mean of heights (h) performed better with the VARI index, resulting in the smallest weighted sum of squared deviations (WSSD) of 3.79 × 10⁻⁹. Covariable Wetness presented the highest R² (0.952) and the lowest WSSD (5.94 × 10⁻¹⁰) for the arithmetic mean variable of the diameters (𝑑̅). The variable quadratic mean diameter (dg) performed better with the EVI index, while covariable Brightness enabled the highest R² (0.965 and 0.992) and lowest WSSD (3.93 × 10⁻¹⁰ and 1.16 × 10⁻¹⁰) for dominant diameter (ddom) and dominant height (hdom) (Figure 7). Semivariograms fitted according to remote sensing covariables with the best statistical performance in kriging with external drift showed appropriate patterns, with an increasing and subsequently stabilizing behavior of the estimated semivariances (Figure 7). As a result, they were used to compose thematic maps of forest variables (Figure 8).
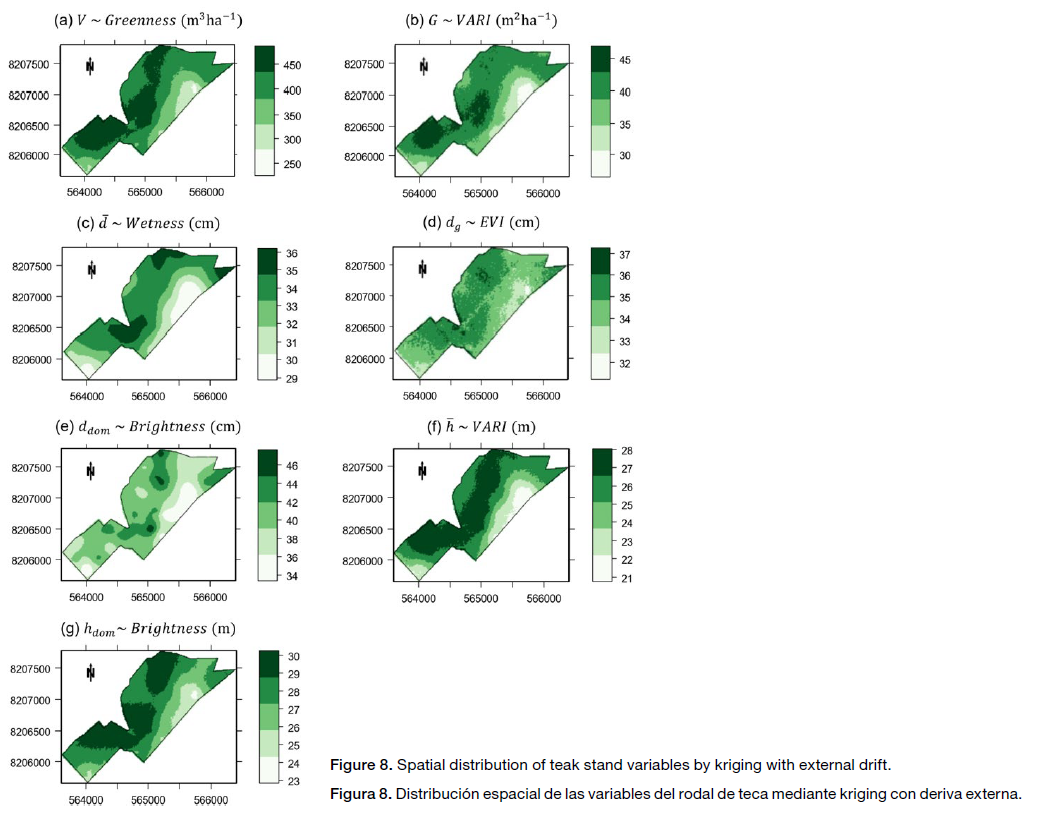
Figura 8. Distribución espacial de las variables del rodal de teca mediante kriging con deriva externa.
The cross-validation statistics by the external drift kriging method presented better results for the dg variable when compared to ordinary kriging (Table 2). Although the estimates of forest variables have not, in general, presented higher cross-validation statistics than ordinary kriging, through kriging with external drift it was possible to compose thematic maps with a higher level of spatial detail (Figure 8), ensuring lower average errors. These results are desirable when the objective is to apply precision management in commercial stands since they also allow for adequate estimates in unsampled locations (14).
Conclusion
Remote sensing variables show a weak linear correlation with teak variables, which tends to make them unviable to use as covariables in geostatistical modeling. However, kriging with external drift predicts spatial patterns of forest variables with greater detail, which results in lower possible smoothing errors than those obtained by ordinary kriging and provides more accurate recommendations for localized management in teak stand. The integration of remote sensing variables in forest inventory through geostatistics is advantageous since the product of kriging with external drift estimates can be used as auxiliary information. Additionally, as a recommendation, remote sensing variables make it possible to increase the reliability of forest inventories without increasing costs with higher sample intensity.

