


 English (pdf)
 Article in xml format
 Article references
 Send this article by e-mail
 Cited by SciELO
  Similars in
SciELO
Similars in
SciELO 
 Permalink
Foreword
From the industrial revolution in the early nineteenth century, society started to develop consumer habits with a mass production of objects and food that over time have generated excessive overexploitation of natural resources, as well as serious problems of environmental pollution (Flores, 2015). In addition, the inefficient waste management system done by people and institutions has led to a bad disposition of them, for example, in bodies of water, where people contaminate this resource and affect its ecosystem, or in open waste dumps that attracts animals, vectors of diseases and bad odors. All this is causing a series of environmental and public health problems (Del Angel, 2017).
Ordinary solid waste is the domestic waste or the one generated from related establishments, with the exception of those that are identified as dangerous and specially managed waste (Rojas & Bogantes, 2018). Ordinary waste includes organic solid waste, which is the one that presents a microbiological biodegradation in a period of at least six weeks at humidity greater than 55%, and that can be classified as raw biodegradable waste (fruit and vegetable peels), and cooked biodegradable waste (remains of prepared foods) (Chavarría et al., 2015).
Among the environmental problems caused by the generation of solid organic waste in houses and food industries are the generation of methane gas (CH4) and carbon dioxide (CO2). These are greenhouse gases that are contributing significantly to global warming (Calles, 2015). According to the inventory of greenhouse gas emissions in 2012, 70,200 tons of methane gas is generated in our country as a result of solid waste that is sent to landfills. And around 4.4% of emissions in Costa Rica are due to solid waste, a percentage higher than the global average of 3.6% (Herrera, Rojas & Anchía, 2018). According to FAO data for 2007, there was a footprint of 3,300 million tons of CO2 due to food waste (FAO, 2016).
On the other hand, approximately 4,000 tons of solid waste are generated per day in the country and about 1.1 kg of solid waste per day per person are generated in urban areas whose population is constantly growing (Herrera, Rojas & Anchía, 2018). In addition to this, in rural areas less than 50% of solid waste is collected in trucks and transported to recycling centers while the rest are deposited in garbage dumps or receive an inadequate disposal. Added to this, in the large metropolitan area, 53% of the disposal sites are garbage dumps, a situation that generates a great problem since it is exceeding the capacity to process waste and causing important effects on the environment (Gaviria & Soto, 2007).
The high overexploitation of natural resources and the increase of the world population have led to a greater generation of these residues and therefore to greater loss and waste of food throughout the entire food chain. Currently, 1.3 billion tons of food are lost per year worldwide, which corresponds to almost one third part of the world production (ONU, 2016). The loss and waste of food is variable throughout the production process since it is harvested, transported, sold and even consumed. The lack of social conscience regarding the origin of the food and everything that implies its final disposal makes it increasingly necessary to generate measures that avoid loss and waste to the most (Lipinski, Hanson, Lomax, Kitinoja, Waite & Searchinger, 2013).
This problem has been increasing in the last decade and must be addressed in a timely manner by various entities implementing more efficient food management systems, and in food establishments monitor the correct use of food according to the type of operation, both in the winery area, in the food preparation area or in the food for consumption (Costa Rican Reduction and PDA, 2017). Know which foods are being discarded and why, allows to implement solutions in order to minimize this problem, thus making an efficient management of resources (CIDETI, 2017; Costa Rican Reduction and PDA, 2017).
An aspect that is important to indicate is that the final consumer is the one that generates the conscious action of wasting food or not, an action that unfortunately generates social inequality in the countries. On the one hand there are industrialized or developing sites with greater access to food, but where they are being wasted, while there are other places where the lack of food and access is causing a food crisis with consequent problems of malnutrition, hunger and even death (Lucifero, 2016). That is why it becomes a social problem that has to be intervened in order to minimize these actions, mainly carrying out a process of raising awareness among the citizens regarding waste management, in addition, creating an awareness environmental and social that prevents the uncontrolled generation of them (Gustavsson et al., 2012).
The objective of this study was to analyze the management, use and reduction of organic solid waste during the period 2013-2016 at the National University of Costa Rica through the determination of generation rates by type of organic waste and rates of reduction of food waste in sodas of the Omar Dengo Campus.
Methodology
Description of the sites
The study was conducted at the Omar Dengo Campus of the National University of Costa Rica, collecting information of organic solid waste generated in five sodas. The study was conducted within the period 2013-2016.
Collection and processing of waste
In each soda, two labeled containers were established, one for raw organic waste containing vegetable and fruit peel waste, and another labeled container for cooked organic waste that corresponds to the waste of the day's dish made by the visitors of the sodas as well as waste of the kitchen.
This usable waste was collected on weekdays from Monday to Friday in the months of February to June and from August to November of the period 2013-2016, between two and three o'clock in the afternoon, by officials of the UNA Campus Sostenible program in trucks of the institution. The containers were collected every day and two more spare containers were deposited for their use and collection the next day and so on.
The usable waste was transferred to the collection center of the university, where they were processed, noting on the form specifications such as date, time of collection, place or soda of origin (identified as Soda 1, Soda 2, Soda 3, Soda 4 and soda 5), the weight of each type of waste by means of a scale Ocony model TI500, the total weight adding raw and cooked and if necessary some observations.
Later, the raw organic waste was deposited on a blanket or plastic in an open area in order to eliminate the greatest amount of water from these residues. Then they were crushed with the cheaper machine brand BRIGGS & STRATTON 8.5 HP later deposited in 3 rotary composting machines brand Jora Form, model JK400, with capacity of 85 Kg/week located in the Institutional Collection Center for the future generation of organic fertilizer or compost. The cooked organic waste is sent to the Santa Lucia Farm of the School of Agricultural Sciences of the National University for its use in the food of porcine animals.
It should be noted that in the soda of the Faculty of Agricultural Sciences, harvesting was not carried out in the periods 2013-2014, in the soda of the Faculty of biology the collection was not carried out in the periods 2014-2015.
Application of surveys
In order to know what the perception of the users of the soda´s service at the university is, 71 surveys were applied in the five sodas. Of the total of the surveys applied, 37 were answered by men and 34 by women with average ages between 19 and 22 years.
The survey consisted of 13 questions with aspects such as: the frequency of visitation to the sodas of the campus, reasons for which they frequent them, quality of the food, and opinion on the size of the portions, as well as generation and opinion regarding the food waste.
Analysis of the information
The data were grouped by soda in months and years, used to generate comparison graphs of the daily generation rate of these residues was calculated using formula number 1, according to the days of collection in each of the sodas of the campus.
Gr= (A/D) (Gaviria & Soto, 2007).
Where:
Gr= Daily generation rate
A=Amount of waste (kg)
D= Number of days of waste collection
In addition, the solid waste generation rate per day was calculated with respect to the percentage of user visits only for sodas 1 and 2 in 2014, due to the fact that only these two sodas have waste data cooked in that year, in which a study was carried out by the UNA Campus Sostenible program to see the percentage of visits to the different sodas of the campus.
For the calculation of this generation rate, the number of visits made to the sodas was used, taking as a base the quantity of sales of main dishes sold (lunches). These data were collected for two weeks of sampling, however, for purposes of this work the average number of visitors per day was calculated for their use in the calculation of rates of generation of organic waste cooked per visitor in the mentioned sodas.
On the other hand, the dish residue of cooked waste generated per dish was measured for 2014 in the sodas 1 and 2 in order to determine the percentage of waste per dish served, for this formula number 2 was used:
% Dr= (Ac/680g) * 100
Where:
% Dr= % Dish residue
Ac= Amount of cooked residue (g)
The 680g correspond to the approximate weight of the plate established in the National University.
Due to the data follow a normal distribution according to the Shapiro-Wilk test, it was determined whether or not there are significant differences between the data obtained from organic waste both raw and cooked in the different sodas, and in the different sampled years, as well as the generation rates through the statistical T test, which was use through the statistical program RStudio 4.6 version.
Results and Discussion
The amount of total organic waste collected per year varied significantly during the sampling period (T = 15.913, gl = 3, p-value = 0.00054), with an increase in the generation of this waste for the year 2016 (with 19 198.20 kg/year) compared to 2013 where 14,306.90 kg/year was generated. There was also a significant variation in the amount of waste per soda (T = 3.8201, g.l = 4, p-value = 0.0188), being soda 2, which has generated the greatest amount of organic waste throughout this sampling period with 26 916.10 kg/year (Table 1).
Table 1 Total organic waste per soda during the period 2013-2016.
| Soda | 2013 (kg/year) | 2014 (kg/ year) | 2015 (kg/ year) | 2016 (kg/ year) | TOTAL (kg) |
| Soda 1 | 4,980.50 | 7,137.50 | 2,972.30 | 2,659.20 | 22,611.00 |
| Soda 2 | 6,840.50 | 7,313.00 | 5,368.10 | 5,501.50 | 26,916.10 |
| Soda 3 | NC | 3,197.80 | 3,836.50 | 3,531.00 | 10,565.30 |
| Soda 4 | 2,486.40 | NC | NC | 3,885.00 | 8,300.40 |
| Soda 5 | NC | NC | 3,807.50 | 3,621.50 | 10,142.50 |
| Total (kg) | 14,306.90 | 17,648.30 | 15,984.40 | 19,198.20 |
NC: It was not collected in that year
Note: Research's own source
This variation in the amount of organic waste generated over the years can be due to several factors. One of them is the increase of the university population in the Omar Dengo Campus, which went from 15.548 students in 2013 to 16,298 students in 2016 (Table 2). The generation of waste increases the greater the population, because there is a larger demand in the preparation of food and also greater waste of cooked waste by users (Fernández, 2005). In addition, the increase in technologies may represent a bigger generation of new products and new foods that ultimately end up being an important waste (Vargas, Alvarado, López & Cisneros, 2015).
According to Contreras (1995), there are many factors that determine what people want to eat or why they choose certain foods, from simple as sensitive aspects of the quality of food to social issues, such as attraction to the place due to the influence of people. This is why the Soda 2, despite not being the biggest soda of the university, is the one most frequented by students due to its high quality in the preparation of the food that makes it highly attractive. However, it has also one of the greatest amount of waste generated by its visits.
Table 2 Per capita rate of waste generation on the Omar Dengo campus
| Omar Dengo Campus | Year | ||
| 2014 | 2015 | 2016 | |
| Number of Regular Students | 12,842 | 12,833 | 11,769 |
| Days of recollection per year | 89 | 144 | 145 |
| Organic waste per year (kg) | 14,306 | 15,702 | 19,198 |
| Daily rate | 160 | 109 | 132 |
| Rate per capita kg/per/day | 0.0125 | 0.0085 | 0.0112 |
Note: Research's own source
Specifically in terms of the generation of crude type organic waste, a total of 11,080.20 kg was obtained in the entire period 2013-2016, with some differences between the sodas of the campus, in a significant manner (T = 4 , 2303, gl = 4, p-value = 0.0134), as in the different sampling years (T = 20,589, gl = 3, p-value = 0.0002). A tendency of decrease of these residues can be observed mainly in Soda 1 that went from 3,734.5 kg in 2013 to 2,087.0 kg in 2016 (Figure 1).
Regarding the generation of cooked organic waste, which is a very important part of this study since it is exclusively due to the waste of food by the users of the sodas, it was found that there are no significant differences between the sodas during the period sampling (T = 2.6458, gl = 4, p-value = 0.0572), but there was a difference in the sampling years (T = 6.0141, gl = 3, p-value = 0.0092). Soda 2 generated the largest amount of this waste compared to the other sodas. Soda 1 shows a strong tendency to decrease the generation of this waste, going from 1,245.5 kg in 2013 to 572.2 kg in 2016 (Figure 2).
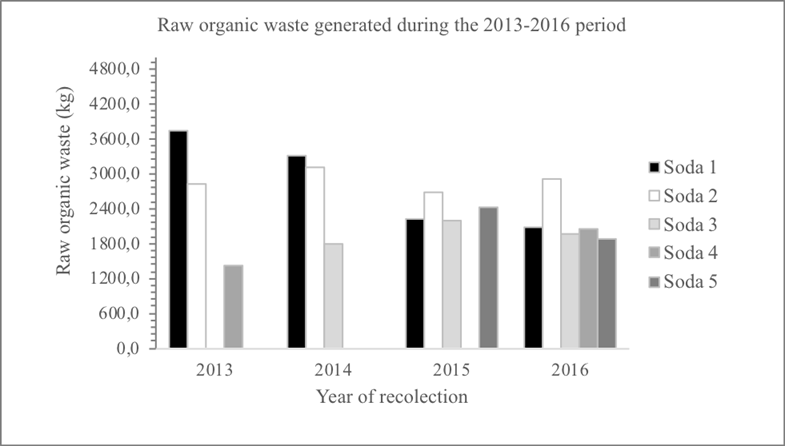
Figure 1 Raw organic waste generated during the 2013-2016 period in the different sodas of the Omar Dengo Campus. Note: Research's own source
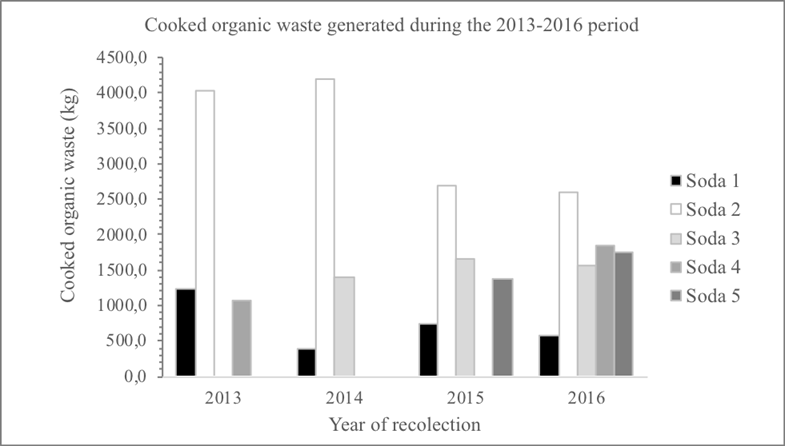
Figure 2 Cooked organic waste generated during the 2013-2016 period in the different sodas of the Omar Dengo Campus. Note: Research's own source
Soda 1 shows a decrease in the generation of both raw and cooked waste over time. There are small practices that sodas can choose to generate less waste and those are applied by this soda. For example, a better use of the husks, cooking the whole vegetables so less raw waste is generated or calculating the appropriate size of the portions so that it does not generate as much waste of cooked waste (Red Costarricense para la disminución y PDA, 2017) .
An aspect that must be taken into account in this study is that there are periods where there was a change in the administration and movement of personnel in some sodas. Therefore, the commitment on the part of the administrators in collecting the raw and cooked waste to send them to the collection center is not always the same. For example, in Soda 5 there was a change of administration in 2013 and waste was not delivered until 2015 (which is why there are gaps in the data table).
Also, in Soda 4 a change of administration was made in 2014, and they did not participate in the program until 2016, where SISAUNA stipulated the directive that all sodas must deliver their waste to UNA Campus Sostenible. All this leads to the differences obtained within the sodas and in the different sampling years, since the collection or proportion of days collected and generation of data is not equal for all the sodas and throughout the years, this due to different logistics or external factors such as street closure, lack of access to sodas in some moments, holidays in the institution, among others.
Soda 2 generates the largest amount of cooked organic waste. This may be due to several reasons, among the most important are: the food is not pleasant for the user, that it is a dish with more food than the person needs to fill or satiate their hunger, and/or poor preparation of food discourages the person from consuming them (Cuevas, 2004). However, another point to take into account is that this soda is one of the most visited, this means that more users generate more waste and therefore an increase in the problem of food waste (Vargas et al., 2015).
On the other hand, the calculation of generation rates for these wastes took into account the collection days for each soda and year, with an average of 67 days in 2013; 177.33 days for 2014; 179.5 days in 2015 and 145.4 days for 2016. Due to special situations that prevented the collection of waste, for example, a closed street that prevents access to a certain area of the university, non-school days among others. It should be noted that since 2013, the collection of waste becomes more arduous, remaining until 2016.
Based on the above and on the amount of waste, it was found that there are significant differences in the rates of generation of total organic waste in the period 2013-2016 between the different collection years (T = 5.4211, gl = 3, p -value = 0.03238) and in each soda (T = 8.8502, gl = 4, p-value = 0.00009). It is noticeable that Soda 2 obtained a higher generation rate in the years 2013 (46.85 kg/day) to 2016 (41.68 kg/day) (Table 3).
Table 3 Total organic waste generation rates per soda during the period 2013-2016.
| Soda | 2013 (kg/ day) | 2014 (kg/ day) | 2015 (kg/ day) | 2016 (kg/ day) |
|---|---|---|---|---|
| Soda 1 | 33.42 | 40.10 | 16.07 | 16.31 |
| Soda 2 | 46.85 | 41.32 | 29.33 | 41.68 |
| Soda 3 | NC | NC | 21.31 | 23.70 |
| Soda 4 | 22.81 | NC | NC | 26.07 |
| Soda 5 | NC | NC | 22.40 | 27.03 |
| Average (kg/ day) | 34.36 | 40.71 | 22.28 | 26.96 |
NC: It was not collected in that year
Note: Research's own source
An average generation rate of 48.53 kg/day was obtained throughout the sampling period. This data can be comparable to that obtained by Arguedas (2017), where the daily generation rate obtained was 158.83 kg/day, an extremely high value compared to those obtained in our study, however, the number of people who consume the dish of the day in this soda is considerably higher, so more waste generation was expected.
Regarding the specific generation rates for each type of waste, Soda 2 had a decrease in the generation rate of raw waste from 19.30 kg/day in 2013 to 14.58 kg/day in 2015, and for the cooked waste it went from 27.55 kg/day in 2013 to 14.75 kg/day in 2015. However, in 2016 there is an increase in both organic and cooked waste in this soda that generates an alarm respect to the generation of waste in that year compared to the other years, in addition, there is a higher rate of generation of crude waste in this soda (Figure 3).
In the case of the rates of generation of organic waste cooked by visitor during 2014, and corresponding to food waste, a generation of 0.106 kg of cooked waste/day/visitor was obtained for this same soda for a sample of 224 users, while for Soda 1, the generation rate was 0.046 kg of cooked waste/day/ visitor for a sample of 471 users.
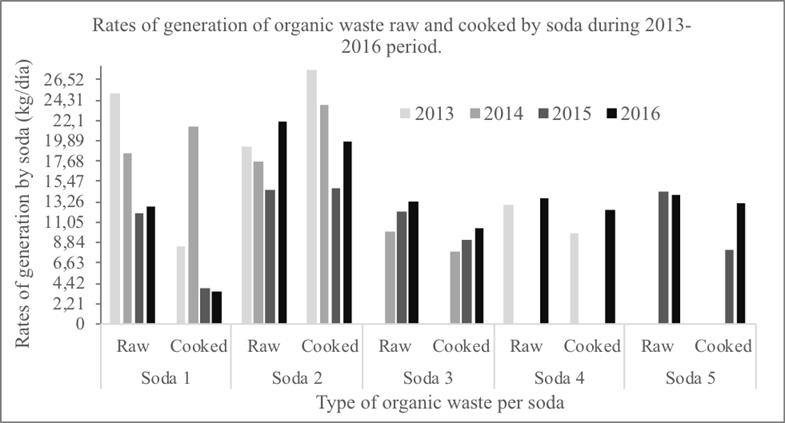
Figure 3 Rates of generation of organic waste raw and cooked by soda during the period 2013-2016. Note: Research's own source
Sodas 1 and 2 present a higher generation rate related to the amount of visits or users resulting from a specific preference. According to León and Collantes (2015), the main reason why people select a food site is the taste or quality of the food, followed by the service offered and then the proximity to the place. In Soda 2 there is a high level of visitation, possibly due to the quality of the food, however, this is the soda that generates the most waste generated.
Soda 1 is visited mainly because of its proximity to the Faculties of Philosophy and Letters, Social Sciences, General Studies Center and administrative buildings, which are highly staffed. However, in spite of being highly visited, it is the soda in which it is evidence a clear decrease in the generation of waste over time. This may be due to a greater interest of the staff, specific practices or better controls in the portions, knowledge of the preferences or tastes of the users among many other aspects that can lead to being more visited sites than others (Carretero, 2016).
According to the above, there is a need to apply more specific methodologies to determine which area of the soda should be improved in order to avoid waste or loss of food to a minimum. According to (Red Costarricense para la disminución y PDA, 2017), it is necessary to analyze the areas where the greatest loss or waste of food is occurring, either in the part of the warehouses where food is stored and due to damage/expiration are discarded as raw waste, or in the part of preparation of food where for some reason as to the quality of the food or bad cooking processes cannot be served, or finally in the part of dishes served whose proportion of waste varies between 29 and 81% of the entire production process. This data should generate awareness in the people who visit these food centers.
On the other hand, the surveys evaluated indicate that out of 71 people 67 regularly attend the sodas, 43 people do so because of their proximity to their faculties or classrooms, followed by the quality of the food (20 people). 55 people indicate that food has good quality and 12 that food has poor quality due to bad taste, it is not fresh, because of the texture of the food is not adequate, among others. One of the aspects that is striking is that most people think that in Soda 2 the size of the portions is adequate, however it is evident that in this soda more cooked waste is generated, which is why the reasons for applying strategies and concrete solutions.
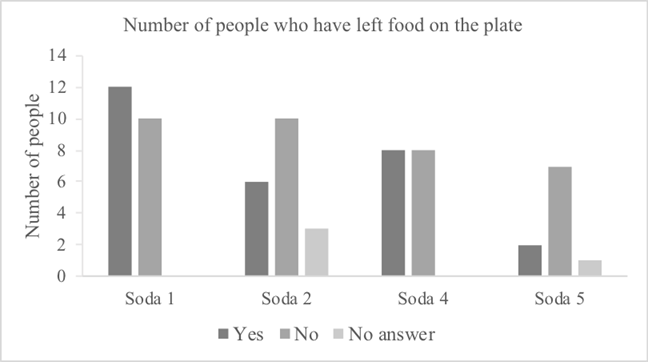
Regarding whether they have left residues on the plate, 28 people indicated yes and 35 no, being Soda 1 where they have left most food, mainly due to the bad taste of the food (Figure 4). Regarding if they consider that the waste of food is a problem that must be given importance, survey said that 61 people indicate that it is, 4 that is not and 2 people did not comment, which indicates that for most people it is a serious problem of great importance and that requires paying attention.
On the other hand, the reduction rate obtained for Soda 2 was 15.6% which indicates that users are wasting around 15.6% of the dish served, while in Soda 1 the reduction rate was 6.8% of the dish served. This indicates that Soda 2 has the largest percentage of the food in the dish wasted, so specific studies must be carried out to find the reasons why more waste is being generated in this soda. Strategies such as reducing the size of the portions and sensitizing the population about avoiding the waste of food.
In the study of Ruiz (2012) the generation of waste is analyzed according to the number of people who consume those foods, the generation rate per person was 0.33 kg/day/ visitor taking into account 10,000 students in four months of sampling. These data are superior to those obtained in the Omar Dengo Campus (0.106 kg/day/visitor of 224 students in one of the sodas and 0.046 kg/day/visitor of 471 students in another soda).
However, it should be noted that our sampling was carried out in one year. In another university in Mexico, the UNAM, a generation rate per person of 0.11 kg/person was obtained, quite similar to that obtained in Soda 2 in our sampling. While in the UABC, 0.05 kg/person was obtained, quite similar to that found in Soda 1 of our study. Although the number of users in the sodas of these universities are different, the same tendency to generate food waste is observed, the behavior of people must also be taken into account in order to avoid this problem. Many times parts of the food are discarded due to the aesthetics or preferences of the person, due importance is not given to the food, the nutritional importance of it is not measured, or even discarded by diets or myths (Carretero, 2016).
Although there is a generalized decrease of cooked residues in the different sodas of the campus over the years, the presence of a program for the collection of this waste in the University should be highlighted, which recollects almost 100% of the organic residues of all the sodas of the campus, giving them a management to avoid them being moved to sanitary landfills, protecting the environment from the production of greenhouse gases and other effects. In other universities this does not happen, in the United States, for example, according to Vargas et al. (2015) only 45% of all their universities process their organic food waste while 65% do not. On the other hand, in Mexico, universities are proposing to comply with the waste management process, conducting research and proposing concrete plans. The Technological University of Salamanca, determined that 72% of the waste generated in the campus has the potential to be composted, which is why they want to implement a solid waste management system and avoid that these are transferred to landfills (Vargas et al., 2015).
The main goal of the UNA Campus Sostenible program is to achieve an adequate management of solid waste in order to improve the environmental quality of the institution. However, the culture of students in universities directly influences the degree of generation of waste. It requires a change in the culture of the people, if there is no adequate environmental education and awareness of the social problems involved in the generation of waste, it is difficult to minimize and eradicate this problem. Also, as already mentioned above, produce food and prepare it has an associated economic cost, so an economic loss can occur. In addition, the contrasts that exist in the access to food in highly developed and underdeveloped countries increases poverty and social inequality and that is generating hunger problems in many countries. (UNESCO & UNEP, 2015).
The food waste should be measured in a more profound way, with already established methodologies that allow determining what the causes are of food waste, where the problem is and what aspect should be given the most attention. All of this in order to identify possible solutions to this problem, for example, a better and effective handling of food, more control in the process of buying and storing products, new and better cooling or cooking systems, or from the point of view of the user, with more accurate portions, better taste of the food, customer service among many others (Red Costarricense para la disminución y PDA, 2017).
In addition, it must be taken into account that producing food requires the investment of energy, natural resources, human hand, money, time, among many others in order to produce it from the fields, transport it to sale sites, sell it and consume it (Carretero, 2016). This is why people should pay attention to waste management and raise awareness in order to make the process as efficient as possible.
Conclusions
The results obtained indicate variations in the rate of generation of waste in each soda and over the years. Aspects in the management and use of food in the kitchen by chefs and dealers is necessary to control the generation of raw organic waste. For example, some measures such as the use of some husks that can be consumed as vegetable garnishes of some foods would decrease this type of residue in each soda.
On the other hand, the rate of generation of cooked organic waste, which constitutes waste generated by users, must be managed through the implementation of improvement actions in each of the sodas to minimize food waste. For example, the creation of awareness campaigns on the issue of food waste, in addition to greater study and control by the sodas in the calculation of the portions cooked and served, which as indicated in the results the amount of User visitation in the sodas is related to the generation of this waste so for sodas it should be important to know as much as possible which is the population that visits them and how to control their food production.
At the National University, continuous work is being carried out on the management and use of the organic solid waste generated by the Omar Dengo Campus sodas from an innovative perspective that encourages the use of technology to improve the efficiency of the organic harvesting process. The daily generation rates found throughout these years have a tendency to decrease from 2013 that began the formal collection to 2016, which is part of the proposed objectives to prevent waste being taken to a landfill and thus reduce the environmental impact, encouraging circular economies.
However, the generation of organic waste must be addressed in different ways since it is a dynamic system that is constantly changing personnel, periods of recess, generational and dietary changes, technological advances, modification of management systems and also in the legislation
Regarding the reduction of this waste, work should be done on the issue of awareness both for the population of university users and for the staff of the sodas. So, it is worked in a campaign to educate and sensitize the population on the issue of Food Loss and Waste, and that can be quantified with specific methodologies. In this way you can know exactly what the reduction of food waste is.

