


 English (pdf)
 Article in xml format
 Article references
 Send this article by e-mail
 Cited by SciELO
  Similars in
SciELO
Similars in
SciELO 
 Permalink
Introduction
The estimation of age is important for human identification in civil and criminal proceedings. Teeth are the hardest tissue structure in the human body and can withstand nutritional deficiencies, and high physical and chemical stresses over time (1,2,3,4). Hence, teeth are used for dental age estimation (DAE) in many forensic applications by varied techniques and aids. In children and adolescents, DAE is based on the development and eruption of teeth as opposed to methods in adults where dental development is complete (5,6). However, adult teeth present important physiological modifications throughout life, such as the formation of secondary dentin which causes a reduction of pulp volume (7,8). Therefore, DAE can be performed by analyzing dental pulp volume in different age groups, showing a reduction in volume with progressing age (9,10,11).
The pulp volume of teeth can be assessed by two-dimensional (2D) and three-dimensional (3D) radiographic images including cone beam computed tomography (CBCT). These techniques have several advantages of being minimally invasive, no requirement of tooth extraction, and are applicable in different population groups (12,13,14). Of the two radiographic methods, 3D-CBCT is more accurate as it measures the exact size and volume of the dental pulp, based on voxel size, exposure time, and equipment accessibility (15,16).
Previous studies attempted to study association of pulp volume with age both 2D and 3D radio- graphic methods but showed conflicting results. Kvaal et al. (1995) used periapical radiographs to study different pulp-tooth ratios (pulp-root, Pulp-tooth, tooth-root, pulp-root width) in six different types of teeth of 100 patients. Results showed a significant association of pulp-root and pulp-tooth ratio with advancing age and a linear regression of (R²=0.76) for age, demonstrating a strong correlation.9 Vandevoort et al. (2004) used micro-computed tomography (CT) of 43 single root teeth for calculating the pulp-tooth volume ratio and found a weak association (R²=31%) between biological age and volume ratio (17). Asif et al. (2019) assessed pulp volume on CBCT scans of 300 intact teeth classified into 5 age groups from 16-65 years. They found a strong correlation of pulp volume with age: maxillary right central incisors (r=0.83), right canines (r=0.74), and left canines (r=0.73).(7) Kazmi et al. (2019) used CBCT images of maxillary and mandibular canines of 368 females and 349 males in the age group of 15-65 years. They found mandibular canine pulp volume and sex as strong predictors in the regression equation formulated for estimating age (R²=0.33) (18).
Although previous literature has studied association between pulp volume and age, a major limitation has been the use of different categories of representative teeth from different individuals. Hence, the current study utilized CBCT scans of five categories of teeth from the same individuals for age estimation in a Peruvian sample.
Methods
Study Design and Ethical Approval: This was a retrospective, cross-sectional, observational study. Ethical approval was obtained from the institutional committee of research ethics (Record No.230 CIEI-Scientific-2019).
A pilot study was carried out using 30 CBCT images for pulp volume assessment for calibration purposes. The volumetric readings were performed by 2 operators (JS and EA), and repeated at a gap of two weeks. Intra-class correlation coefficient (ICC) analysis was performed to determine intra-examiner, and inter-examiner reliability. The ICC results were greater than 0.90, indicating excellent reliability.
Study sample
The study sample consisted of CBCT records of patients who attended a private oral and maxillofacial facility from 2018 to 2019. All the records of 231 patients were included in the study comprising 134 females and 97 males (12-60 years old). CBCT images of these patients were further categorized into six sub-groups, as descri- bed in previous studies (7,8,9,11,12,13,14,15,19).
The groups were classified into six groups according to age as follows:
Group 1: 12-19 years (y)
Group 2: 20-29 y
Group 3: 30-39 y
Group 4: 40-49 y
Group 5: 50-59 y
Group 6: 60 y and older.
From each CBCT image, 5 teeth were selected for volumetric measurement of the dental pulp, resulting in a total sample of 1155 teeth. The five teeth studied in each CBCT image were: the upper right canine (U13), upper left central incisor (U21), upper left canine (U23), upper left first molar (U26) and lower left first premolar (L34), as described previously (7,9,17,18).
Inclusion Criteria
The CBCT records for the study were selected based on known chronological age and the presence of outlined five teeth in high resolution, teeth in good condition (no caries or associated pathologies), and no obvious morphological abnormalities.
Processing of images
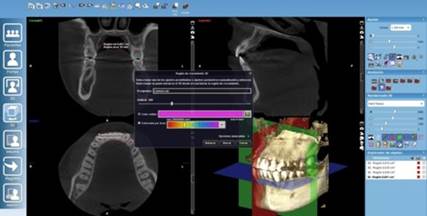
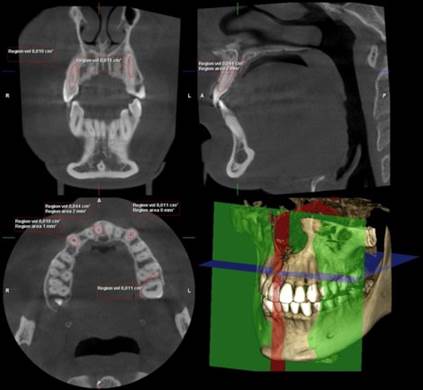
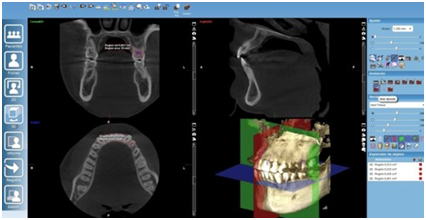
The images were obtained from Pro 3D Mid CBCT unit (PlanMecaR, Helsinki, Finland) using a 150 to 200 micron voxel size, 90KVp tube current, 10mA tube voltage with time exposure of 13.5 seconds. Data files were imported to the Romexis®5.3.3.5 software (MecaR Plan, Helsinki, Finland), and each image was oriented into axial, coronal and sagittal planes (Figure 1). The pulp cavity was delimited manually using the different values of the default threshold in order to detect the borders (highest) of the pulp cavity. Each tooth was measured for pulp volume by the software for 30 minutes, and the volume was automatically individually calculated in mm³ (Figure 2, Figure 3).
Statistical analysis
The statistical program STATA 14.0 was used for data analysis. A descriptive analysis of the response variable (tooth pulp volume) was calculated using summary measures for numerical variable: mean and standard deviation (SD). Multiple linear regression was performed to determine the predictor variables of the patient's age, and the sex-related predominance with age. The level of significance was 5%.
Results
The response variable was calibrated by the ICC in 30 selected CBCT. It depicted the intra-examiner reliability for U13, U21, U23, U26, L34 to be 0.984, 0.997, 0.996, 0.997 and 0.995 respectively and the inter-examiner reliability for U13, U21, U23, U26, L34 as being 0.917, 0.956, 0.987, 0.997 and 0.985, respectively.
Sex-based differences in pulp volumes (Table 1): The average pulp volume in males was greater than in females for all the representative teeth. Of all the teeth, the average pulp volume of U23 in men was the highest (20.54 mm³) compared to women (17.31 mm³)
Inter-group differences in pulp volume (Table 1): The pulp volume was highest in Group 1 and lowest in Group 6 for U13, U21, U23, L34 while in U26, the pulp volume was highest in Group 1 and lowest in Group 4. There was a statistically significant difference between the pulp volume of U13, U23, L34 and sex, and between all categories of teeth and age groups.
A multiple linear regression equation was developed from predictive variables associated with U13, U21, U23 and U26 to estimate the age of the patients, based on p value and confidence interval (Table 2). At an adjusted coefficient of determination (R²) of 30% (p=0.001), the equation was as follows:
Age= 55.616-0.376 (U13)-0.434 (U21)-0.284 (U23)-0.141 (U26).
To estimate the age in men, a multiple regression equation based on predictive variables of the pulp volume of U13, U21, U23, and U26 was formulated. At an adjusted R² of 42% (Table 3), the model was not predictive, showing only an association with age. The equation was as follows: Male age= 61.926-0.563 (U21)-0.579 (U23) -0.305 (U26).
To estimate age in women, a multiple linear regression equation based on predictive variables of the pulp volume of U13, and U21 was formula- ted. At an adjusted R² of 23% (Table 4), the model was not predictive, and was only associated with age. The equation was as follows: Female age=49.263-0.478 (U13) -0.512 (U21)
Table 1 Descriptive evaluation of pulp volumes measured in mm³ with the mean and standard deviation (SD) of the right upper canine (U13). Upper left central incisor (U21). Upper left canine (U23). Upper left molar (U26). And lower left first premolar (L34) according to sex and age group.
| Variable | - | U13 Mean ± SD | U21 Mean ± SD | U23 Mean ± SD | U26 Mean ± SD | L34 Mean ± SD |
|---|---|---|---|---|---|---|
| Sex | Female | 17,31±9,49 | 14,11 ±7,63 | 17,36±9,09 | 22,24±11,95 | 13,75±7,35 |
| - | Male | 20,54±8,42 | 15,95±8,00 | 20,81±8,68 | 25,75±13,54 | 16,06±8,13 |
| p-value | 0.003* | 0.060* | 0.001* | 0.066* | 0.034* | |
| Age (years) | 12-19 | 26,76±6,70a | 22,77± 4,31a | 27,60±6,21a | 30,79±9,32a | 21,30±3,89a |
| - | 20-29 | 16,77±8,51a | 12,69 ±5,97a | 16,35 ±7,75ab | 20,75±11,78a | 12,83±6,62ab |
| - | 30-39 | 17,68 ±9,15ac | 13,04 ±8,89a | 16,60 ±8,86ab | 23,81±11,28a | 12,85±8,65ab |
| - | 40-49 | 14,87 ±7,98bc | 12,80 ±6,70a | 16,09 ±7,94b | 22,44±15,99b | 13,64 ±7,41b |
| - | 50-59 | 16,75 ±7,49bc | 12,36 ±6,62a | 17,00 ±8,32b | 17,21±8,64a | 12,11 ±7,61b |
| - | 60 + | 11,90 ±7,78ab | 8,70 ±4,74a | 11,70 ±5,38ab | 23,90±17,58ab | 9,80 ±7,12ab |
| p-value | - | p<0.001** | p<0.001** | p<0.001** | p<0.001** | p<0.001** |
*Student’s t-test for independent samples
**Kruskal-Wallis test
Different lowercase letters imply statistical significance
Table 2 Multiple linear regression model to estimate age based on pulp volume (mm³) of the right upper canine (U13). Upper left central incisor (U21). Upper left canine (U23). And upper left molar (U26).
| Tooth | Coefficient | Standard error | p | 95% Confidence interval |
|---|---|---|---|---|
| U13 | -0,376 | 0, 099 | P<0,001 | -0,573 to -0,180 |
| U21 | -0,434 | 0,122 | P<0,001 | -0,674 to -0,193 |
| U23 | -0,284 | 0,107 | P<0,008 | -0,495 to -0,073 |
| U26 | -0,141 | 0,066 | P<0,033 | -0,270 to -0,011 |
| Constant | 55, 62 | 2,41 | 0.001 | 50,86 to 60,37 |
*The multiple linear regression model had an adjusted R²: 30%, p=0.001.
Table 3 Multiple linear regression model to estimate age in men based on the pulp volume (mm³) of the upper left central incisor (U21). Upper left canine (U23). And upper left molar (U26).
| Tooth | Coefficient | Standard error | p | 95% Confidence interval |
|---|---|---|---|---|
| U21 | -0,563 | 0,174 | P<0,002 | -0,909 a -0,216 |
| U23 | -0,579 | 0,166 | P<0,001 | -0,909 a -0,250 |
| U26 | -0,305 | 0,093 | P<0,002 | -0,490 a -0,120 |
| Constant | 61.93 | 3.62 | 0.001 | a 69.11 |
*The multiple regression model had an adjusted R²: 42% in males; p=0.001.
Table 4 Multiple linear regression model to estimate age in women based on the pulp volume (mm³) of the right upper canine (U13). Upper left canine (U23).
| Tooth | Coefficient | Standard error | p | 95% Confidence interval |
|---|---|---|---|---|
| U13 | -0,478 | 0,117 | P<0,001 | -0,711 a 0,246 |
| U23 | -0,512 | 0,146 | P<0,001 | -0,801 a 0,223 |
| Constant | 49,26 | 2,61 | 0,001 | 44.10 a 54.42 |
*The multiple regression model with adjusted R²: 23% in females; p=0.001.
Discussion
Measurement of dental pulp size by CBCT is an established non-invasive age estimation technique for adults which allow accurate measurement of pulp volume changes with advancing age as a result of secondary dentin deposition (12,19). This technique currently uses low-dose radiation and produces high-resolution images (3,20). Analysis of the volume of dental pulp and the pulp chamber is more reliable than area calculation as secondary dentin formation may give an incorrect projection of irregularity due to discontinuity. In the present study image projection and analysis of CBCT images of teeth for pulp volume measurement was carried out in approximately 30 minutes per tooth unlike other studies, in which the estimated evaluation time of pulp volume evaluation was much longer (7,12,21).
The U13, U21, U23, and L34 teeth were chosen for evaluation because they have a simpler, straighter root anatomy and a wider pulp cavity compared to the lower incisors, and these teeth have been used in many studies (18,19,22,23). These characteristics facilitate the delimitation of the pulp cavity, allowing accurate and rapid analysis and measurement of pulp volume. The U26 tooth included in the current study presents the widest pulp chamber and is suitable for assessment of pulp volume reduction with age (3,4,5,6,12,15,22,23).
The current study excluded teeth from patients with systemic diseases and dental restorative treatments as they may influence pathological formation of secondary dentin (24,25).
Previous studies have shown that CBCT is successful in the analysis of pulp volume of single and multi-rooted teeth (12,15,26). The present study showed a decrease in the pulp volume of upper canines with age, in accordance with the results of previous studies (19,23,27).The pulp volume of teeth in Group 6 (aged 60 years and above) was the lowest in all teeth except U26, in agreement with the results of previous studies (12, 26,28). In contrast, a study carried out by Oi et al. in 2004 demonstrated that the pulp volume of the upper first premolars showed a large decrease in individuals aged between 20 and 40 years but beyond that age, there was no significant reduction (29). This difference may be attributed to limited sample of premolar teeth in this study compared to our study.
In our study, 30% of the variability with age was explained by the pulp volume of U13, U21, and U26, similar to a previous study which obtained a coefficient of determination (R²) of 31% analyzing the upper central incisors, upper canines, and left lower canine (30). Different teeth gave different R² values for age in different studies, including lower canines (R²=39.7%),(19) incisors (R²=41%), (12) canines (R²=7%), (12) and premolars (R²=23%) (12). A lower R²=21% with the upper central incisors, reported a weak correlation between pulp volume and age, which was probably due to the secondary dentin formation by external stimuli (8). Therefore, as dental development is complete, the ability to accurately estimate dental age is reduced, due to degenerative changes in the teeth such as attrition, abfraction, erosion.
The regression equations generated in the current study to estimate dental age in men and women used different teeth with R² value of 42% and 23% respectively. Similar regression equations have been generated in previous studies (4, 5,12,19). However, few studies have reported a higher coefficient of determination for women in contrast to the results of the current study (4, 8,12,15). This may be due to a smaller sample size of the teeth in our study, which is one of the limitations of the current study.
The equation variables generated in the present study are age and pulp volume of the upper canines, left central incisor, and left upper first molar. But due to lower R² value, it is not useful for the prediction of age, and can be used only for association. Our results were similar to a previous study by Porto et al. (2015) which studied 118 central incisors across 5 age groups showing a weak correlation of pulp/tooth volume ratio with age, with R²=21% (8).
The lower left premolar did not contribute to the generation of the linear regression equation model, and was, therefore, not included in the equation. In addition, there was no linearity between any of the independent variables.
Our study has a few limitations. There was an unequal distribution of participants in the different age groups due to the difficulty in finding images of adult patients with all their teeth present. Also, the variability in the size of the teeth studied caused disparity in the sizes of the pulp cavities. Further studies should include a larger sample of individual age groups and study similar categories of teeth for uniformity and better reproducibility.
Conclusions
The present investigation analyzed the relationship between chronological age and dental pulp volume in five categories of teeth in the same adult individual.
The following conclusions were drawn:
Linear regression equations were generated for the estimation of age using pulp volumes of multiple teeth independent of sex, and also separately for males and females.
A low coefficient of determination (R²) of 30% indicated a low predictive value of indepen- dent variables of pulp volumes of respective teeth, also suggesting a weak association between pulp volume and age.
The pulp volume of the upper right and left canine decreased as age increased. The results show that the pulp volume of the teeth in people aged 60 years and over was the lowest among all the teeth except U26.
Further research is needed to confirm the reproducibility of the model and obtain a reliable formula with a high predictive potential.
Author Contribution Statement
Conceptualization and design: J.M.S.G.
Literature review: J.M.S.G. and E.R.A.M.
Methodology: J.M.S.G. and A.D.S
Validation: A.D.S.
Formal analysis: J.M.S.G.
Research and data collection: J.M.S.G.
Resources: J.M.S.G.
Data analysis and Interpretation: A.D.S.
Writing-preparation of the priginal draft: J.M.S.G.
Writing: review and editing: J.M.S.G., E.R.A.M., P.K., A.C., Y.W.V.M. and A.G.R.Q.
Supervision: E.R.A.M.
Acquisition of funds: J.M.S.G.

