


 English (pdf)
 Article in xml format
 Article references
 Send this article by e-mail
 Cited by SciELO
  Similars in
SciELO
Similars in
SciELO 
 Permalink
Introduction
Soccer is a sport requiring movements such as changes of direction, sprints, and specific technical actions to fulfill defensive and offensive actions that this discipline demands (Bangsbo et al., 2006). Therefore, an approach to develop each of the technical-tactical, physiological, and biological qualities can optimize the performance in each preparatory stage of the soccer player (Benítez Sillero et al., 2015).
In general, strength training will be essential to improve explosive actions included in most specific sports gestures. In this sense, since it is a basic physical quality, it should be trained both in a general and specific way. Mechanical power is the most interesting manifestation of performance strength in most sports disciplines, including soccer (Hoff & Helgerud, 2014). Various studies have analyzed the results of implementing a strength training program as a basis for applying high-intensity movements in cadets, youth categories (Frazilli et al., 2011), and adults (Hernando & García García, 2012).
Soccer is composed of complexities, and has grouped different physical, physiological, psychological, contextual, technical-tactical, strategic factors and complex actions as physical performance indicators through individual and collective executions such as attacking, defending, and teamwork, which eventually become uncertain situations in the field of play (Benítez Sillero et al., 2015). Grouping factors have led soccer science to study each of the measurable parts for player preparation and development skills.
However, few studies have compared performance in groups of different sports ages in soccer. In this sense, some studies have described body composition, speed, agility, and aerobic endurance as sports performance factors in soccer players in specific stages of training (Benítez Sillero et al., 2015; Calahorro Cañada et al., 2012; Hernando & García García, 2012; Jorquera Aguilera et al., 2012). In addition, these factors have been considered crucial for the search for talent and the specific improvement of the player in his position (Whitehead et al., 2018).
Some studies have shown that the focus on youth sports ages must be based on developing specific soccer skills and not on the improvement in body composition (Borbón & Alvarado, 2013). However, it is proposed that good muscle development, jump, counterattack, and offensive capacity are the key aspects for the optimal performance of the high-intensity actions required by competitive soccer in adulthood (Jorquera Aguilera et al., 2012; Sánchez Ureña et al., 2011).
For the analysis of specific qualities, different methods of internal load analysis have been used in the face of efforts such as displacement, explosive actions, oxygen consumption, heart rate (García García, 2005; Granero-Gil, et al., 2020; Granero-Gil, Gómez-Carmona, et al., 2020), lactate level, muscle glycogen, and markers of muscle damage, among others (Zarzuela Martín, 2013). However, new technological tools, such as tensiomyography (TMG), have facilitated the incorporation of the analysis of the muscular response to different actions (Rodríguez-Matoso et al., 2012), becoming a tool used in sports such as soccer (Rojas Valverde et al., 2016, 2018). No scientific studies applying TMG at different professional levels in this sports discipline have been conducted.
In this sense, relatively few studies compiled in systematics reviews have been found that provide information about comparing variables, such as muscle power and neuromuscular function characteristics, in soccer based on sample characteristics as quality and level, among others (Macgregor et al., 2018; Martín Rodríguez et al., 2017). In Costa Rica, comparisons between quality levels among professional soccer players are scarce and require further analysis in order to propose methods and means of physical training (Borbón et al., 2017; Morera-Barrantes et al., 2021). Therefore, this study aimed to compare the mechanical and functional muscle performance of three different competitive soccer teams of Costa Rica professional league (U17, Pro A, Pro B).
Methods
Participants
Fithy-seven senior and youth elite male soccer players from Costa Rica First Division teams took part in this study, and all performed the assessments described below (age 20.09 ± 4.32 years; weight 70.85 ± 7.45 Kg, height 174.56 ± 4.97 cm; body fat 13.9 ± 5.06%, total lean mass 57.90 ± 4.88 Kg; right hemisphere mass 10.11 ± 0.87 Kg; leth hemisphere mass 10.09 ± 0.92 Kg). All were volunteered to participate in this study and were assigned to three different groups: under 17 (U17, n=16, body mass: 68.01±5.93 kg; height: 173.99±3.86 cm), professional group A (top table) (PRO A, n=17, body mass: 67.97±7.05 kg; height: 173.37±6.05 cm), and professional group B (middle table) (PRO B, n=29; body mass: 74.11±7.31kg; height: 175.55±4.88 cm) (see Table 1). The players were selected for convenience and for being members of a club with different levels regarding the category in which to participate (based on quality and age). The PRO A team is a member of the highest category, the PRO B team is a participant in the second category, and the U17 team is part of the club’s affiliates.
All participants were apparently healthy, and no reports of neuromuscular injury or dysfunctions were reported. All participants used to train 4-5 times per week and competed in 1-2 matches per week. The players used to play regular positions described by previous literature as midfielders, defenders, strikers, but no analysis was made in this sense due to frequent changes in players’ positions (Baptista et al., 2018; Granero Gil, Gómez-Carmona, et al., 2020). During the first visit, all experimental procedures were explained to the participants, and a written informed consent was obtained from each subject; when required, legal guardians gave their consent and minors gave their ascent to participate. This study was approved by the Institutional Science Ethic Committee that complies with the 2008 Helsinki Declaration for Human Research Ethics.
Procedures and devices
Testing protocol . The assessment protocol consisted of two visits to the evaluation center. All participants were familiarized with the assessment’s procedures before the start. Ather two days, the participants performed the first and unique assessment session: body composition test, jump performance test, and muscular tensiomyography assessment.
Body composition . For the measurement of body composition, the participants were asked to remain under light clothing (underwear). Body composition was evaluated using a Dual-energy X-ray Absorptiometry (DXA)-scanner (GeneralElectric). Total body mass (kg), body fat percentage (kg), total lean mass (TLM) (kg), right lower limb lean mass (RLM) (kg), and leth lower limb lean mass (LLM) (kg) were calculated. One experienced technician performed all the scans in the present study to avoid any inter-tester differences.
Neuromuscular Function Assessment . At the beginning of each experimental trial, subjects performed a brief warm-up of 120s cycling (self-selected intensity) before completing dynamic stretch movements. Subjects then completed two trials, each of the counter movement jump (CMJ) and squat jump (SJ), separated by 2 min of rest. Both tests were assessed on an AXON JUMP Portable platform (sampling rate of 1000 Hz) (Kistler Group, Winterthur, Switzerland). For CMJ, the subjects were asked to perform the eccentric component of the jumping movement as fast as possible. The participants were asked to keep their hands on the hips throughout the jump in order to reduce any upper body impulse. The best result of three CMJ and SJ were retained for analysis. There was one min rest between jumps to reduce the fatigue effect. Ather 2 min of recovery, the subjects performed the SJ. In this case, they were instructed to keep the hands on the hipsand squatted down until knees were flexed at ~90°, followed by a subsequent action. No countermovement of the upper body was allowed before SJ execution. Similar to CMJ, 1 min rest was stablished between jumps. All muscle functional assessment followed previous reported protocols for similar populations (Rojas-Valverde et al., 2019, 2020; Sánchez-Ureña et al., 2018).
Mechanical muscle properties . A tensiomyography (TMG) (TMG, Ljubljana, Slovenia) was used to assess muscle properties of the right rectus femoris (RRF) and leth rectus femoris (LRF). Participants remained relaxed throughout all the TMG assessment. For both RF, the participants were asked to be in supine position. A specific cushioned pad was used to fix femorotibial joint at 120°. The tensiomyographic variables assessed were maximal displacement (Dm), time of contraction (Tc), sustain time (Ts) and delay time (Td). Dm stands for the muscularly measured distance between the lowest point (rest) and the highest position (highest muscle radial displacement). Tc refers to the time it takes for Type I skeletal muscle fibers to transform from 0 to 90% of Dm. Ts is the amount of time needed to reach 50% of Dm. Td is the amount of time it takes for Dm to go from 0 to 10% (Gutiérrez-Vargas et al., 2018; Rojas-Valverde et al., 2018; Sánchez Ureña et al., 2018).
After RF skin was carefully cleaned, two 5 cm2 adhesive electrodes were attached in the respective muscle belly (Sánchez-Ureña et al., 2018). Electrodes were placed 5cm one from each other and the negative electrode was attached distal from the muscle motor point (Gutiérrez-Vargas et al., 2018). Stimuli protocol started at 15 mA; there were gradual increments of 20mA until 100mA were reached (maximal equipment capacity). All protocols for the assessment of neuromuscular and mechanical characteristics using TMG followed the processes previously reported (Gutiérrez-Vargas et al., 2018; Rojas-Valverde et al., 2018; Sánchez-Ureña et al., 2018). TMG parameters reliability has been proven, obtaining excellent inter-rater results by the evaluators for Dm, ICC=0.98; Tc, ICC=0.918; Td, ICC=0.923 (Rojas-Valverde et al., 2020).
Statistical analysis
Data collection, treatment, and analysis were performed using the SPSS for Windows statistical package (v.21.0). Descriptive statistics were employed using the mean (M) and standard deviations (± SD). Results are expressed as means ± standard deviation (SD). The normality of the data for each of the variables was checked by the Shapiro-Wilk test and the Levene test for homogeneity of variance. A one-way analysis of variance and Bonferroni post hoc was used to investigate differences in variables. For all procedures, a level of p≤ 0.05 was selected to indicate statistical significance.
Results
Table 1 shows the body composition values for all groups. There were no significant differences in TMM, RHM, and LHM between three groups. Nonetheless, the results showed a significant difference in body mass (F (2,61)= 6.07, p= .004) and fat % (F (2,61)= 6.14, p= .004) in favor to PRO A compared to U-17 and PRO B (Pro B with the highest value).
Table 1 Body composition descriptive values according to experimental group
| Variables | Team | n | Mean +- SD | Min. | Max. |
|---|---|---|---|---|---|
| Body Mass (kg) | UI 7 | 1 | 68.01 +- 5.93 | 59.70 | 81.50 |
| PRO A | 16 | 67,97 +- 7.05 | 57.10 | 82.70 | |
| PRO B | 29 | 74.11 +- 7.31* | 61.60 | 89.40 | |
| Total | 62 | 70.85 +- 7.45 | 57.10 | 89.40 | |
| Height (cm) | UI 7 | 17 | 173.99 +- 3.86 | 166.50 | 180.00 |
| PRO A | 16 | 173.37 +- 6.05 | 164.00 | 186.00 | |
| PRO B | 29 | 175.55 +- 4.88 | 165.00 | 185.00 | |
| Total | 62 | 174.56 +- 4.97 | 164.00 | 186.00 | |
| Fat percentage (%) | UI 7 | 17 | 11.82 +- 4.07 | 5.90 | 20.70 |
| PRO A | 16 | 12.28 +- 4.12 | 5.70 | 20.80 | |
| PRO B | 29 | 16.21 +- 5.25* | 6.90 | 27.60 | |
| Total | 62 | 13.99 +- 5.06 | 5.70 | 27.60 | |
| Total Lean Mass (kg) | UI 7 | 17 | 58.04 +- 4.36 | 51.11 | 67.02 |
| PRO A | 16 | 56.36 +- 5.48 | 47.70 | 69,8 | |
| PRO B | 29 | 58.67 +- 4.79 | 49.62 | 66.36 | |
| Total | 62 | 57.90 +- 4.88 | 47.70 | 69.80 | |
| Right Iower limb Lean Mass (kg) | U-17 | 17 | 10.09 t+-.91 | 8.73 | 11.78 |
| PRO A | 16 | 10.01 +- 1 .12 | 8.30 | 12.45 | |
| PRO B | 29 | 10.17 + .72 | 8.83 | 11.47 | |
| Total | 62 | 10.11 + .87 | 8.30 | 12.45 | |
| Left Iower limb Lean Mass (kg) | U-17 | 17 | 10.02 t .84 | 8.57 | 11.73 |
| PRO A | 16 | 9.91 + 1.1.3 | 8.36 | 12.16 | |
| PRO B | 29 | 10.24 Db .85 | 8.78 | 11.83 | |
| Total | 62 | 10.09 t .92 | 8.36 | 12.16 |
Figure 1 represents the height (cm) obtained for all groups in the SJ and CMJ test. A significant difference (F (2,61)= 3.64, p= .032) was observed for SJ between U-17 (33.02±3.37 cm) and PRO A (29,81±4.38 cm). However, no significant differences (F (2,61)= 1.89, p= .160) were noticed in CMJ for any groups.
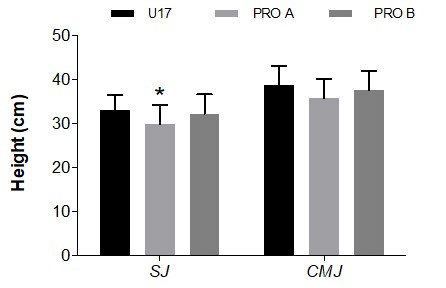
Note: * = significant differences between U17 groups and PRO A (p<0.05). SJ = Squat Jump, CMJ = Countermovement Jump.
Figure 1 Pooled data of values obtained in Squat Jump and Countermovement Jump for all groups
Table 2 shows the TMG values for all groups. There were no significant differences in Dm, Tc, Td or Ts between any groups in function of laterality and category (DmRRF (F (2,61)= .144, p= .866); DmLRF (F (2,61)= 2.470, p= .093); TcRRF (F(2,61)= .763, p= .471); TcLFR (F (2,61)= .188, p= .829); TdRRF (F (2,61)= .199, p= .820) TdLFR (F (2,61)= .554, p= .578); TsRRF (F (2,61)= 2.171, p= .123); TsLRF (F (2,61)= .663, p= .519).
Table 2 Values obtained for all groups in TMG measurement
| Variables | U-17 (n= 17) | PRO A (n = 16) | PRO B (n 29) | |||
| Laterality | ||||||
| R | L | R | L | R | L | |
| Maximal displacement (mm) | 8.6±1.88 | 7.71±1.63 | 8.66±1.92 | 9.22±3.02 | 8.94±2.41 | 9.29±2.50 |
| Time of contraction (ms) | 28.06±2.63 | 29.23±3.49 | 29.55±3.34 | 29.60±3.96 | 29.55±5.27 | 28.83±4.39 |
| Delay time (ms) | 16.17±6.61 | 19.71±16.81 | 17.15±5.58 | 17.66±9.64 | 15.95±6.29 | 16.04±7.98 |
| Sustain time (ms) | 23.31±1.26 | 23.18±1.36 | 23.23±1.50 | 23.32±2.11 | 24.26±2.28 | 23.89±2.64 |
Note: R = Right; L = Leth
Discussion
To the best of our knowledge, this is the first study that describes body composition, jump performance, and muscular tensiomyography parameters of different categories of Costa Rica soccer players. The main findings of this study have shown that body composition and squat performance could be influenced by soccer professional level. Literature have reported some related studies with information of young athletes (Frazilli et al., 2011) and older categories (Hernando & García García, 2012).
The assessment of body composition in professional soccer players has been in the spotlight with respect of some contextual factors as playing position and professional level (Carling & Orhant, 2010). In this line, body composition of elite soccer players is a fundamental aspect of general conditioning in soccer. Some factors such as fat percentage and mean adipose tissue are considered as dead weight that counteract the effectivity of players activities (Ostojic, 2003). It has been reported that some differences in body composition have been found between players of specific professional league (Kalapotharakos et al., 2006). In the current study, significant differences were observed in body mass and fat percentage between both professional teams. In this sense, the team that presented higher values in these parameters occupied a lower position in the classification of the National League of Costa Rica. Similar to our results (Kalapotharakos et al., 2006), some authors have reported a lower fat percentage in players members of top classified teams compared to those representing mid-table or bottom table teams.
Muscular strength is one of the most important components of physical performance in sport in terms of high-level performance (Jaric, 2003; Jarić et al., 1995). In the present study, the mean values in SJ were significantly different between the U17 and PRO A groups. In this line, jumping height has been widely studied (Pääsuke et al., 2001); this indicator depends on some physiological functions that are performed in neuromuscular complex and involve some biomechanical factors (Bosco et al., 1982). However, contrary to our results, other studies have reported that teams with a higher level of professionalism obtained higher performance in the SJ compared to under-17 category. It is possible that the differences in performance observed between the U-17 and PRO A can be explained by the fact that U-17 performance is like that of the level of their age counterparts in other countries, while our PRO A group shows to be under the level compared to the same category players (Lehance et al., 2009). In this sense, U17 players from Belgium perform 36cm of SQ, compared to the Costa Ricans umping 34 cm. In the case of the professional soccer players, Belgians jump near 40cm compared to those analysed in this study that jumped near 30cm (Lehance et al., 2009).
TMG has been used in different studies to evaluate the morpho-functional response of muscle fibers to electrical stimuli, training (Rusu et al., 2013), clinical diagnoses (Seijas et al., 2016), risk factor for knee injuries (Alentorn-Geli et al., 2015), description, and comparison of the dominance sides of different muscle groups involved in soccer (Rojas-Valverde et al., 2018) at different times of the season (Rojas-Valverde et al., 2015). The present study described tensiomyographic values in different categories of soccer, obtaining similar average values or below those reported for the rectus femoris (Rusu et al., 2013).
Within the skeletal muscle structure, there are muscle fibers fascicles that are made up of elements distributed in series. These intramuscular elements are controlled by neuromuscular structures; this control resulted in the required muscle strength needed for control and movement execution. This study has reported the outcome of neuromuscular assessment using TMG technology. Two groups of soccer players been studied depending on their professional level. Some factors such as training frequency, experience, muscle development, and isometric-concentric contraction efficiency as other neuromuscular conditions that may differ between groups could impact neuromuscular performance. All groups had similar time contraction (Tc) and displacement (Dm) at rectus femoris muscle (RF) compared to other similar soccer players of different level (Tc= 22.5-22.4 ms in right RF and 22.6-22.2 ms in leth RF; Dm= 6.57-6.85 mm in right RF and 6.92-7.06 mm in leth) (Rusu et al., 2013). Indeed, other studies have found no differences in TMG parameters based on players category (Rojas-Valverde et al., 2018). The muscle coupling could be similar between professional soccer players, despite they morphological and anthropometric characteristics; this is why some narrow difference could not be present among players of similar ages (Rojas-Valverde et al., 2015).
As for Tc and Dm, this has been established as indicators of greater fatigue or less muscle tone (Rojas-Valverde et al., 2018). According to the results, there are no significant differences between the tensiomyographic variables (Dm, Tc, Ts and Td) according to laterality and group. However, it can be observed that with respect to average values of Tc and Dm, the PRO B group has higher values than the PRO BA group and the U-17 group, which as reported (Rodríguez-Matoso et al., 2012) to a lower Dm, greater muscle tension and less fatigue.
However, it has been reported that it is not possible to associate a standard parameter for the values of Dm, Tc, Ts and Td, due to the fact that it depends on the training methodology, type of sport, and dominance of the player; so far there is a contrast between results of different related scientific research (Rodríguez-Matoso et al., 2012).
In the present study, no significant differences were observed regarding laterality. This is similar to other studies, which reported that the evaluation of the different lower limb muscle groups does not represent a need for assessment unless an isolated evaluation is required.
Limitations
While the results of this study have provided value information about the influence of professional level on muscle and functional performance in Costa Rican soccer players, some limitations must be acknowledged. Because of the punctual assessment during preseason and nature of the tournament, results should be carefully analyzed when changes during the season wanted to be explored. As expected, these results must be addressed considering the specific age range of the sample analyzed; these results should not be extrapolated to other populations that show different muscle contraction behavior because of their age or professional status. A methodological limitation could be that players analyzed came from only one professional league.
Therefore, the patterns observed might reflect only this league in which players compete.
Practical applications
The understanding of the influence of professional level on muscle mechanical and functional performance in soccer players should be addressed by technical staff in order to design specific conditioning training programs, tactical scenarios, match strategies, and recovery protocols during this kind of tournament.
Conclusions
In general, the main findings of this study have shown that body composition and squat jump performance could be influence by soccer professional level. Other variables as muscle displacement, countermovement jump, time of contraction, delay time, and sustain time of the rectus femoris were not affected by professional level in male soccer players.

