


 English (pdf)
 Article in xml format
 Article references
 Send this article by e-mail
 Cited by SciELO
  Similars in
SciELO
Similars in
SciELO  uBio
uBio 
 Permalink
Introduction
Throughout history humans have modified animal and plant characteristics through artificial selection, this process started early when humans domesticated wild animals and plants (Conner 2003) from about 13,000 years ago (Diamond 2002). Evidence for artificial selection of plant characteristics is numerous, and the history leading to artificial selection in many plant species is well known (Cantarel et al. 2021, Casas 2007, Fujino 2021). For example, humans have artificially selected floral characteristics of many species (Callahan 2005, Van Tassel 2010), often through hybridization processes (Abreu et al. 2009, Datta 2021, Marasek-Ciolakowska et al. 2021, Seehausen 2004). Contrary to the development of floral cultivars, which attempts to ''discover'' new morphological variants, ex situ conservation strategies have the objective of preserving the genetic and morphological diversity observed of in in situ populations (Basey et al. 2015, Cibrian-Jaramillo et al. 2013, Guerrant Jr. et al. 2014, et al. 2004, 2006). The literature on conservation biology and ex situ conservation has explored many aspects for plant species conservation including orchids (Swarts & Dixon 2017). Sample of the diversity of topics that have been explored includes the philosophical and ethical aspects (Chan et al. 2007, Evans 2021), genetic consequences of varying models of ex situ conservation of germplasms (Engels & Ebert 2021), the effective use of gene banks (Seaton 2007, Wei & Jiang 2021), the effectiveness of cryopreservation (Das et al. 2021, Kaur 2019, Swarts & Dixon 2009). What is particularly important is developing a better understanding of the complexity of effective strategies which would lead to successful reintroduction.
A common comment of orchid enthusiasts has been that plant species found in private, public gardens and plant growers' collections are sources of plants for ex situ conservation (Shirey et al. 2013). Multiple postulations are encompassed within this perspective. First, a common one is that because of deforestation and environmental impact by humans, at least some individuals of threatened species are conserved (Hinsley et al. 2018). Thus, an ex situ assemblages of plants of a species are a repository of genetic and morphological diversity. A second postulation that plant growers often express is that survivorship of plants in these controlled environments are higher than that in the natural habitat; thus, ex situ conservation is an effective strategy. Finally, a third postulation is that the number of individuals in a private or plant grower's environment can be increased much faster than in the natural environment. There is no doubt that many examples support each of these comments thus warranting in part being considered ''ex situ conservation''. For an introduction to guidelines to some of the variables which should be considered for ex situ conservation see Engels & Ebert (2021) and for quantitative approaches see Ferson & Burgman (2000).
Perusing the literature on effective protocols for ex situ conservation where the objective is to conserve the genetic and morphological variation of a species are multi-faceted and complex and require a multidisciplinary team and an a priori protocol for maximizing the diversity of genetic and morphological variation across populations of the species of interest (Abeli et al. 2019, Engels et al. 2021, Griffith et al. 2017, Li & Pritchard 2009, Phillips et al. 2020, Volis & Blecher 2010, Volis et al. 2009, and references within). It is clear from the present knowledge of the field that there are many possible drawbacks if a protocol fails to be comprehensive in capturing the species diversity (genetics and morphological) and maintaining it while in an ex situ collections (Curio 1996).
It is further assumed that the artificial environment or management practice while in ex situ, is not selecting for specific characteristics and if these were relocated to an adequate natural environment these plants would flourish. In other words, during the period of ex situ conservation it is assumed that there is no artificial selection (change in genetic or morphological diversity) that would make these individuals less apt for a successful reintroduction (Vitt & Havens 2004). When the process of ex situ conservation is applied scientifically, the collectors are likely to try to maximize the genetic diversity and morphological quantitative variation found in its natural environment that may ultimately be adaptive in the re-introduction phase (Fiani et al. 2021). For example, seed banks regeneration guidelines aim to minimize the effect of genotype selection (Phartyal et al. 2002) and the impact of inconsistencies in the protocol have been studied (Hay et al. 2021). However, during the ex situ conservation process, this is likely to be a non-random process (mainly if this occurs across multiple generations). Growers often select for more robust individuals assuming that these would have a higher fitness (for example, more flowers, longer life span, reduce mortality, resistance to pathogens, etc.). More ''robust'' plants in controlled environments (i.e. a greenhouse, botanical gardens) may not be adaptive in the natural environment. How common this process has not been quantified, and an attempt to identify peer-reviewed articles on ''artificial selection'' and ''orchids'' using Google Scholar has resulted in very few hits (Li et al. 2021) let alone evaluating if artificial selection while in ex situ collections is occurring and/or maladaptive for effective re-introduction. Su et al. (2018) showed change in morphological characters in lineages of Cymbidium sinense (Jacks. ex Andrews) Willd. which have been in cultivation for centuries and its correlation with transcriptome analysis of MADS genes. Character selection with economical use such as vanillin and other compounds in Vanilla Mill. cultivars have also been studied (Salazar-Rojas et al. 2012). Li et al. (2021) discussed technological advances and methods for more effective artificial selection in orchids and review the present knowledge of heritable characters in orchids. Although the gray literature (non-peer reviewed publications) is inundated with examples of selection for varying characters of species in cultivation (for examples see specialized Orchid popular journals ''Orchids Magazine'', ''Orchid Digest'', ''Orchid Review''), we do not have a wide and scientific perspective of the effect of cultivation on the frequency of artificial selection on one of the most charismatic plant family.
In an ex situ environment, plants are grown in a novel environment, which is likely to include parameters that are different from their in situ ''natural ecological'' niche, such as light conditions, humidity, diversity and intensity of fungal/mycorrhizal association, diversity and presence and intensity of pathogens. In ex situ collections, reproduction/fruit set is likely to be manipulated, and thus reproduction is not determined by floral quantitative characteristics through pollinator selection. In addition, seed germination is likely to be asymbiotic on a ''preferred growth medium''. Thus, while in an ex situ environment it is likely that artificial selection for varying morphological, eco-physiological and growth conditions is a subset of the total in situ niche diversity which could result in change or frequency in the genetics and morphology diversity of the characteristics through time. However, for ecologist and conservation biologist the challenge will always be understanding the diversity of habitat, which include the abiotic and biotic parameters in which a species may prosper, clearly a complex task. Even with the best attempts of ex situ conservation, it is likely that the condition will never replicate the natural environment 100%. Consequently, ex situ collection is likely to be made up of a subset of the ''most robust'' plants for an ''ex situ environmental niche''. These ''robust plants'' in ex situ environment maybe maladapted for an in situ conservation program.
Since Darwin (1877), the study of the close relationship between the fit of specific pollinators and floral characteristics for successful fruit set or pollinaria removal has been of interest to evolutionary biologists. Most orchids have few pollinators (Ackerman et al. 2022, Tremblay 1992) and if they have multiple pollinators often these are from limited functional groups (J. D. Ackerman, pers. comm.). The size of flowers can influence reproductive success in plants in general and in orchids (Charpulat et al. 2020, de Jager & Peakall 2019, Juillet & Scopece 2010, Palacio et al. 2019, Scopece et al. 2017, Trunschke 2018). For example, Tremblay (2006) showed that in the diminutive orchid Lepanthes rupestris Stimson the size of column and floral characteristics influences pollinaria removal (positive selection coefficients) and fruit set (negative selection coefficient). Cintrón-Berdecía & Tremblay (2006) evaluated variation in selection across seven L. rupestris populations in the same period and showed that directional, stabilizing, and disruptive selection varied among characters and populations. Moreover, selection gradients can also vary across reproductive periods as shown in other orchids (example: Scopece et al. 2017). There are examples in orchids that show that morphological quantitative characters may influence reproductive success and ultimately, evolutionary processes (phenotypic selection; Tremblay & Ackerman 2001) and consequently size of morphological characters does matter. Thus, plants that are to be re-introduced to their in situ environment as a conservation approach, their functional morphological traits (assuming pollinator mediated pollination) must match the pollinator characteristics if conservation is to be successful.
Here we explore the morphological variation across time of species in the Orchidaceae that have been cultivated by enthusiasts and evaluate if they show changes in the size of the floral characteristics. If no artificial selection is present, then morphological characteristics should not show any increasing or decreasing trend in time. In addition, for a subset of species in our selected dataset we compared the morphological characteristics of plants in cultivation with those described from natural populations using the species descriptions. We ask two fundamental questions: do orchids show evidence of artificial selection while in ex situ cultivation and is the morphological variation (range) of the floral characters of ex situ plants within the range of the morphology observed in the natural environment?
Materials and methods
Database.-
The morphological floral characters were garnered from the American Orchid Society (AOS) database OrchidPro ''https://op.aos.org'' which is a repository of all species and hybrids that have been recognized for their ''special'' qualities by the AOS. We excluded all award types where the focus is not on plant ''quality''. The awards included were: HCC (Highly Commended Certificate), AM (Award of Merit), FCC (First Class Certificate), JC (Judge's Commendation), CBR (Certificate of Botanical Recognition), CCM (Certificate of Cultural Merit) and CCE (Certificate of Cultural Excellence). No hybrids were included in the analyses. For each species, the morphological size of the following characters were included: dorsal sepal length (DSL), dorsal sepal width (DSW), petal length (PL), petal width (PW), lateral sepal length (LSL), lip length (LL) and number of flowers (NumF). These characters were graphically visualized, and statistical tests to determine if there were significant changes across times were performed. Species with subspecies or varieties are considered as part of the normal variation of the species. The minimal sample size was 11 and ranged up to 247 plants (Table 1). Prior to all analysis, visualization of the data was performed to detect possible outliers or likely errors in the dataset and these data points were excluded. For example, a data point in the database for the sepal width of Brassavola nodosa (L.) Lindl. was over 7 cm wide; clearly an error in data entry, as the natural range of width of the sepals is from 2-5mm (Ackerman 2014). Another common unrealistic information that appeared in the database is that characters had zero (0) for the size of a character, when these should be either left blank, or an NA should be added. Sample size varied among species and within species because of missing or excluded data for specific characters. To evaluate the above hypotheses, we selected species of the following genera (Aerangis Rchb.f., Angraecum Bory, Brassavola Lindl., Brassia R.Br., Cattleya Lindl., Dendrobium Sw., Laelia Lindl., Paphiopedilum Pfitzer, Phalaenopsis Blume: Table 1). The species selected were those which had the highest number of awards in those genera, however we did add a few species with small sample size to evaluate if patterns were detectable. Although many species are present in the database only a small subset of species are found frequently across many years.
Table 1 List of species evaluated. The first and last year of the data included in the analyses from the AOS database and the reference used to evaluate the native/natural morphological characteristics. Reference for in situ refers to the species description for comparison with ex situ plants (Table 8). NA= No data from wild type.
| Genera | Specific epithet | First year | Last year | Sample size | Reference for in situ |
|---|---|---|---|---|---|
| Aerangis | articulata (Rchb.f.) Schltr. | 1971 | 2014 | 13 | NA |
| Aerangis | biloba (Lindl.) Schltr. | 1969 | 2017 | 15 | NA |
| Aerangis | citrata (Thouars) Schltr. | 1965 | 2018 | 15 | NA |
| Aerangis | hariotiana (Kraenzl.) P.J.Cribb & Carlsward | 1975 | 2014 | 11 | NA |
| Aerangis | luteoalba (Kraenzl.) Schltr. | 1965 | 2020 | 37 | NA |
| Angraecum | distichum Lindl. | 1965 | 2018 | 18 | NA |
| Angraecum | eburneum Bory | 1965 | 2018 | 28 | NA |
| Angraecum | leonis (Rchb.f.) André | 1965 | 2018 | 20 | Notahianjanahary 2016 |
| Angraecum | magdalenae Schltr. & H.Perrier | 1972 | 2016 | 12 | NA |
| Angraecum | sesquipedale Thouars | 1972 | 2021 | 44 | NA |
| Angraecum | viguieri Schltr. | 1976 | 2019 | 20 | NA |
| Brassavola | nodosa (L.) Lindl. | 1965 | 2020 | 62 | Ackerman 2014 |
| Brassia | gireoudiana Rchb.f. & Warsz. | 1977 | 2018 | 27 | NA |
| Brassia | verrucosa Lindl. | 1977 | 2015 | 24 | NA |
| Cattleya | aclandiae Lindl. | 1965 | 2019 | 64 | van den Berg 2020 |
| Cattleya | amethystoglossa Linden & Rchb.f. ex Warner | 1965 | 2020 | 79 | van den Berg 2020 |
| Cattleya | aurantiaca (Bateman) P.N.Don | 1965 | 2020 | 50 | Salazar 1990 |
| Cattleya | bicolor Lindl. | 1965 | 2019 | 30 | van den Berg 2020 |
| Cattleya | brevipedunculata (Cogn.) Van den Berg | 1981 | 2020 | 21 | NA |
| Cattleya | cernua Beer | 1965 | 2019 | 55 | Buzatto 2010 |
| Cattleya | coccinea Lindl. | 1965 | 2020 | 126 | Buzatto 2010 |
| Cattleya | dormaniana Rchb.f. | 1977 | 2020 | 25 | NA |
| Cattleya | dowiana Bateman | 1988 | 2019 | 39 | Pupulin 2015 |
| Cattleya | forbesii Lindl. | 1965 | 2018 | 23 | NA |
| Cattleya | granulosa Lindl. | 1965 | 2019 | 37 | van den Berg 2020 |
| Cattleya | harpophylla (Rchb.f.) Van den Berg | 1965 | 2018 | 19 | NA |
| Cattleya | harrisoniana Bateman ex Lind. | 1965 | 2018 | 28 | van den Berg 2020 |
| Cattleya | intermedia Graham | 1977 | 2019 | 72 | NA |
| Cattleya | jongheana (Rchb.f.) Van den Berg | 1978 | 2019 | 48 | NA |
| Cattleya | labiata Lindl. | 1952 | 2018 | 29 | NA |
| Dendrobium | cuthbertsonii F.Muell. | 1984 | 2020 | 117 | NA |
| Dendrobium | farmeri Paxton | 1965 | 2021 | 46 | NA |
| Dendrobium | lindleyi Steud. | 1965 | 2021 | 73 | NA |
| Laelia | anceps Lindl. | 1974 | 2020 | 144 | Jiménez et al. 1997 |
| Paphiopedilum | armeniacum S.C.Chen & F.Y.Liu | 1983 | 2019 | 152 | NA |
| Paphiopedilum | bellatulum (Rchb.f.) Stein. | 1965 | 2019 | 220 | Cribb 1987 |
| Paphiopedilum | charlesworthii (Rolfe) Pfizer | 1977 | 2019 | 62 | Cribb 1987 |
| Paphiopedilum | concolor (Bateman) Pfitzer | 1965 | 2016 | 60 | Cribb 1987 |
| Paphiopedilum | delenatii Guillaumin | 1965 | 2019 | 129 | NA |
| Paphiopedilum | fairieanum (Lindl.) Stein | 1973 | 2019 | 110 | NA |
| Paphiopedilum | godefroyae Stein | 1973 | 2019 | 89 | NA |
| Paphiopedilum | hirsutissimum (Lindl. ex Hook) Stein | 1975 | 2002 | 56 | NA |
| Paphiopedilum | lowii (Lindl.) Stein | 1975 | 2014 | 141 | Cribb 1987 |
| Paphiopedilum | macranthum Z.J.Lui & S.C.Chen | 1985 | 2018 | 247 | Cribb 1987 |
| Paphiopedilum | malipoense S.C.Chen & Z.H.Tsi | 1986 | 2019 | 108 | Cribb 1987 |
| Paphiopedilum | niveum (Rchb.f.) Stein | 1970 | 2019 | 99 | Cribb 1987 |
| Paphiopedilum | philippinense (Rchb.f.) Stein | 1973 | 2019 | 81 | Cribb 1987 |
| Paphiopedilum | rothschildianum (Rchb.f.) Stein | 1965 | 2019 | 233 | NA |
| Paphiopedilum | sukhakulii Schoser & Senghas | 1965 | 2019 | 208 | NA |
| Paphiopedilum | venustum (Wall. ex Sims) Pfitzer | 1982 | 2020 | 46 | NA |
| Paphiopedilum | wardii Summerh. | 1972 | 2016 | 103 | NA |
| Phalaenopsis | amboinensis J.J.Sm. | 1969 | 2020 | 84 | NA |
| Phalaenopsis | bellina (Rchb.f.) Christenson | 1969 | 2021 | 148 | NA |
| Phalaenopsis | cornu-cervi (Hasselt ex Hassk) Blume & Rchb.f. | 1972 | 2021 | 100 | Sweet 1980 |
| Phalaenopsis | equestris (Schauer) Rchb.f. | 1971 | 2019 | 104 | Sweet 1980 |
| Phalaenopsis | lueddemanniana Rchb.f. | 1970 | 2016 | 51 | Sweet 1980 |
| Phalaenopsis | pulcherrima (Lindl) J.J.Sm. | 1984 | 2021 | 128 | NA |
| Phalaenopsis | violacea hort. ex H.Witte | 1969 | 2021 | 131 | Sweet 1980 |
Statistical analysis.-
Quantitative characters that were expected to be normally distributed (such as DSL, DSW, PW, PL, LSL, LL, NumF) were evaluated using a linear model (Field et al. 2012), while characters that were counts (NumF) were evaluated using a generalized linear model with a negative binomial or log-normal distribution (Kabacoff 2015). Artificial selection for characters was determined by observing if there was either a positive or negative selection for characters across time (Endler 1986). The negative binomial regression is a generalization of the Poisson regression which is less restrictive and does not assume that the mean and variance are equal (Hilbe 2011), while the log-normal regression is a regression with a log-normal distribution where the ''y'' values are non-negative (Crow & Shimizu 1987). The choice of using the negative binomial or the log normal was made using Akaike Information Criterion (AIC), the model with the smallest AIC was chosen (Cavanaugh & Neath 2019). Assumptions of the models were evaluated for all analysis.
To determine if specific morphological characters across species were more likely to be influenced by artificial selection, we summarized the frequency of species which had significant coefficients (either positive, negative or no selection) and evaluated if the frequencies are similar among morphological characters using a Fisher's Exact Test with Monte Carlo simulations (Kassambara 2021).
A comparison of the dispersion (range) in morphological characters between ex situ and in situ plants was done visually noting the range of morphological characters from the description of the species (see Table 1 for the references for species in situ characters) compared to the observed size of plants in the database. If all morphological characters were within the in situ range, we coded as ''W'' = within, if plants grown in ex situ collections were above the normal range we coded as ''+O'' (+ outside) and below the normal range as ''-O'' (outside), and if both outside ranges were noted these were scored as ''±O''. Only a subset of the species in Table 1 were evaluated. This is because the available ''species description'' were often scarce for many species and the information was limited or did not include all characters evaluated in the previous section. In addition, if sample size were small for an ex situ species these characters were excluded.
All analyses were performed with R (v. 4.1.2) using RStudio (v. 2021.09.0, RStudio Team 2020) and the following packages: ggplot2 (Wickham 2016), lubridate (Grolemund & Wickham 2011), janitor (Firke 2021), stringr (Wickham 2019), and dplyr (Wickham et al. 2022), gmodel (Warnes et al. 2018), rstatix (Kassambara 2021) for data wrangling and statistics, and huxtables (Hugh-Jones 2021) to create the tables.
Results
Do we observe changes in floral morphology in time?-
We evaluated seven morphological characters from 54 species from 9 genera (Table 2-7). Some characters showed significant differences in size across time suggesting that species may be selected artificially for being either larger, such as the DSW in Phalaenopsis pulcherrima (Lindl.) J.J.Sm. (Table 7, Fig. 1B) and the lip length in Angraecum sesquipedale Thouars (Table 3, Fig. 1E). While other species showed patterns of being smaller as in the PL in Phalaenopsis violacea hort. ex Witte (Table 7, Fig. 1A), and Brassia verrucosa Lindl. (Table 4, Fig. 1C), and the NumF in Cattleya granulosa Lindl. (Table 5, Fig. 1F). While many characters showed no significant change such as the LL in Dendrobium cuthbertsonii F.Muell. (Table 4, Fig. 1D).
In total, we evaluated 381 characters, and the proportion of characters that showed significant trends either positive or negative varied among genera (Table 8). As a general trend, characters were more likely to show a positive coefficient (27% across all species) as compared to a negative coefficient (8% across all species) suggesting that morphological change, if significant, were more likely to be larger than when first surveyed. Of the 54 species surveyed only ten species showed no significant change in any of the characters.
Thus, 81% of the species had at least one character that showed a significantly negative or positive trend. Two species had all the evaluated characters with significant trends: Paphiopedilum malipoense S.C.Chen & Z.H.Tsi and Phalaenopsis pulcherrima(Lindl.) J.J.Sm. (Table 6-7). The only species where selection for smaller size was noted for two or more characters were in Brassia verrucosa (Table 4), Cattleya labiata Lindl. (Table 5), Phalaenopsis lueddemanniana Rchb.f. and Phalaenopsis violacea (Table 7).
Table 2 Aerangis: Linear coefficients (slope (beta) and standard deviation, SD) of the morphological and floral characteristics across time. NA = not evaluated. The characters included are: dorsal sepal length (DSL), dorsal sepal width (DSW), petal length (PL), petal width (PW), lateral sepal length (LSL), lip length (LL), and number of flowers (NumF). The negative binomial regression (aNB) or Log Normal (bLN) regression were used because the number of flowers has a distribution which is often overdispersed (Cameron & Triverdi 1998) with most plants having few flowers and a few having large number of flowers; significant levels p<0.05, * p<0.01 and ** p<0.001. Values in bold blue are significant negative coefficients; values in bold black are significant positive coefficients, values in regular are nonsignificant coefficients.
| Species | DSL | DSW | PL | PW | LSL | LL | NumF |
|---|---|---|---|---|---|---|---|
| A. articulata | 0.008 (0.018) | 0.002 (0.002) | 0.010 (0.014) | 0.003 (0.005) | -0.009 (0.007) | 0.011 (0.014) | 0.022a (0.009)* |
| A. biloba | 0.028 (0.016) | 0.010 (0.005) | 0.025 (0.014) | 0.009 (0.004) | 0.011 (0.004)* | 0.020 (0.020) | 0.026a (0.011)* |
| A. citrata | 0.012 (0.006)* | 0.008 (0.007) | 0.010 (0.005) | 0.008 (0.003)* | 0.003 (0.006) | 0.008 (0.005) | -0.008a (0.014) |
| A. hariotiana | 0.002 (0.003) | < 0.001 (0.002) | 0.002 (0.002) | < 0.001 (0.002) | 0.001 (0.002) | < 0.001 (0.003) | NA |
| A. luteoalba | 0.020 (0.005) | 0.001 (0.003)** | 0.018 (0.006)** | 0.013 (0.004) | 0.009 (0.003)** | 0.020 (0.008)* | 0.004a (0.010) |
Table 3 Angreacum: Linear coefficients (beta and standard deviation, SD) of the morphological and floral characteristics across time. NA= not evaluated. The characters included are dorsal sepal length (DSL), dorsal sepal width (DSW), petal length (PL), petal width (PW), lateral sepal length (LSL), lip length (LL), number of flowers (NumF). See Table 2 legend for statistical details.
| Species | DSL | DSW | PL | PW | LSL | LL | NumF |
|---|---|---|---|---|---|---|---|
| A. distichum | -0.003 (0.002) | -0.001 (0.001) | -0.004 (0.002) | -0.001 (0.002) | 0.002 (0.002) | -0.003 (0.002) | 0.002a (0.025) |
| A. eburneum | -0.005 (0.009) | -0.003 (0.004) | 0.123 (0.161) | -0.016 (0.011) | -0.005 (0.004) | -0.006 (0.011) | 0.010a (0.020) |
| A. leonis | 0.005 (0.015) | 0.003 (0.003) | 0.003 (0.014) | 0.004 (0.004) | -0.013 (0.014) | 0.056 (0.038) | < -0.0001a (0.013) |
| A. magdalenae | 0.010 (0.028) | -0.011 (0.012) | -0.009 (0.017) | -0.005 (0.008) | -0.004 (0.007) | 0.009 (0.019) | 0.065 (0.008) |
| A. sesquipedale | -0.022 (0.013) | 0.013 (0.006)* | -0.011 (0.012) | 0.018 (0.006)** | 0.013 (0.005)* | 0.061 (0.062) | -0.017a (0.010) |
| A. viguieri | -0.006 (0.011) | 0.003 (0.003) | 0.014 (0.008) | -0.002 (0.002) | 0.002 (0.002) | 0.022 (0.033) | 0.035 (0.010) |
Table 4 Brassavola (Bv.), Brassia, Dendrobium and Laelia: Linear coefficients (beta and standard deviation, SD) of the morphological and floral characteristics across time. NA= not evaluated. The characters included are dorsal sepal length (DSL), dorsal sepal width (DSW), petal length (PL), petal width (PW), lateral sepal length (LSL), lip length (LL), number of flowers (NumF). See Table 2 legend for statistical details.
| Species | DSL | DSW | PL | PW | LSL | LL | NumF |
|---|---|---|---|---|---|---|---|
| Bv. nodosa | 0.03 (0.16) | 0.004 (0.002)* | 0.011 (0.013) | 0.002 (0.001)* | 0.012 (0.015) | 0.002 (0.013) | -0.08a (0.18) |
| B. gireoudiana | -0.066 (0.036) | -0.001 (0.002) | 0.022 (0.032) | 0.001 (0.001) | -0.100 (0.053) | -0.006 (0.013) | 0.32a (0.15)* |
| B. verrucosa | -0.20 (0.06)* | -0.005 (0.003) | -0.29 (0.097)* | -0.006 (0.003) | -0.17 (0.07)* | -0.076 (0.021)** | 0.11 (0.20) |
| D. cuthbertsonii | 0.004 (0.004) | 0.003 (0.003) | -0.005 (0.004) | < 0.001 (0.003) | 0.006 (0.004) | -0.035 ( 0.021) | -0.016a (0.013) |
| D. farmeri | -0.009 (0.006) | -0.002 (0.004) | -0.01 (0.005) | 0.008 (0.003)* | -0.002 (0.004) | -0.006 (0.004) | 0.005a (0.008) |
| D. lindleyi | < -0.001 (0.004) | -0.003 (0.003) | < -0.001 (0.003) | 0.002 (0.003) | 0.003 (0.003) | < 0.001 (0.004) | 0.010a (0.013) |
| L. anceps | -0.004 (0.007) | 0.008 (0.003)* | -0.005 (0.006) | 0.015 (0.006)* | NA | 0.005 (0.006) | 0.029 (0.009)** |
Table 5 Cattleya: Linear coefficients (beta and standard deviation, SD) of the morphological and floral characteristics across time. NA= not evaluated. The characters included are dorsal sepal length (DSL), dorsal sepal width (DSW), petal length (PL), petal width (PW), lateral sepal length (LSL), lip length (LL), number of flowers (NumF). See Table 2 legend for statistical details.
| Species | DSL | DSW | PL | PW | LSL | LL | NumF |
|---|---|---|---|---|---|---|---|
| C. aclandiae | -0.003 (0.006) | 0.01 (0.003)** | -0.006 (0.005) | 0.006 (0.003) | -0.008 (0.006) | 0.0005 (0.006) | 0.012 (0.007) NB |
| C. amethystoglossa | 0.009 (0.007) | 0.007 (0.004) | 0.01 (0.007)* | 0.02 (0.006)** | 0.009 (0.005) | 0.005 (0.005) | 0.0005 (0.005)** NB |
| C. aurantiaca | -0.01 (0.007) | 0.009 (0.002) | -0.01 (0.007) | 0.005 (0.003) | 0.003 (0.007) | 0.0002 (0.006) | -0.017 (0.01)** NB |
| C. bicolor | 0.005 (0.01) | -0.0006 (0.003) | 0.004 (0.009) | 0.002 (0.008) | 0.002 (0.01) | 0.004 (0.006) | -0.007 (0.007)** NB |
| C. brevipedunculata | 0.03 (0.01)** | 0.01 (0.007) | 0.04 (0.009) | 0.02 (0.01) | 0.02 (0.01) | 0.02 (0.007)* | 0.03 (0.02) NB |
| C. cernua | 0.008 (0.003)* | 0.005 (0.002)** | 0.004 (0.003) | 0.002 (0.003) | 0.007 (0.003 )* | -0.0002 (0.002) | -0.0002 (0.007)** NB |
| C. coccinea | 0.003 (0.003) | 0.008 (0.002) | 0.001 (0.003) | 0.02 (0.004) | 0.002 (0.003) | -0.001 (0.002) | 0.008 (0.008)* NB |
| C. dormaniana | 0.02 (0.008) | 0.001 (0.002) | 0.01 (0.007) | 0.002 (0.003) | 0.009 (0.01) | 0.008 (0.006) | 0.07 (0.02) NB |
| C. dowiana | 0.05 (0.02)** | 0.01 (0.006) | 0.01 (0.02) | 0.02 (0.01) | 0.008 (0.01) | 0.009 (0.02) | -0.015 (0.012)** NB |
| C. forbesii | 0.002 (0.01) | 0.004 (0.006) | -0.002 (0.01) | 0.006 (0.007) | 0.004 (0.01) | 0.007 (0.02) | 0.04 (0.02) NB |
| C. granulosa | -0.01 (0.01) | 0.003 (0.003) | -0.004 (0.008) | -0.0002 (0.004) | -0.004 (0.009) | 0.009 (0.009) | -0.02 (0.006)** NB |
| C. harpophylla | 0.002 (0.01) | -0.002 (0.003) | 0.005 (0.01) | 0.001 (0.002) | -0.01 (0.01) | 0.02 (0.009)* | 0.02 (0.01) NB |
| C. harrisoniana | 0.005 (0.009) | 0.007 (0.004) | 0.001 (0.01) | 0.02 (0.01) | 0.007 (0.01) | 0.01 (0.008) | 0.004 (0.009) **NB |
| C. intermedia | -0.004 (0.01) | 0.01 (0.004)* | -0.003 (0.01) | 0.02 (0.009)** | 0.02 (0.01) | -0.004 (0.008) | -0.0004 (0.02)** NB |
| C. jongheana | 0.01 (0.01) | 0.006 (0.002)** | 0.01 (0.008) | 0.02 (0.007)* | 0.01 (0.009) | 0.01 (0.007) | 0.01 (0.01) NB |
| C. labiata | -0.04 (0.02)* | -0.02 (0.008)* | -0.04 (0.01)** | -0.04 (0.02)** | -0.05 (0.03)* | -0.03 (0.02) | 0.007 (0.02)* NB |
Table 6 Paphiopedilum: Linear coefficients (beta and standard deviation, SD) of the morphological and floral characteristics across time. NA= not evaluated. The characters included are dorsal sepal length (DSL), dorsal sepal width (DSW), petal length (PL), petal width (PW), lateral sepal length (LSL), lip length (LL), number of flowers (NumF). See Table 2 legend for statistical details.
| Species | DSL | DSW | PL | PW | LSL | LL | NumF |
|---|---|---|---|---|---|---|---|
| P. armeniacum | 0.027 (0.006) | 0.019 (0.005) | 0.023 (0.005) | 0.023 (0.006) | NA | 0.005 (0.013) | 0.004a (0.009) |
| P. bellatulum | 0.019 (0.003) | 0.019 (0.002) | 0.019 (0.003) | 0.017 (0.002) | NA | 0.026 (0.016) | -0.007b (0.003)* |
| P. charlesworthii | -0.016 (0.007)* | -0.003 (0.010) | 0.005 (0.006) | 0.012 (0.005)* | NA | NA | -0.004a (0.009) |
| P. concolor | -0.004 (0.005) | 0.016 (0.005) | 0.003 (0.005) | 0.006 (0.004) | NA | NA | -0.318a (0.010)** |
| P. delenatii | 0.016 (0.003) | 0.020 (0.003) | 0.019 (0.003) | 0.027 (0.004) | NA | NA | < -0.001a (0.007) |
| P. fairieanum | 0.007 (0.004) | 0.019 (0.005) | <-0.001 (0.006) | 0.006 (0.004) | NA | 0.011 (0.015) | -0.045a (0.007) |
| P. godefroyae | 0.016 (0.004) | 0.025 (0.004) | 0.004 (0.004) | 0.013 (0.005)** | NA | NA | 0.001b (0.003) |
| P. hirsutissimum | 0.003 (0.012) | -0.009 (0.009) | 0.015 (0.015) | -0.003 (0.011) | NA | NA | 0.015a (0.019) |
| P. lowii | 0.046 (0.041) | 0.022 (0.005) | 0.028 (0.013)* | 0.017 (0.010) | NA | 0.038 (0.005) | -0.012a (0.007)** |
| P. macranthum | 0.013 (0.003) | 0.005 (0.015) | 0.012 (0.003) | 0.015 (0.004) | NA | 0.023 (0.021) | 0.017a (0.007)* |
| P. malipoense | 0.020 (0.10)* | 0.018 (0.007)* | 0.023 (0.010)** | 0.025 (0.008)** | NA | 0.077 (0.028)* | 0.027a (0.010)** |
| P. niveum | 0.012 (0.003)** | 0.021 (0.004) | 0.015 (0.004)** | 0.015 (0.003) | NA | 0.018 (0.015) | -0.005a (0.007) |
| P. philippinense | 0.021 (0.012) | 0.006 (0.004) | 0.025 (0.035) | 0.012 (0.012) | NA | -0.028 (0.017) | -0.010a (0.005) |
| P. rothschildianum | 0.011 (0.006) | 0.037 (0.004) | 0.049 (0.015)** | 0.003 (0.012) | NA | 0.003 (0.011) | 0.002a (0.003) |
| P. sukhakulii | 0.015 (0.003) | 0.009 (0.002) | -0.004 (0.008) | 0.008 (0.005) | NA | 0.005 (0.012) | -0.012a (0.005) NB |
| P. venustum | -0.003 (0.007) | 0.013 (0.006)* | -0.003 (0.007) | 0.008 (0.005) | NA | NA | -0.003a (0.017)* |
| P. wardii | 0.001 (0.006) | 0.019 (0.004) | 0.016 (0.009) | 0.006 (0.008) | NA | 0.006 (0.028) | 0.002 (0.010) |
Table 7 Phalaenopsis: Linear coefficients (beta and standard deviation, SD) of the morphological and floral characteristics across time. NA= Not evaluated. The characters included are dorsal sepal length (DSL), dorsal sepal width (DSW), petal length (PL), petal width (PW), lateral sepal length (LSL), lip length (LL), number of flowers (NumF). See Table 2 legend for statistical details.
| Species | DSL | DSW | PL | PW | LSL | LL | NumF |
|---|---|---|---|---|---|---|---|
| P. amboinensis | 0.004 (0.003) | 0.007 (0.002)** | 0.004 (0.002)* | 0.002 (0.002) | 0.004 (0.003) | 0.002 (0.003) | -0.009a (0.009)* |
| P. bellina | -0.003 (0.003) | 0.009 (0.001) | -0.0005 (0.002) | 0.008 (0.002) | 0.002 (0.003) | 0.004 (0.002) | -0.022a (0.004) |
| P. cornu-cervi | -0.004 (0.004) | 0.003 (0.002) | -0.003 (0.003) | -0.002 (0.002) | -0.002 (0.004) | < -0.001 (0.003) | -0.020a (0.010) |
| P. equestris | 0.0008 (0.003) | -0.0004 (0.002) | 0.0005 (0.005) | -0.002 (0.003) | -0.0005 (0.003) | -0.004 (0.003) | 0.018a (0.009)* |
| P. lueddemanniana | -0.005 (0.004) | 0.003 (0.002) | -0,008 (0.003)* | 0.007 (0.003)* | -0.008 (0.004)* | -0.002 (0.002) | -0.008a (0.010) |
| P. pulcherrima | 0.008 (0.003)* | 0.011 (0.002) | 0.011 (0.003) | 0.027 (0.005) | 0.011 (0.003)** | 0.011 (0.004)** | 0.022a (0.007)** |
| P. violacea | -0.009 (0.002) | 0.0008 (0.001) | -0.012 (0.002) | 0.0004 (0.0017) | 0.011 (0.06) | -0.004 (0.003) | -0.017a (0.006)** |
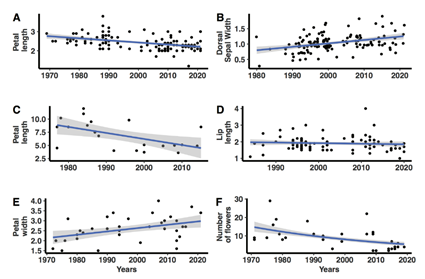
A. Variation in petal length in Phalaenopsis violacea, significant negative linear slope.
B. Dorsal sepal width variation in Phalaenopsis pulcherrima, significant positive linear slope.
C. Petal length variation in Brassia verrucosa, significant negative linear slope.
D. Lip length in Dendrobium cuthbertsonii, slope not significant.
E. Petal width variation in Angraecum sesquipedale, significant positive slope.
F. Number of flower variation in Cattleya granulosa, significant negative binomial slope.
Figure 1 Examples of typical trends in morphological variation in time. Each analysis in Table 2 was evaluated visually to identify outliers (which were excluded) prior to statistical analysis. The blue line represents the ''best'' slope of the model and the shaded area represents the 95% confidence interval of the slope.
Artificial selection by type of morphological character.-
Across all species some characters were more likely to be selected (Table 8). The DSW, PW and the NumF had the highest frequency of positive coefficients (45%, 36% and 35% respectively). There is little evidence of positive or negative selection on LL (10% and 2% respectively) as 88% of species evaluated did not show any evidence of selection on this character. Most species did not show consistent evidence of artificial selection on some of the morphological characters such as DSL, PL and LSL (69%, 72% and 80% respectively). Approximately 35% of the species showed a positive trend in the NumF and 26% a negative trend (Table 8). The proportion of variables that are significantly different (positive or negative) to those which did not, is not a random distribution across variables. The frequency of LL and NumF often showed significant differences (Fisher's Exact test with simulation, p< 0.01). Most pairwise comparisons of the variables show that the proportion of species were not significant. However, the frequency of species that were significant as for LL was significantly different from DSL, PL and NumF (pairwise Fisher comparison test, all p's < 0.0001). The main character which did not follow the same trend in the number of species that show selection coefficient is the LL (rowwise paired Fisher comparison test, p < 0.0001).
Table 8 Summary of the proportion of species where characters were significantly different (p< 0.05) across time (column wise proportions). The selection coefficients are in Table 2a-f. Values in brackets are the number of species. The characters included are dorsal sepal length (DSL), dorsal sepal width (DSW), petal length (PL), petal width (PW), lateral sepal length (LSL), lip length (LL), number of flowers (NumF). Note sample size (number of species) varies among characters.
| Species | DSL | DSW | PL | PW | LSL | LL | NumF |
|---|---|---|---|---|---|---|---|
| Positive effect | 0.24 (14) | 0.45 (26) | 0.21 (12) | 0.36 (21) | 0.12 (5) | 0.10 (5) | 0.35 (20) |
| Negative effect | 0.07 (4) | 0.02 (1) | 0.07 (4) | 0.02 (1) | 0.08 (3) | 0.02 (1) | 0.26 (15) |
| No significant selection | 0.69 (40) | 0.53 (31) | 0.72 (42) | 0.62 (36) | 0.80 (32) | 0.88 (46) | 0.39 (22) |
Is artificial selection consistent among genera?-
Variation in size across time was different among genera (Table 9). Considering the species with the greatest number of characters evaluated (Aerangis, Angraecum, Cattleya, Dendrobium, Paphiopedilum, and Phalaenopsis) the frequency of the number of variables was not equal among genera (p < 0.0001, Fisher's Exact Test). The genera which diverged the most were Angraecum (p = 0.01), Cattleya (p = 0.04) and Paphiopedilum (p < 0.0001; Fisher's rowwise test). Of the genera where more than one species was evaluated, Aerangis (32%) and Paphiopedilum (54%) had more characters that showed change in time, while Angraecum (12%) and Dendrobium (14%) showed fewer characters under artificial selection (Table 9). Considering both negative and positive selection coefficients, the genera which have the least amount of evidence for artificial selection are Angreacum (88%) and Dendrobium (86%). The genus with the most frequent evidence of negative selection is Brassia. However, only 2 species were evaluated, and all negative coefficients were detected in a single species, Brassia verrucosa (Table 4).
Table 9 Summary of proportion of characters by genera which show significant change in time (rowwise). Positive= Proportion of characters with significant positive change in time. Negative= Proportion of characters with significant negative change in time. No selection= Proportion of characters with no significant change (see Table 2-7).
| Genus (number of species) | Number of characters evaluated | Positive | Negative | No selection |
|---|---|---|---|---|
| Aerangis (5) | 33 | 0.30 | 0 | 0.70 |
| Angraecum (6) | 42 | 0.12 | 0 | 0.88 |
| Brassavola (1) | 7 | 0.29 | 0 | 0.71 |
| Brassia (2) | 14 | 0.14 | 0.29 | 0.57 |
| Cattleya (16) | 112 | 0.24 | 0.10 | 0.66 |
| Dendrobium (3) | 21 | 0.05 | 0 | 0.95 |
| Laelia (1) | 6 | 0.5 | 0 | 0.5 |
| Paphiopedilum (17) | 96 | 0.41 | 0.07 | 0.52 |
| Phalaenopsis (7) | 49 | 0.27 | 0.14 | 0.59 |
Comparing morphological variation of species description (in situ) and ex situ species.-
Plant size range from the ex situ grown species are frequently different from plant size of species morphological character noted in the literature. We evaluated 125 characters in 23 species of four genera (Aerangis, Brassavola, Paphiopedilum, Phalaenopsis). Plants incultivation mostly had characters that were larger than the species description (Table 10, Fig. 2). Some character observed from the ex situ collections were within the range of the species description (PL in Brassavola nodosaFig. 2A), while many species had characters above the in situ range, such as NumF in Cattleya granulosa (Fig. 2B), DSW in C. granulosa (Fig. 2C), DSL in C. granulosa (Fig. 2D) and C. aclandiae Lindl. (Fig. 2E), and PW as in Paphiopedilum macranthum Z.J.Liu & S.C.Chen (Fig. 2H). While other characters were below the normal in situ range such as the LSL in Phalaenopsis violacea (Fig. 2F). Some morphological characters when grown ex situ the variation was below and above the in situ range as in Paphiopedilum malipoense (Fig. 2G).
Table 10 Comparison of morphological characteristics of morphology from plants in their natural environment (in situ) vs. ex situ plants. The morphological characters of plants in the database are considered either W= within the natural morphological range, O= outside the natural morphological range with ''+'' values larger than reported in nature and ''-'' values smaller than reported in nature, ''--'' for species where the character was not evaluated. The morphological range was collected from species description (see Table 1 for references). The characters included are dorsal sepal length (DSL), dorsal sepal width (DSW), petal length (PL), petal width (PW), lateral sepal length (LSL), lip length (LL), number of flowers (NumF).
| Species | DSL | DSW | PL | PW | LSL | LL | NumF |
|---|---|---|---|---|---|---|---|
| Angreacum leonis | -- | -- | -- | -- | -- | -- | +O |
| Brassavola nodosa | +O | +O | W | +O | +O | +O | +O |
| Cattleya aclandiae | +O | +O | +O | +O | +O | +O | +O |
| Cattleya amethystoglossa | +O | +O | +O | +O | +O | +O | +O |
| Cattleya aurantiaca | +O | +O | ±O | +O | +O | ±O | +O |
| Cattleya bicolor | ±O | +O | ±O | +O | +O | ±O | +O |
| Cattleya cernua | +O | +O | +O | +O | -- | -- | +O |
| Cattleya coccinea | +O | +O | +O | +O | +O | -- | +O |
| Cattleya dowiana | -- | -- | ±O | +O | -- | +O | +O |
| Cattleya granulosa | ±O | +O | ±O | +O | ±O | ±O | +O |
| Cattleya harrisoniana | -- | -- | ±O | +O | -- | ±O | +O |
| Paphiopedilum bellatulum | +O | +O | +O | +O | -- | W | +O |
| Paphiopedilum charlesworthii | ±O | +O | ±O | +O | -- | -- | +O |
| Paphiopedilum concolor | +O | +O | +O | +O | -- | -- | +O |
| Paphiopedilum lowii | +O | +O | +O | W | -- | -- | +O |
| Paphiopedilum macranthum | W | +O | +O | +O | -- | ±O | +O |
| Paphiopedilum malipoensis | +O | +O | +O | ±O | -- | W | +O |
| Paphiopedilum niveum | +O | +O | +O | +O | -- | -- | +O |
| Paphiopedilum philippinense | +O | +O | +O | -- | -- | -- | ±O |
| Phalaenopsis cornu-cervi | ±O | ±O | +O | ±O | ±O | -- | -- |
| Phalaenopsis equestris | +O | +O | +O | +O | ±O | +O | -- |
| Phalaenopsis lueddemanniana | +O | +O | -- | -- | +O | ±O | -- |
| Phalaenopsis violacea | +O | +O | ±O | +O | -O | -O | -- |
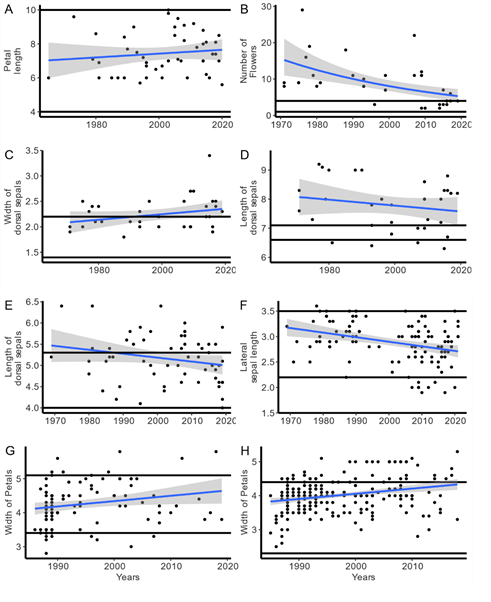
A. Variation in petal length in Brassavola nodosa, size of petal length of ex situ plants is within (W) natural range of the species.
B. Number of flowers in Cattleya granulosa, most of the plants had higher number of flowers than the range described for the species (+O).
C. Dorsal sepal width in Cattleya granulosa, most plants had large DSW than in the literature (+O).
D. Dorsal sepal length in Cattleya granulosa, most plants had large DSL than in the literature (+O).
E. Dorsal sepal length variation in Cattleya aclandiae, many of the plants had large characters (+O).
F. Lateral sepal length in Phalaenopsis violacea, note the many plants which had smaller LSL (-O).
G. Petal width in Paphiopedilum maliopoense, note plants that are larger and smaller than the natural range (±O).
H. Petal width in Paphiopedilum macranthum, note plants that are larger and smaller than the natural range (±O).
Figure 2. Examples of morphological variation within or outside the range of in situ species. Visual representation of a subset of the species evaluated in Table 10. In each figure the horizontal lines represent the maximum and minimum size of the characters as described in the literature (see Table 1 for references). The blue line is the slope and the shade area the 95% CI (See Table 2).
Only in five cases did we identify species with morphological character in the database that were within (W) the described morphology of wild individuals (i.e, PL in Brassavola nodosa, LL in Paphiopedilum bellatulum (Rchb.f.) Stein, see Table 10), which encompasses only 4% of the variables evaluated. Ex situ grown species were observed to have either larger morphological characters than those found in natural populations (75%), smaller (2%) or both (19%). Overall, 96% (120 of 125) of the evaluated characters of ex situ plant morphology were sometimes outside the range of plant description from the literature (Table 10).
Considering only the three genera with the greatest number of species, Paphiopedilum (8 spp) Cattleya (9 spp) and Phalaenopsis (4 spp), we observed significant differences in the number of characters which were in the different categories. The main difference was in those in the normal range of the species with 79% in Paphiopedilum, 79% in Cattleya and 57% in Phalaenopsis (Fisher's Exact test with Monte Carlo simulation p < 0.02; Table 11). Cattleya had 22% of the characters which were smaller and larger than species description. This suggests that the selection for characters differences from in situ may differ among genera. The range of morphological characters in ex situ plants were often outside and larger than the range of in situ plant description (range 64-95%) for all characters except LL (36%). LL for some species had either larger and smaller morphological size (43%), showing an inconsistency compared to other characters (Table 12). Note that sample size and characters evaluated is different from previous analysis as gathering quality data of in situ morphological characters were often challenging. As an example, Angraecum leonis (Rchb.f.) André only data on NumF was considered of confidence (Table 11).
Table 11 The proportion of species by genera which had morphological characters either larger ''+'', smaller ''-'', both ''±'' or within ''W''. The proportions are rowwise. See Table 10 for character description.
| Genus | + | - | ± | W |
|---|---|---|---|---|
| Angreacum | 1.00 (1) | 0.0 (0) | 0.0 (0) | 0.0 (0) |
| Brassavola | 0.86 (6) | 0.0 (0) | 0.0 (0) | 0.14 (1) |
| Cattleya | 0.78 (42) | 0.0 (0) | 0.22 (12) | 0.0 (0) |
| Paphiopedilum | 0.79 (33) | 0.0 (0) | 0.12 (5) | 0.09 (4) |
| Phalaenopsis | 0.57 (12) | 0.10 (2) | 0.33 (7) | 0.0 (0) |
Table 12 The proportion of species which had morphological characters either larger ''+'', smaller ''-'' or both ''±''. The proportions are rowwise. See Table 10 for character description. Dorsal sepal length (DSL), dorsal sepal width (DSW), petal length (PL), petal width (PW), lateral sepal length (LSL), lip length (LL), number of flowers (NumF).
| Categories | + | - | ± | W |
|---|---|---|---|---|
| DSL | 0.75 (15) | 0.0 (0) | 0.20 (4) | 0.5 (1) |
| DSW | 0.95 (19) | 0.0 (0) | 0.05 (1) | 0.0 (0) |
| PL | 0.62 (13) | 0.0 (0) | 0.33 (7) | 0.05 (1) |
| PW | 0.85 (17) | 0.0 (0) | 0.10 (2) | 0.05 (1) |
| LSL | 0.64 (7) | 0.09 (1) | 0.27 (3) | 0.0 (0) |
| LL | 0.36 (5) | 0.07 (1) | 0.43 (6) | 0.14 (2) |
| NumF | 0.95 (18) | 0.0 (0) | 0.05 (1) | 0.0 (0) |
Discussion
Artificial selection.-
In general, we noted that plants that are grown ex situ frequently show a trend of either increasing or decreasing size in time. This index suggests that there is artificial selection for morphological characteristics of orchid flowers by orchid enthusiasts. The presence or lack of artificial selection in some characters appears to be more consistent across species. Some characters seem to have little to no evidence of artificial selection, such as LL. The lack of evidence of artificial selection in some characters is likely to be attributed to the lack of interest by growers for that characteristic or alternatively little genetic diversity within species for that specific characteristic may be present. Alternatively, the size of the lip (length and width) is likely to be highly correlated with the fitness of the individual in situ, as the relationship between pollinator size and lip size is likely to be important. Therefore, there may be selection against variation (stabilizing selection) and thus selection for reduced genetic diversity and consequently, phenotypic variation. If growers were interested in modifying lip size, the artificial selection process may be more tedious.
Other characteristics such as DSW and PW do show evidence of change across time in many species or frequently within a specific genus. The DSW showed a significant change in 14 of 17 species of Paphiopedilum. This suggests that growers may be selecting for this characteristic.
NumF was the character that showed the highest artificial selection, with 43% of species showing either a negative or positive change in time. NumF on a plant can drastically influence the reproductive success in the field. For example, in Cyclopogon elatus (Sw.) Schltr., where Benitez-Vieyra et al. (2006) showed that for small display size there is stabilizing selection. Orchid species studied in the field often show that the larger the floral display the higher reproductive success (pollinaria removal or fruit set; Tremblay 2005 and references within), although in at least one case smaller inflorescence had higher reproductive success (Ionopsis utricularioides (Sw.) Lindl., Montalvo & Ackerman 1987). What is the cost of having larger inflorescence for the lifetime reproductive success of an orchid? This topic has rarely been studied in orchids (Calvo 1993, Obeso 2002, Tremblay et al. 2005), let alone evaluating if in ex situ orchids with larger inflorescence re-established in nature would result in lower fitness because of the extra cost of producing these.
Ex situ vs. in situ morphological range.-
Floral characters are frequently either larger or smaller than the species description. This would suggest that growers are selecting for characters outside the ''normal range'' of the species. The assumption that the difference between the range of floral characteristics of ex situ species and the range in the natural environment (in situ diversity) is a ''good'' representation of the morphological variation of the species in the field should be weighted with caution. This assumption is not likely to hold for many species, as the number of observed plants for the original or posterior species collection and description are frequently limited to few individuals, consequently the species taxonomic description is possibly a reduced subset of the variation in their natural environment. In general, taxonomists rarely mention the number of individual plants they used to describe a species; thus, it is difficult to evaluate if the morphological variation observed represent the varying ecological, temporal and geographical distribution of the species. Even more worrisome is when the selection of the plants in the field as ''type specimen'' are biased towards specific characteristics such as larger plants/flowers or larger inflorescences. In most cases, none of the prior mentioned drawbacks are available to evaluate critically, and consequently, one has to assume that the description is a ''good approximation'' of the morphological diversity of species in situ. This assumption should be tested to determine if there is a systematic bias in species description as compared to in situ plant characteristics.
Phenotypic variation.-
The origin of morphological variation (Newman & Müller 2000, Rebeiz & Tsiantis 2017, Salazar-Ciudad 2007) and its evolutionary processes is a complex area of study (Budd 2006, Endler 1986, Pigliucci 2005, Shepard & Purugganan 2002). Three main components which influence morphological variation include genetic variation, environmental conditions and the interaction between genetics and the environment interaction (phenotypic plasticity). Where does most of the variation in floral characteristics come from, and what is the environment, genetics and phenotypic plasticity impact on the total phenotypic variation of a species?
There are constraints to morphological variation and phenotypic plasticity (Muren et al. 2015, Snell et al. 2010), and its evolutionary significance can be important (Bradshaw 1965). Climate change may also in fluence phenotypic plasticity (Arnold et al. 2019) and this area of study has yet to be explored in orchids. Morphological and colour variation in the wild has been studied in many orchids but has yet to elucidate many of the questions mentioned above (Bateman & Rudall 2006, Blinova 2012, Dormont et al. 2019, Shi et al. 2009, Tremblay 1997). The plasticity of morphological characters and ability to vary across time is most likely genetically complex, consequently, for some characters it is possible that the selector (growers) was not interested in some specific morphological characters, thus little artificial selection is noted, orienting their focus on other morphological characters. Naturally, it assumes that there is an underlying genetic diversity that can be selected for the specific character of interest and that phenotypic plasticity may play a substantial role in the morphological diversity of plants in situ and ex situ in orchids.
Studies of phenotypic selection in orchids in the wild are limited, with evidence showing that phenotypic selection is variable in time (Benitez-Vieyra et al. 2009) and space (Cintrón-Berdecia & Tremblay 2006, Maad 2000). Not surprisingly evidence of varying phenotypic selection among orchid species is common (Moré et al. 2012). The only paper noted in Google Scholar of orchids studying phenotypic plasticity attempted to evaluate the CAM response of photosynthetic behavior in two orchid genera, Angraecum and Microcoelia Lindl., showing very little variation in CAM response across species (Kluge et al. 2001).
Artificial selection and adaptation to natural populations.-
We do not know if the change in morphological size observed in ex situ plants would result in differential fitness if these species with selected characters that vary from their in situ counterparts were to be re-introduced in the native habitat. Nor do we know if these ex situ plants would retain those size characteristics in situ. Growth conditions in situ often reduces stress on plants because resource availability is controlled and is likely to be less constrained than under ex situ conditions. However, morphological differences of sometimes minute change in floral characters in many species have been shown to impact reproductive success of plants in general and orchids (Gasket 2012, Juillet & Scopece 2010 and references within). Thus, it is most plausible that these plants would be non-adaptive if morphological characters of ex situ plants varied from in situ plants and are retained in a reintroduction conservation program. There is multiple evidence that ex situ plants do acquire characteristics which are different and potentially less adaptive to in situ environments. Lofflin and Kephart (2005) showed that in a re-establishment experiment of the Silene douglasii Hook. (Caryophyllaceae) in sympatry with in situ plants of the same species, ex situ individuals were highly maladapted. This may not need to be the case for all species (Hamelin 2012). In one of the few orchid reintroduction programs, Aggarwal and Zettler (2010) showed a very good survival rate of Dactylorhiza hatagirea (D.Don) Soó; however, these seeds were collected from the wild and thus unlikely to have been under artificial selection. They grew the seeds on a growth medium, and this procedure did not appear to have had any effect for differential survival in their two-year survey.
Plants in ex situ can shift the mean of traits of some characteristics such as germination, flowering time, and decrease in stress tolerance and also dormancy period (Ensslin et al. 2015, 2018, Rauschkolb et al. 2019) and even resistance to herbivory (Wang et al. 2021). Consequently, when considering plant traits, one should consider not only morphological characteristics but underlying molecular and biochemical characteristics that may influence the reintroduction process. For example, in a very large reintroduction program in Korea of the epiphytic Dendrobium moniliforme (L.) Sw., the size of plants changed across 3 years and was dependent of the host tree. Whereas a general trend plants tended to be smaller than when originally introduced; however, in a few host trees species the length of the propagule was larger (Kim et al. 2016). In a more recent review of orchid reintroduction and their interactions with orchid mycorrhizal fungi (OMF), the concept of artificial selection (or natural selection) as a process that could influence reintroduction success rate was not even mentioned (Zhao et al. 2021); however, the authors clearly propose a protocol that includes many variables that need to be considered and are required for rebuilding sustainable in situ populations. One area of research that needs to be explored, if ex situ plants are to be introduced to their native habitat, is the relationship between OMF and the fitness of the orchid. In ex situ orchids OMF are often absent (Irene Díaz; pers. comm.) and the impact of this on the fitness of a re-introduction effort is unknown.
Limitations.-
Large variation in morphology as a consequence of environmental conditions may result in variation in size which may or may not be heritable. Most quantitative morphological characters are not heritable by simple Mendelian inheritance. In addition, it is most likely that quantitative variation is a consequence of not only genetics but an interaction between genetics and the environment (phenotypic plasticity). Phenotypic plasticity, or at least variation in morphological size of individuals across years can vary enormously (Tremblay & Bould 2017, Tremblay et al. 2010) and influence reproductive potential (Tremblay et al. 2010). In many, cases, evidence for larger or smaller morphological characters in time of ex situ plants were noted, suggesting that ex situ species may be under artificial selection. In addition, observation that many plant characters are larger in ex situ environments than in nature (Table 8) is likely in part due to higher quality resources and cultivation management as compared to the natural environment. It is possible that plants in nature are most frequently smaller than their genetic potential because of resource limitations. Thus, the morphological variation and range in in situ environment may be reduced as compared to ex situ plants.
Conclusions
Awarded ex situ orchids show ample evidence of artificial selection. Ex situ conservation has the main objective of conserving the maximum amount of genetic and morphological variation of any species in the wild until these can be re-introduced in their native habitat. Presumed ex situ conservation strategies that change the morphological size and variation, and genetic diversity are likely to fail in in situ when these are re-introduced in their native habitat. Artificial selection while in non-native habitat may result in a change in the diversity of genetic diversity and morphology, which might be maladaptive when re-introduced in the wild. Award-winning species are most likely to be a small subset of the diversity of genetic and morphological characteristics of native species and thus should not be perceived as an ex situ conservation strategy. What are the morphological and genetic characters which are needed for successful reintroduction of orchids in their native habitat? Limited information on the morphological characters of in situ populations of orchids and how this influences fitness in their native habitat is present in the literature. The ecological niche of orchids is likely to be highly complex when considering the complexity of the life history of orchids (Swarts & Dixon 2017). Future studies should be undertaken to evaluate if the hypotheses developed above hold any validity. For example, selecting a species that has been under cultivation and shown to morphologically vary from natural populations and reintroduced to its native habitat to determine if the ex situ plants can be successfully integrated to a local population even if they morphologically differ from the in situ plants after re-establishment. This is possible if most of the variation in size of ex situ plants is a consequence of the environment or phenotypic plasticity, not solely genetically based.
Authorship. RLT developed the concept and statistical methods, first draft and analyzed the following genera (Brassia, Brassavola, Cattleya, Dendrobium, Laelia, Paphiopedilum). PAAR analyzed Paphiopedilum, AAR analyzed Aerangis and Angraecum, and SDR analyzed Phalaenopsis and Cattleya. IMT prepared part of the visualization tables and figures.

