


 English (pdf)
 Article in xml format
 Article references
 Send this article by e-mail
 Cited by SciELO
  Similars in
SciELO
Similars in
SciELO  uBio
uBio 
 Permalink
Introduction
Orchidaceae comprise species ranging in size from small (e.g., Campylocentrum insulare C.E.Siqueira & E.M.Pessoa with 0.5 mm in stem length) to gigantic (e.g., Grammatophyllum speciosum Blume, greater than 3 m in stem height), carrying from one (e.g., Dimerandra emarginata (G.Mey.) Hoehne) to thousands of flowers (e.g., G. speciosum) sustained by short unramified to long and ramified scapes (Siqueira et al. 2015, Yukawa et al. 2013, Zotz 2000). The large vegetative and reproductive sizes found in orchids are frequently associated with increased reproductive success, represented by numerous pollination events and more and larger fruits (Rodríguez-Robles et al. 1992, Scopece et al. 2014).
Increased size and successful reproduction among angiosperms depend on distinct biological functions such as resource uptake and transport by roots and stems; photosynthesis by leaves; pollinator attraction by scape, sepals and petals; reproduction by flowers, and packing and dispersal of seeds by fruits. The performance of these functions depends on organ traits like form, color, mass, number, and size (Kleyer & Minden 2015). Furthermore, plants differentially allocate resources to vegetative and reproductive organs throughout their ontogenetic trajectories (Cheplick 2020, Poorter & Sack 2012). Thus, allocation analyses would benefit by evaluating how organ traits change with plant size to reveal how plants acquire, store, and utilize resources (Reekie & Bazzaz 1987) to ensure vegetative growth and reproduction (Violle et al. 2007).
The relevance of this approach for orchids is supported by evidence showing that reproductive allocation could be positively related to some organ traits (Feng et al. 2021, Scopece et al. 2014). For example, the number, size, and dry mass of leaves of some orchid species are positively correlated to the number, size, and dry mass of flowers and inflorescences (e.g., 26 different species in Feng et al. 2021, 33 different genotypes of Phalaenopsis Blume in van Tongerlo et al. 2021), probably due to an increase of water and nutrients storage at the leaf level (Zotz et al. 2001). This positive correlation is also found between scape traits (e.g., number, diameter, length, and dry mass) and the number and size of flowers and fruits in orchids (e.g., Aspasia principissa Rchb.f., Zimmerman & Aide 1989; Comparettia falcata Poepp. & Endl., MeléndezAckerman et al. 2000; Phalaenopsis, van Tongerlo et al. 2021). However, correlations between root traits and reproductive allocation in orchids are very scarce. Orchid roots can vary in number, length, diameter, and dry mass when belowground resources (e.g., Orchis morio L. and Dactylorhiza fuchsii (Druce) Soó, Mckendrick 1996) and mycorrhization (e.g., Chloraea gavilu Lindl., Pereira et al. 2020) are limited, or when plant size and air temperature increases (e.g., Dimerandra emarginata (Zotz 2000) and Phalaenopsis (van Tongerlo et al. 2021), respectively). Although changes in root traits can potentially limit the number of resources derived from stems and leaves that are allocated to the inflorescence (Obeso 2002), the relationship has yet to be quantified for orchids.
The allocation of resources to different organs of orchids, while they increase in size, needs further investigation to understand better how it affects plant fitness (Zotz 2000). Such investigation can also contribute to orchid conservation (Štípková et al. 2021) and horticultural economy (van Tongerlo et al. 2021) via fitness improvement. Special attention should be paid to the fact that some of the capacities mentioned above of organ traits to predict reproductive success in orchids may be seasonally dependent (e.g., a significant correlation between leaf length and flower number in Comparettia falcata varies among sequential years, Meléndez-Ackerman et al. 2000), or ecologically dependent (e.g., resource versus pollen limited orchids present distinct organ traits correlation, Zimmerman & Aide 1989) while other traits would not be good predictors (e.g., shoot dry weight is not significantly correlated with flower number in Phalaenopsis, van Tongerlo et al. 2021). All these data reinforce the importance of more studies about the effect of size on vegetative and reproductive allocation by orchids.
Here, the possible influence of size on resource partitioning among vegetative and reproductive organs is analyzed intraspecifically using 35 reproductive individuals of the epiphytic, orchid Lankesterella ceracifolia (Barb.Rodr.) Mansf., growing closely together on the same host branch of Mangifera indica L. (Anacardiaceae). The following specific questions were addressed, focusing on this possibility: 1) How is size change translated into functional vegetative traits of organs responsible for the resource uptake, storage, and use by L. ceracifolia? 2) How is size change translated into functional reproductive traits of organs responsible for flower support and pollinator attraction by L. ceracifolia? 3) How does resource partitioning to scape and flowers quantitatively influence the size dependency of final reproductive allocation of L. ceracifolia?
To answer these questions, vegetative and reproductive organ traits, such as root length, leaf area, scape length, and flower number, were quantified for this orchid to understand how increasing plant size is translated into biological functions like resource foraging and pollinator attraction. It is hypothesized that increased allocation to specific structures of vegetative and inflorescence bodies will show which are more relevant to the fitness of this orchid as plant size increases. Subsequently, the respective influences of scape and flowers on final reproductive allocation with increasing plant size were determined.
Materials and methods
Study species and site.-
The genus Lankesterella Ames comprises 16 small epiphytic species with compact, rosulate leaves (Salazar & Dressler 2011). The species L. ceracifolia is found in South America, mainly Argentina and Brazil, in the Tropical Ombrophilous Forest (Pridgeon et al. 2003). This orchid species presents a vegetative body with a maximum of 2 cm in height excluding flowers (Fig. 1A-B).
Individuals of L. ceracifolia of varying sizes (Fig. 1A) were found in flowering state on a single branch of Mangifera indica from the plant collection of the Rio de Janeiro Botanical Garden. The climate in the study area is detailed in Mantovani et al. (2017). Although few individuals present ''grouped rosettes'' (Pridgeon et al. 2003), which are represented by two or three interconnected ramets with one inflorescence each, thirty-five flowering individuals of L. ceracifolia represented by only one ramet with one mature inflorescence were collected for the study (Fig. 1C). Special effort was dedicated to collecting individuals, the sizes of which encompassed the full reproductive size shown by this species in this restricted population (Fig. 1D) (Weiner et al. 2009). All individuals were collected from a single branch 40 cm in length per 30 cm in height positioned 3 m in height above the soil to avoid genetic and macro scale differences in environmental conditions originating from distinct host species and sites (Zotz 2000).
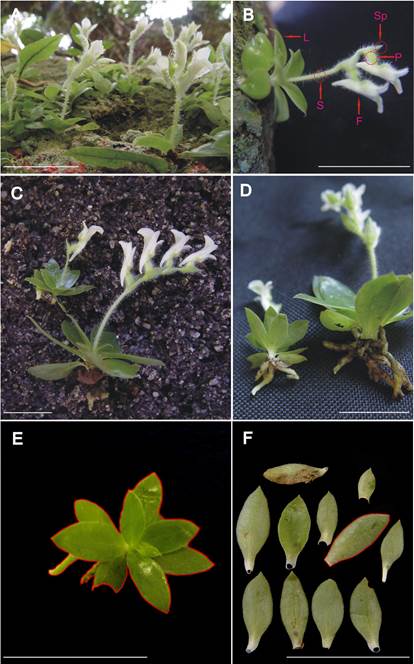
A. Habit. A smaller plant with one flower at the left and a larger one with two flowers at the right are seen on the frontal plane. Note the compact rosette leaves when laterally seen.
B. An individual in detail. Leaves (L), scape (S), sepal (Sp), pedicel (P) and flower (F) are indicated.
C. Lateral view of two individuals representing variation in plant size. Note that the long scape length is supporting four flowers on the right.
D. Same as C, but in detail to differentiate the root systems.
E. Rosette frontal area is delimited (red line) for individual.
F. Another individual had its leaves separated and determined in its surface area (example for one leaf delimited by a red line). Scale bar = 3 cm.
Figure 1 Morphology of Lankesterella ceracifolia with increasing plant size.
Functional organ traits.-
The plants were carefully removed from their host with particular attention to conserving the integrity of the root system and brought to the laboratory in humid plastic bags. In the laboratory; each individual was separated in its fasciculated (Salazar & Dressler 2011) root system, inflorescence, and interconnected leaves (Fig. 1D). Species of this genus are considered acaulescent by Pridgeon et al. (2003). The intention was first to quantify the bi-dimensional frontal area delimited by the small rosette of leaves (sensuSalazar & Dressler 2011, hereafter called 'rosette frontal area'). This parameter can indicate how a modification to leaf number and size of leaves influence self-shading via leaf overlapping and potentially limit photosynthesis by rosette frontal area (Barthélémy & Caraglio 2007). For this, the rosette of leaves was digitally photographed from above with a millimeter ruler, and the frontal area was determined using Image Pro-Plus software (Fig. 1E). Afterward, leaves, roots, and inflorescence were carefully separated into their respective parts. The unit area of each non-superposed leaf (Fig. 1F) was determined as above and summed to determine the trait hereafter called 'total leaf area' per individual. As such, each individual of L. ceracifolia was quantified in its respective traits rosette frontal area, total leaf area, and the number of leaves. The traits 'number of roots' and total root length (i.e., the sum of all root lengths) were determined for each individual using Image Pro-Plus software.
Lankesterella ceracifolia has an erect raceme inflorescence composed of one peduncle (Pridgeon et al. 2003) (for now on called a scape), projecting orchid flowers sustained by a very short pedicel. One little green sepal is present near each flower (Fig. 1B). Clear separation of the short pedicel from the inferior ovary (Salazar & Dressler 2011) was very difficult. As such, each inflorescence was then carefully separated into its respective scape, sepals, and in the conjunct constituted by short pedicel+flowers (hereafter called flowers). The traits length of scape, as measured with a digital 0.01 mm caliper, and number of flowers were also quantified for the inflorescence of each individual. After that, the roots, leaves, and inflorescence parts of each individual were separately stored in glass containers and dried until constant weight at 50 °C, followed by final weighing on a 0.0001 g Sartorius precision balance to determine its respective dry mass.
Size changes of functional organ traits and of reproductive allocation.-
Variations in size and dry mass of functional organ traits were evaluated by direct regression of pairs of variables against each other using a linear regression model. Before to regression analysis, all variables were log10 transformed (Méndez 2001). If allocation remained unchanged with increased size, then the expected slope (identified here by the parameter α sensuNiklas 1994) of the regression line would be 1 (α=1), indicating isometry. Departures from this expected isometric slope value (α≠1) would indicate an allometric preferential allocation to one of the structures compared. Coefficients of variation (R2) and slopes from regression lines were calculated using Standardized Major Axis (SMA) Regressions. In contrast, departures from a slope value of 1 were subjected to the F-test (Warton et al. 2006). The potential phenotypic integration of scape and flower components of the inflorescence was evaluated by positive Pearson correlation (Torices & Méndez 2014). Since some relationships among non-log transformed data between vegetative and reproductive structures appeared curvilinear, data stabilization was tested using ANOVA analysis of OLS polynomial regressions, as detected by significant bx2 constant (Zar 1996). Graphs with non-log transformed data are presented here to better visualize the true raw data distribution and curvilinear stabilization when present. The same graphs but with log-transformed data are presented as supplemental material.
Plant size dependency of reproductive allocation of L. ceracifolia was evaluated by comparing regressions between Reproductive (y-axis) and Vegetative (x-axis) dry masses (RV relationship sensuWeiner et al. 2009). Vegetative dry mass was used as a measure of plant size (Sugiyama & Bazzaz 1998), and it was calculated as the sum of the root, and leaf dry masses. Reproductive dry mass was considered the sum of scape, sepals, and flower dry masses. The methodology proposed by Klinkhamer et al. (1992) via a log likelihood-ratio test was used here (Sugiyama & Bazzaz 1998). The likelihood test provides a way of assessing the goodness of fit of different regression models, i.e., how well each model fits a set of observations based on 'the least squares sum of the errors'. The likelihood ratio obeys to Chi-square distribution and tests the following null hypothesis: 'goodness of a fit' does not vary among models even if more parameters are included. If a statistical difference is detected, indicating the data really fits in one better than another, the respective model parameters and coefficient of variation (R2) are contextualized. Also, the Akaike's information criterion (AIC) (Sakamoto et al. 1986) was performed to evaluate and compare the regression models used.
The method compares Model 0 (simple regression model R = aV), Model 1 (linear regression model R= a(V-b)), Model 2 (allometric regression model R= aVc), and Model 3 (non-linear regression model R= a(V-b)c) (nomenclature sensuSugiyama & Bazzaz 1998) using a single analysis that evaluates the significance of parameters a, b and c, respectively reflecting slope, intercept and allometric exponent. The four models were applied for reproductive allocation as a whole (scape+sepals+flowers) and for the individual components scape (without sepals) and flowers separately to compare the most appropriate models in each situation via residual variance analysis (Sugiyama & Bazzaz 1998). All data were log transformed before analysis. If b>0, the model presupposes a minimum threshold of plant size for reproduction. Although a negative value of b could indicate a biologically unrealistic 'flower without plant' scenario (Klinkhamer et al. 1992), it could also result from distinct developmental trajectories (Bonser & Aarssen 2009) and should be considered with caution. With c≠1, reproductive allocation follows a non-linear relationship with plant size (Guo et al. 2012). While the significance of parameters b and c, with their respective upper and lower 95% confidence intervals (CI), were determined via the likelihood test, the significance of parameter a and its respective CI was evaluated via t test (Zar 1996). Standardized Major Axis regression was developed using SMATR, after the assumptions of independence and aleatory distribution of residuals were confirmed (Warton et al. 2006). The R statistical platform (R×64 3.4.1, R Core Team 2022) was used for the log likelihood-ratio test cited above. Significance was assumed at P < 0.05 (Zar 1996). Graphs were presented here with non-log transformed data to better visualize raw data distribution and curvilinear stabilization when present. The same graphs but with log-transformed data were presented as supplemental material.
Results
Size changes of functional organ traits.-
Rosette frontal area of L. ceracifolia varied from 1.4 to 12.6 mm2 (Fig. 2, also as supplemental material Suppl. 1). Number of leaves (R2 = 0.36) and total leaf area per individual (R2 = 0.81) were positively related to rosette frontal area (P < 0.001). Number of leaves, instead of total leaf area, mostly determined rosette frontal area in smaller plants (i.e., < 7 mm2 of rosette frontal area), beginning with five leaves on smaller plants, but stabilizing with 12-16 leaves on larger plants. Instead of number of leaves, total leaf area per individual mostly determined rosette frontal area on larger plants (> 7 mm2 of rosette frontal area), stabilizing on 12-21 mm2 of total leaf area (Fig. 2A). This is clearly shown when total leaf area increases linearly and without stabilization with leaf dry mass (R2 = 0.91), while rosette frontal area (R2 = 0.64; P > 0.001) stabilizes when leaf dry mass is around 0.03 g (Fig 2B). Although the total leaf area and the number of leaves are continuously increasing, results show that leaves of L. ceracifolia are superposed, one above the other, owing to basal rosette arrangement, stabilizing the larger rosette frontal areas at 8-12 mm2.
Both total root length (R2 = 0.37) and number of roots (R2 = 0.23) increased (P < 0.01) with rosette frontal area of L. ceracifolia (Fig. 2C). Total root length per individual varied from 1.1 to 23.5 cm. In contrast, the number of roots per individual increased from one to 13 roots. The total root length increased faster than the number of roots per individual as slope regression between both variables was significantly different from 1 (α = 1.33 (CI= 1.19-1.50), F1, 28 = 24.88, P < 0.001). On larger L. ceracifolia plants, longer roots, rather than numerous roots, were produced, which is shown by the increase of root length to root number with rosette frontal area (R2 = 0.45, P < 0.001). None of the root parameters described above presented stabilization with plant size increase. Leaf dry mass was positively correlated with root dry mass (R2 = 0.35, P < 0.001) (Fig. 2D) with slope slightly different from 1 (α = 1.64, CI = 1.21-2.23, F1, 28 = 11.10, P = 0.002), indicating preferential allocation to leaves along size increase of L. ceracifolia.
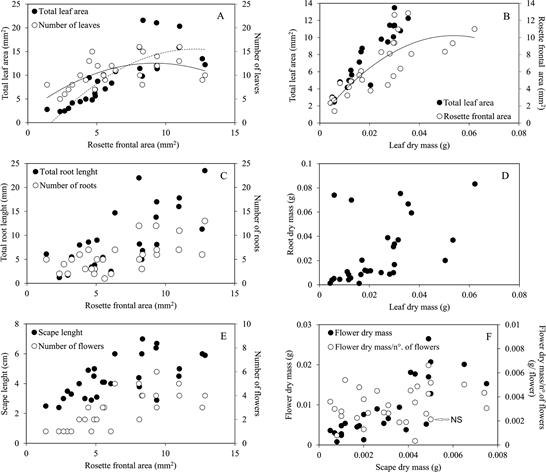
A. Rosette frontal area per individual is mainly influenced by the respective number of leaves (○) in smaller plants but by respective total leaf area (●) in larger plants.
B. Rosette frontal area (○) per individual stabilizes around 10 mm2 when leaf dry mass per individual is around 0.03 g. Total leaf area per individual (●) does not show stabilization.
C. Total root length (●) and number of roots (○) per individual increase linearly with respective rosette frontal area.
D. Root dry mass per individual increases linearly with leaf dry mass per individual.
E. Number of flowers (○) and scape length (●) per individual increase linearly with respective rosette frontal area.
F. Flower dry mass (●) increases linearly with scape dry mass per individual. However, the ratio of flower dry mass/number of flowers (○) does not significantly (NS) change along with scape dry mass, indicating that mean flower dry weight does not change with plant size or rosette frontal area per individual.
Graphs are presented here using raw data. Graphs with log10 transformed data are presented as supplemental material.
Figure 2 Functional organ traits and dry mass allocation along increasing plant size of Lankesterella ceracifolia. Curved lines indicate stabilized relationships, as detected by significant bx2 coefficients. Others (with no lines) are significant linear regressions without stabilization unless indicated by NS (nonsignificant).
Size changes of reproductive allocation.-
Vegetative dry mass increased from 0.005 to 0.145 g, varying by a factor of 25 with a mean value of 0.04 ? 0.035 g. Reproductive dry mass varied by a factor of 19, from 0.0016 to 0.031 g, with mean values of 0.0120 ? 0.0080 g (Table 1). The mean dry mass was 3.5 times higher for vegetative bodies as compared to the reproductive bodies.
The dry mass of scape (without sepals) varied by a factor of 15 from 0.0005 to 0.0075 g, while dry mass increased by a factor of 6 in sepals from 0.0002 to 0.0012 g. The mean dry mass of the scape and sepals, respectively represented 24.7 ± 13% and 5.1 ± 2.2% of the whole inflorescence dry mass. The dry mass of flowers was much higher, increasing by a factor of 33 from 0.0008 to 0.0265 g (Table 1). Mean flower dry mass represented 70 ± 15% of the whole inflorescence dry mass. Flower dry mass (R2 = 0.46, P < 0.001) was correlated in an isometric manner with scape dry mass (Fig. 2F) with a slope regression not significantly different from 1 (P = 0.187). As represented by the ratio of flower dry mass/number of flowers the unit flower dry weight did not change significantly with increasing scape dry mass (R2 = 0.02, P = 0.40). Scape length varied from 2.4 to 6.7 cm, carrying from just one to a maximum of six flowers. Both scape length and number of flowers were positively correlated (Fig. 2E, R2 = 0.66) with the increase of rosette frontal area of L. ceracifolia. Although isometrically related to scape dry mass, when correlated to scape length, flower dry mass ((α = 2.92 (CI = 2.18-3.92); F1, 28 = 77.15, P = 0.001) and number of flowers ((α = 1.91 (CI = 1.43-2.55), F1, 28 = 23.26, P = 0.001) increased in an allometric manner (R2 = 0.40-0.42) as indicated by slope regressions significantly higher than 1. Consequently, allocation of dry mass in flowers increased faster than scape length increase, as L. ceracifolia gets bigger.
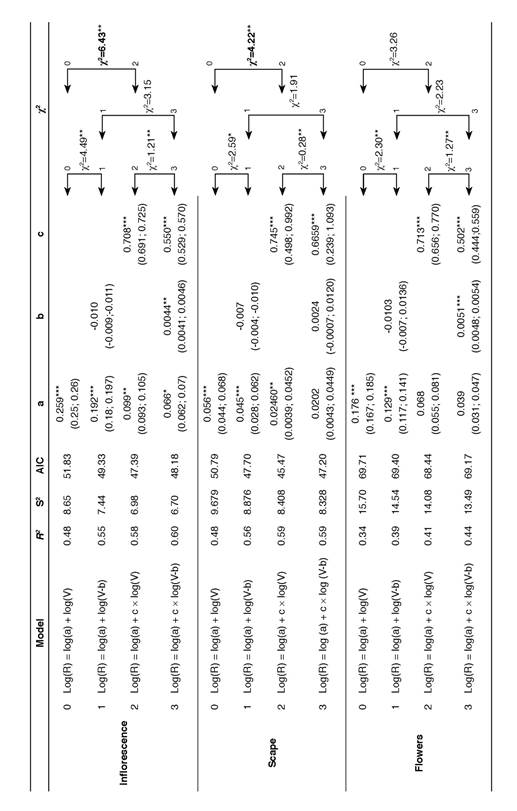
The differences in the scape and flower dry mass components influenced how reproductive allocation in the whole inflorescence of L. ceracifolia changed with plant size, as shown by RV regressions (Fig. 3, also as supplemental material Suppl. 2). The proportion of variances explained by the models (R2), the residual variance (S2), AIC indices and the values of parameters in the four regression models were applied to the whole inflorescence and for both components separately, as shown in Table 2. Error variance declined systematically from Model 0 to Model 3 in all three situations, as represented by the increase in R2 and the decrease in S2. This result is corroborated by the simultaneous decline of the AIC indices. A significant improvement (χ2 = 4.49, P = 0.03) occurred from Model 0 (simple regression) to Model 1 (linear regression), even though parameter b was not significantly different from that of 0 (P = 0.13) beginning with the whole inflorescence. Another significant improvement (χ2 = 6.43, P = 0.01) was only achieved for the whole inflorescence when Model 0 was compared to Model 2 (allometric regression). Here, parameter a (scaling) was 0.099 (CI 0.093-0.105), and allometric exponent c (0.708; CI 0.691-0.725) was lower than 1, indicating that dry mass allocation to the inflorescence is size-dependent. Although b (intercept = 0.0044, CI 0.0041-0.0046) is significant and residual variances diminished in Model 3, no regression improvement was achieved when this model (non-linear regression) was compared to Model 2 (P = 0.27), indicating that the allometric model is the most appropriate model for whole inflorescence regression.
Table 1 Minimum and maximum dry mass (g) values of vegetative and reproductive bodies of the orchid Lankesterella ceracifolia along increasing plant size. Number in parentheses indicates the factor of increase in the respective value.
| Components | Dry mass (g) | Increase |
|---|---|---|
| Roots | 0.0012-0.083 | (2.6) |
| Leaves | 0.0043-0.062 | (14.4) |
| Vegetative | 0.0056-0.1455 | (25.9) |
| Scape | 0.0005-0.0075 | (15) |
| Sepals | 0.0002-0.0012 | (6) |
| Flowers | 0.0008-0.026 | (33.1) |
| Reproductive | 0.0016-0.031 | (19.6) |
A similar result was found when only the dry mass of scape (R) was related to vegetative dry mass (V). Here, allometric Model 2 was the best model fitted compared to the others, indicating that dry mass allocation to the scape is size-dependent. In Model 2, parameter a was low (0.024, CI = 0.0039-0.045) with an allometric exponent c of 0.745 (CI = 0.498-0.992) also lower than 1. However, parameters a (scaling; P= 0.07) and b (intercept; P = 0.62) were not significantly distinct from 0 in Model 3 for the scape, suggesting that allometric Model 2 was the best model to fit RV regression involving scape dry mass. Finally, the best regression model for flowers was the simple one (Model 0), as no significant improvement was found compared to Models 1, 2, or 3. As such, dry mass allocation to flowers is not size-dependent. In the case of flowers, although allometric exponent c (0.713 and 0.502, respectively) was significant in Models 2 and 3 (P = 0.001), parameter a was not significant (P >0.05) for the same models, which was not enough to improve model fitting. The proportion of explained variance using only flowers (R2 = 0.34- 0.44) was almost 20% lower than the same regression parameter (R2 = 0.48-0.60), using only the scape or the whole inflorescence.
Discussion
The scape generally contributes more to total inflorescence construction than any other component, reaching up to 70% of reproductive dry mass (Torices & Méndez 2014). However, the opposite trend was found here for L. ceracifolia, independent of plant size. Specifically, the scape represents 25% (without sepals) to 29% (with sepals) of mean dry mass invested in the entire inflorescence, while flowers represent more than 70% of the dry mass. This is an uncommon pattern among some epiphytes (Mantovani & Iglesias 2009), including other orchids (Zotz 2000), although future studies with other genera (e.g. Phalaenopsis and Comparettia, van Tongerlo et al. 2021, Rodríguez-Robles et al. 1992, respectively) may reinforce this result. Méndez (2001) suggested using allometric regression slope (α ≠ 1) to reveal if some specific component is prioritized in allocation as the inflorescence increases in size. For example, a preferential allocation to appendix (a sterile club-like structure positioned at the upper portion of the spadix, with attractive function) versus flowers and to male versus female parts with increasing inflorescence size is cited by the same author for species of Arum L. and Arisaema Mart. (Araceae). For L. ceracifolia, the regression slope initially indicated isometry between scape and flowers, as represented by their respective dry masses. Moreover, considering the regression between scape length, instead of scape dry mass, and the number of flowers, instead of flower dry mass, the allometric slope reinforces the preferential investment in flowers as the L. ceracifolia inflorescence increases in height.
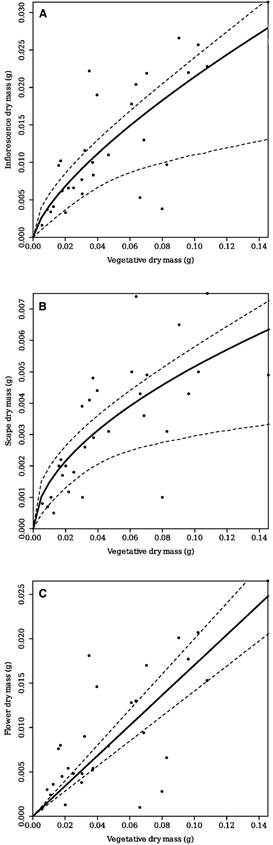
A. Whole inflorescence. (scape+sepals+flowers) dry mass.
B. Scape dry mass (without sepals).
C. Flower dry mass.
Continuous line (-) indicates Model 2 (allometric regression) in Figures 3A and 3B and Model 0 (simple linear regression) in 3C, while dash line (---) indicates the respective 95% confidential bands for each model. Respective parameters a (slope) and c (allometric exponent) besides the proportion of variance explained (R2) applying both models are shown in Table 2. Graphs are presented here using raw data. Graphs with log10 transformed data are presented as supplemental material.
Figure 3 Reproductive output along increasing plant size of Lankesterella ceracifolia. represented by 'RV' regressions.
Table 2 Test of fitting between four regression models correlating reproductive (R) and vegetative (V) dry mass of Lankesterella ceracifolia. This analysis was performed for the inflorescence as a whole and also separately for its components, scape and flowers. Model 0 (simple regression), Model 1 (linear regression), Model 2 (allometric regression) and Model 3 (non-linear regression) are detailed. For each model, the proportion of variance explained (R2), error variance (S2), Akaike information criterion (AIC) and the parameters of the regressions, i.e., slope (a), x-intercept (b) and exponent (c), are shown. Statistical test between the regressions was performed by log-likelihood ratio test of error variances, and χ2 values are given (bold χ2 values indicate the best fitting models for each component). Values in parentheses are 95% confidence intervals of parameters. Symbols are (P<0.05); * (P<0.01); ** (P<0.001).
Flower size and dry mass per flower were found to increase for the aroid species Arisaema triphyllum (L.) Schott. and A. dracontium (L.) Schott. (Clay 1993). Only weak relationships were found between plant size and the respective number of flowers per inflorescence (Méndez 2001). Flower unit dry mass was also found to increase with total leaf area in a study with 26 different orchid species (Feng et al. 2021), but no intraspecific data on this ratio was found for orchids in the literature. In L. ceracifolia, flower number increased linearly with plant size, while flower unit dry weight remained stable. According to Pridgeon et al. (2003) L. ceracifolia flowers are ''large in proportion to the size of the plant''. Flower construction for this orchid species could represent a potential developmental constraint (Bonser & Aarseen 2009, Guo et al 2012, Obeso 2002): independent of inflorescence size, a fixed amount of dry mass (around 0.003 ± 0.001 g) must be achieved before each L. ceracifolia flower is produced. A similar constraint is, for example, presented by the inflorescence of Arisaema serratum (Thunb.) Schott. as the number of ovaries on the spadix increases linearly with pseudostem size (Kinoshita 1986). Morphological, developmental, or ontogenetic constraints could be compensated by plasticity in inflorescence traits, such as the number of flowers per inflorescence or inflorescence height (Obeso 2002). Changes in inflorescence height are positively related to flower number and total floral area in the orchids Aspasia principissa, Comparettia falcata, and many others (Rodríguez-Robles et al. 1992, Feng et al. 2021, Zimmerman & Aide 1989). Here, the scape height increased by a factor of almost three, while the scape dry mass increased by a factor of 15 with increasing plant size of L. ceracifolia. Clearly, a longer scape can project L. ceracifolia flowers above smaller ones (Fig. 1A, C ) which, in orchids, could enhance floral display (e.g., in Orchis spitzelii Saut. ex C.Koch (Fritz 1990), Platanthera bifolia (L.) Rich and Dactylorhiza incarnata (L.) Soó (Matilla & Kuitunen 2000)), pollinator attraction (see Salazar & Dressler 2011 for Lankesterella pollination), pollen dispersal and final reproductive fitness (van der Pijl & Dodson 1966, Rodríguez-Robles et al. 1992, Scopece et al. 2014, Zimmerman & Aide 1989).
The assessment of allocation patterns to different inflorescence components helps to understand the selective pressures acting on its traits (Méndez 2001, Thomson 1988) in the evolution of flowering strategies (Lord & Westoby 2012, Obeso 2002). Scape height and dry mass (R = 0.60 to 0.75) were found to be positively correlated (P < 0.001) with flower number and total flower dry mass, respectively, suggesting that both structures are phenotypically integrated into L. ceracifolia. Such integration (Torices & Mendez 2014) helps to describe the reproductive strategy of this orchid species (Lord & Westoby 2012) when scape height and number of flowers are taken as currency components. For example, the inflorescence of large individuals of L. ceracifolia could consist of a dozen flowers and a shorter scape instead of producing six flowers sustained by a long scape. While the flowering presentation strategy of large individuals of L. ceracifolia consists of many flowers supported by a long scape, smaller individuals are characterized by just one flower sustained by a short scape.
Threshold size for reproduction is a key parameter in the life history of plants as it affects reproductive fitness (Bonser & Aarseen 2009, Wenk & Falster 2015). It could be graphically estimated by a positive x-intercept value (b ≠ 0) on RV regressions, as plants should attain a minimum vegetative size before flowering. However, caution should be taken as large data sets could be required to evaluate better the null hypothesis b = 0 (Klinkhamer et al. 1992). An absence (b = 0), or a negative x-intercept (b < 0), can also be graphically observed instead of a positive x-intercept value (b ≠ 0) on RV regressions. In this case, the absence of a positive x-intercept results from an investment in reproduction similar, or even higher, to the already established investment in vegetative dry mass, respectively inducing the linear regression that goes through the origin or reaches a negative x intercept (Weiner et al. 2009). The focused collection of plants in the field showed that the minimum threshold size for L. ceracifolia occurred when its vegetative dry mass had around 0.005 g, producing one flower of around 0.003 g sustained by 0.001 g of scape. Significant b values were only found in RV relationships for the inflorescence (b= 0.0041 to 0.0046) and separately for the flowers (b = 0.0048-0.0054). This result reinforces the influence of the minimum investment made in flowers to determine the threshold size for reproduction in L. ceracifolia, as parameter b in the RV relationship involving only scape was not significantly distinct from 0 (b = 0.007 to 0.0136). The reproductive event of the smallest individual of L. ceracifolia needs a minimum threshold in size to produce one flower and a little scape to sustain it (Wenk & Falster 2015). A similar phenomenon is expressed in Zea mays L. as the maize plant must reach certain biomass before producing an ear, presumably because an ear itself cannot be produced below a determined size (Echarte & Andrade 2003).
The studied flowering individuals of L. ceracifolia ranged by a factor of more than 25 in dry weight and a factor of 5 in rosette frontal area. In other words, small and large reproductive individuals were found flowering side-by-side in the same small area of a branch. As environmental adversity decreases chances of future reproduction due to potential mortality, decreased size thresholds are typically selected for the initiation of reproduction in semelparous (shortlived, annual) plant species (Guo et al. 2012), such as L. ceracifolia at the study site. Although Pridgeon et al. (2003) and Salazar & Dressler (2011) cite this species as evergreen or ''that persist during several growth seasons'', respectively, its occurrence is rare and ephemeral at the study site, lasting no more than one year (pers. observ.). On the other hand, more favorable environments, such as those with high levels of nitrogen, lower altitudes, or high substrate water contents (Méndez & Karlsson 2004), may signify more expressive vegetative growth, and, therefore, the switch should be postponed to take advantage of increased potential reproductive dry mass production in the future (Weiner et al. 2009). Variability in threshold size at reproduction can be understood in terms of a balance between costs and benefits associated with delaying reproduction to increase size and resource availability (Wesselingh et al. 1997).
Resource availability influences reproductive efficiency among orchids as attractive floral and fruit displays are costly to construct and maintain (e.g., more flowers generate more transpiration in the orchid Spiranthes cernua (L.) Rich. (Antlfinger & Wendel 1997); mature fruits comprise from 10 to 50% of the potassium of the vegetative body of the orchid D. emarginata (Zotz 2000)). Considering the highest investment in flower dry mass in comparison to the scape, it can be proposed that the production of larger inflorescences by larger individuals of L. ceracifolia depends on the capacity to acquire and store resources (Mattila & Kuitunen 2000, Sugiyama & Bazzaz 1998) to produce several flowers. The same potential relationship between vegetative growth plus storage and the amount of reproductive dry mass production is proposed for epiphytic orchids like Aspasia principissa, Comparettia falcata, Dimerandra emarginata, Phalaenopsis genotypes (Zimmerman & Aide 1989, Rodríguez-Robles et al. 1992, Zotz 2000, van Tongerlo et al. 2021, respectively), among others (Benzing 1990). Hence, how L. ceracifolia plants partition growth between roots and leaves can influence the amount of resources it can acquire and store before flowering.
Canopy habitat submits epiphytes to environmental heterogeneity (e.g., different water and nitrogen supplies) among patches (Zotz 2000) even at small scales (Zotz 2016). This can be compensated by the increase in the root traits of length, number, and dry mass, as found for L. ceracifolia and the orchid D. emarginata (Zotz 2000), which could facilitate access to nutrient-rich patches in the heterogeneous epiphytic habitat (Benzing 1990). Size differences in vegetative bodies among individuals of L. ceracifolia growing side-by-side could be related to differential resource acquisition and storage, but also competition and physiological tradeoffs (Hartgerink & Bazzaz 1984, Sugiyama & Bazzaz 1998, Zotz 2000). Root competition below bark can favor preferential resource allocation to leaves (Mattila & Kuitunen 2000). Rosette frontal area of reproductive L. ceracifolia plants increased in area by a factor of nine throughout plant growth, with larger leaves being found for larger individuals. Leaves were prioritized concerning roots in relation to dry mass allocation with increasing size of L. ceracifolia, as indicated by an allometric slope higher than 1 (Méndez 2001). Larger leaves of L. ceracifolia can enhance light foraging and water storage capacity (Bonser & Aarseen 2009, Obeso 2002, Sugiyama & Bazzaz 1998, Wenk & Falster 2015). Probably, the small size and potentially lower photosynthetic capacity of L. ceracifolia roots (Benzing 1990), frequently hidden below bark (Fig. 1A-B), resulted in the prioritization of this functional dry mass investment to leaves. The reproductive structure of the orchid Spiranthes cernua contributes 8% of carbon allocation in inflorescence via photosynthesis (Antlfinger & Wendel 1997), but most likely, this is not the case for the little whitish scape of L. ceracifolia. This means that inflorescence structures of L. ceracifolia depend mainly on carbon exported from the vegetative body, particularly leaves, to be produced.
Changes in organ traits are relevant for plant functioning under field conditions, as they influence the resources budgeted for reproductive allocation (Zotz et al. 2001). However, relationships among vegetative and reproductive organ traits are rarely evaluated together with reproductive allocation with increasing plant size (Feng et al. 2021, Kleyer & Minden 2015). The results presented here show that form, number, length and area of roots and leaves varied while the vegetative dry mass of L. ceracifolia monotonically increased with plant size. Furthermore, relative dry mass allocation presupposes that the biological function of photosynthesis was enhanced with increasing size compared to the nutrient absorption function. Finally, dry mass partitioning between scape and flowers of this orchid indicates that not only investment in flowers was higher than that for scape, an unusual pattern for vascular plants (Torices & Méndez 2014), but also that dry mass allocation to flowers was sizeindependent, while to scape was size-dependent. The investment in scape influenced the final reproductive allometry found for the orchid L. ceracifolia.

