Introduction
Sustainable agriculture is the implementation of techniques, such as precision agriculture, which preserve the environment without compromising actual levels of food production (Billib et al. 2009). Organic agriculture is the use of technologies in accordance with the socioeconomic and ecological conditions of the zone where a productive system is located (Valarini et al. 2009). It is imperative that the impact of organic agriculture management techniques, such as applying varying amounts of organic additive to an orchard, be evaluated so that appropriate practices can be developed and the risk of pollution from leaching of nutrients can be minimized (Billib et al. 2009). Descriptive statistics and geo-statistics are techniques for the elaboration of linear and spatial models of orchard conditions (Rodriguez-Vasquez et al. 2008). The use of descriptive statistics allows identifying the existence of variability of soil attributes (Orjuela-Matta et al. 2012). Fertilization and soil emendation programs can be more precise, resulting in less waste and more control of soil conditions, when groups of soil conditions are identified and categorized (Orjuela-Matta et al. 2012). Normal techniques for determining soil attributes analysis, such as determining the coefficient of variation (C.V.) through dispersion, cannot determine the spatial variability of the soil, since this technique does not give information about the pattern of spatial distribution of a particular attributes (Orjuela-Matta et al. 2012). Simple geo-statistic techniques such as with cluster analysis allow visualizing the linear correlation of soil attributes in a detailed and practical manner, in order to facilitate the management of soil through the establishment of distinct zones (Orjuela-Matta et al. 2012). Spatial distribution maps are used to identify spatial attribute changes (Dec et al. 2011). Spatial mapping is a tool which creates a visualization of the geostatistical analysis, by geo-referencing soil sampling points onto a map to thoroughly determine conditions of the soil, in order to design a management plan for each specific condition in a given area. Spatial maps that are georeferenced are useful in observing relationships of soil attributes in the area (Mandal & Sharma 2009). Interpolated spatial maps are generated through methods to estimate the values of a variable in an irregular two-dimensional array. Currently, there is no universal equation, or predictive model that can be applied to all geographic regions or purposes (Grunwald 2010). Estimation model decisions are subjective because the models are derived from the expert knowledge and a great deal of experience with soil mapping techniques and soil mapping programs (Walder et al. 2008). Digital soil maps interpolated using regression kringing are suitable for national planning (Taghizadeh-Mehrjardi et al. 2014) but there is a lack of fine detail needed to make specific evaluations (Walder et al. 2008). The amount of sample points required to make the interpolated maps useful for precision agriculture, is subjective to the purpose of the proposed study (Yang et al. 2013). Studies have shown a high variability of values, when comparing the same sample area, generated with a different number of points, resulting in an overestimation for the smaller sample size (Carvalho-Guedes et al. 2013). Studies suggest a low accuracy regarding the similarity between the maps generated for the estimated values depending on appropriate sample size and manner of equating the interpolation (De Bastiani et al. 2012), meaning a decrease in the reliability of the interpolated maps (Camacho-Tamayo et al. 2008). A study in Iran, using decision tree interpolation methods found an 86% accuracy, noting that depending on the soil classification there was a variation in the accuracy of the model (Taghizadeh-Mehrjardi et al. 2014), but other studies had showed validity of interpolated results could be down to 67% (Jafari et al. 2012). Inclusions and the misplacement of boundaries are 2 problems associated with soil mapping which can result in erroneous maps (Qi and Zhu 2003).
The objective of this study was to generate interpolated spatial maps of soil attributes from groups of similarity and difference determines by Cluster Ward analysis, to evaluate an organic soil emendation program to determine both the effectiveness of each treatment and to determine soil condition zones. The soil texture, pH, nitrates (NO3), and organic material (OM), were considered important edaphic parameters to measure considering the specific requirements for blueberry cultivar (Ferreyra et al. 2001). Understanding the conditions of the soil with a spatial map by observing spatial attribute zones helps the producer to have control over soil management. This study also evaluated the usefulness of interpolated maps for small area, precision agriculture.
Materials and methods
Location of study area
The study was carried out in the municipality of Cusihuriachi, Chihuahua, México on a blueberry orchard referred to as “La Finca”, on the property of the “Grupo Norteñita”. It was located at 2202 m.a.s.l., 28.06.53.6 N and 107.03.20.7 W.
Description of superficial area of the study
The total area of the study was 0.88 hectares divided into nine raised-beds. The raised beds were subjected to three different organic soil emendation programs. The first treatment (t1) was gypsum and elemental sulfur at 20 and 10 ton.ha-1, respectively. The second treatment (t2) was t1 plus 60 ton.ha-1 of compost. While the third treatment (t3) was t2 with the addition of 60 t.ha-1 saw dust. The treatments were applied to the raised bed at time of plantation of blueberry cultivar, each raised bed were subjected to all three treatments.
Soil sampling
The sampling was completed on Thursday, August 13, 2015, 75 days after the initial application of the treatments. A total of twenty-four samples were taken from four raised-beds; two samples from each treatment per each raised-bed. The depth of the sample was taken between 0-30 cm and approximately two kg of each sample was collected. Samples were then saved in plastic bags, where they were given the reference number. Each sample point was geo-referenced with a GPS (XT 300, Trimble, USA).
Soil analysis
The soil samples were dried at room temperature a 34 to 40°C. The variables evaluated in soil were clay by the hydrometer method (Medina 2007), NO3 by the Brucine method and spectrophotometry (PerkinElmer Inc.) (Uvalle-Bueno 2000), organic material by Walkley-Black method (Uvalle-Bueno 2000), and pH in dilution 1:2.5 (w/v) in saline 0.01M CaCl2 using potentiometer (AB15, Fisher Scientific, US) (Uvalle-Bueno 2000).
Geo-statistical analysis
The geo-statistical analysis was calculated on SAS/STAT program with cluster Ward to generate groups of similarity, at 0.5 r square partial correlation. The clusters set up the range that was used to classify the spatial groups for each soil attribute.
Cluster interpolated spatial maps were generating using ArcMap module. The spatial dependence of the attributes was analyzed by experimental variograms, and the nugget ratio was used for the classification of the spatial structure of the analyzed attributes (Lillesand et al. 2015). The geostatistical model, inverse distance weighting (IDW) was used for the interpolation on points. The interpolated spatial map of the raised-bed considered 24 points in an area of 0.88 hectares. The clusters found in the geo-statistical analysis Ward were the parameter groups used to define the areas of comparison.
Results and discussion
The resulting spatial maps are the visualization of the geostatistical analysis of four soil attributes: percent of clay in soil, the pH of soil, the amount of NO3 in soil for mg.kg-1and the percentage of organic matter in the soil. These four edaphic parameters are considered paramount for the success of the blueberry cultivar (Eck et al. 1988, Caspersen et al. 2016). The IDW interpolation maps show distinct clusters set by considering the r-squared partial correlation parameters, at 0.5 similarity, and compare the success of each of the three soil emendations treatments at reaching the desired conditions determined ideal for blueberry cultivar.
Percent of clay in soil
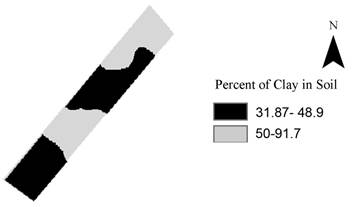
It can be observed in Figure 1 that the 2 distinct groups of percent of clay range from 31 to 48 and 50 to 91percent clay. Although, there are 2 distinct groups, the cluster of 50- 91% clay falls into the soil texture category of clay, while the other cluster was considered either sandy clay, or sandy clay loam. Soils with clay texture are considered difficult to cultivate in because of the array of problems associated with them such as problems with drainage, aeration, and compaction (Navarro-Garcia & Navarro-Garcia 2013). Gypsum does not have the same colloidal potential as clay particles but it forms a residue in soil that is the same particle size as clay, and therefore it can alter the soil texture (Navarro-Garcia and Navarro-Garcia 2013). The blueberry cultivar prefers light soils and have good drainage (Eck et al. 1988, Gou et al. 2012, Burkhardet al. 2009, Caspersen et al. 2016). Heavy soils may be treated with high levels of organic matter, such as compost and saw dust (Burkhard et al. 2009, Caspersen et al. 2016) to try to raise the organic material to more than 15% (Guzman 2007, Valarini et al. 2009), but these studies indicated on making the addition before the plantation of the cultivar.

Figure 1 Spatial map of the percentage of clay in the soil sampled from the raised beds using IDW interpolation method.
pH of soil
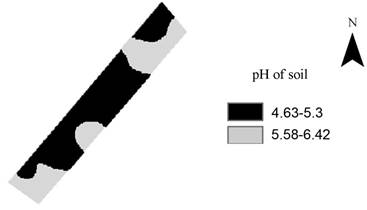
The 2 distinct groups determined for pH from cluster Ward groups were 4.6 to 5.3 and 5.8 to 6.4, Figure 2. The blueberry cultivar prefers a soil pH of 4.3 to 4.8, but may tolerate a pH as high as 5.2 (Eck et al. 1988, Van Breemen et al. 1983, Casperenet al. 2016). Elemental Sulfur and gyspum was added to all three treatments to lower pH (Sierra et al. 2007) but did not successfully lower the pH uniformily, considering there were still clusters which were catogorized as out of the range tolerated by the blueberry cultivar. According to Valarini et al. (2009) compost is not seen to lower pH in soil; in fact their results show an increase in pH with the addition of compost.
NO 3 in soil
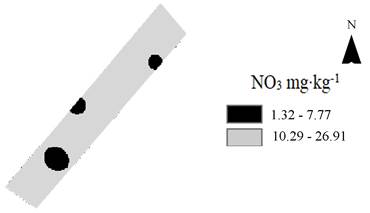
The 2 distinct groups calculated to visualize NO3 in soil from the cluster Ward were 1.32 to 7.77, and 10.29 to 26.91 mg.k-1, Figure 3. It is recommended that the blueberry cultivar needs 20-140 kg.ha-1 a year (Hanson 2006) or 17-26 g of N per plant each year for the first 4 years after plantation (Bryla & Machado 2011). Although 2 different clusters were determined, the spatial maps does show that the distribution of NO3 is very uniform, considering that treatment 1 had no emendation which would have added to the content of N in the soil. It has been found the available nitrogen (N) is increased with the addition of compost (Valarini et al. 2009), but that when added as a top dressing, some of the available nitrogen might be immobilized by microorganisms in the soil (Finn and Warmund 1997). It also has been noted, that the addition of saw dust will not immediately alter the values of N (Sandoval et al. 2012).

Figure 3 Spatial map of NO3 mg.kg-1 in the soil sampled from the raised beds using IDW interpolation method.
Percent of organic matter in the soil
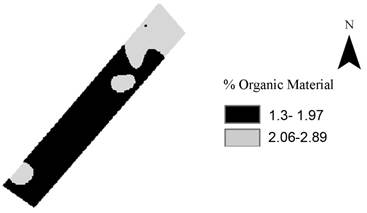
The 2 distinct groups calculated to visualize the percentage of organic material in soil from the cluster Ward were 1.3-1.97% and 2.06- 2.89%, Figure 4. The blueberry cultivar requires a high content of soil organic material, in general higher that 10% (Caspersen et al. 2016), but when grows in heavy soils, such a soils high in the context of clay, that requirement may be as great as 15% (Burkhard et al. 2009, Guzman 2007, Valarini et al. 2009, Echeverria et al. 2009). Although, there are clusters of grouping of organic matter, all samples fall significantly lower than the requirements of the blueberry cultivar. Compost and saw dust added to soil increases the percentage of organic matter in the soil and improves clay soils, physically, chemically and biologically (Navarro-Garcia & Navarro- Garcia 2013, Komilis & Tziouvaras 2009, Burkhard et al. 2009). Studies have indicated that improving organic material percent in soil for more than 10% requires a large investment (Caspersen et al. 2016).
Conclusion
Spatial mapping is a useful tool for the visualization of the results of a geostatistical analysis of soil samples. Maps made from the interpolation of points determined the zones of similar soil which determine the effectiveness of the soil emendation treatments. Considering the edaphic parameters evaluated in this study, soil texture, pH, NO3, and organic matter, none of the treatments modified the soil enough to meet the requirements for the blueberry cultivar. The analysis of the spatial mapping made it apparent, that the majority of planted surface area needs to be emendated to realize the soil conditions required by the blueberry cultivar, and the producer must consider the social and environmental cost and determine if by continuing with the soil management would still meet the criteria determined to be organic crop management.


