Introduction
Echinoids present a rich fossil record since the Mississippian (Early Carboniferous) (Mongiardino-Koch & Thompson, 2021); this is due to the susceptibility to fossilization of their high-magnesium calcite endoskeleton (Kroh, 2020). Currently, the extant biodiversity of this class includes 1 000 valid species around the world, ranging from the shore to the deep sea and from tropical to polar waters (Kroh & Mooi, 2019). The great fossil record of echinoids added to their extant diversity allows us to propose them as models to make paleoecological and paleoenvironmental interpretations and, at simultaneously, can help us predict what will happen with future communities.
According to the World Register of Marine Species (WoRMS, 2023), the genus Agassizia Valenciennes in Agassiz & Desor, 1847 includes 15 extinct and five extant species (Kroh & Mooi, 2022), with a stratigraphic range between the middle Eocene to Recent (Smith & Kroh, 2011), and a distribution in North America, the Caribbean, in West Europe (Portugal, Spain, and France), the Middle East, and the East Pacific. The type species is Agassizia scrobiculata Valenciennes in Agassiz & Desor, 1847.
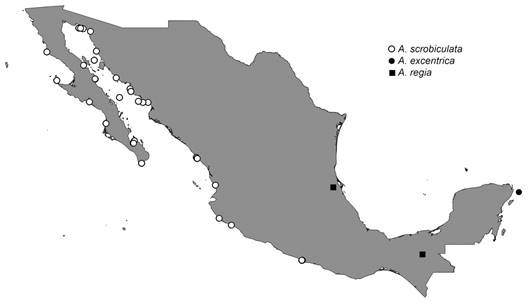
Three species of genus Agassizia have been recorded for Mexico (Fig. 1). The extinct Agassizia regiaIsraelsky, 1924†, that has been reported from the Eocene-Oligocene of Tuxpam Beds, Tampico Region (Israelsky, 1924), and the Miocene of Tulijá, Chiapas (Martínez-Melo, 2019). Two extant species, Agassizia excentricaA. Agassiz, 1869, occurred in Yucatán (Gabino-García et al., 2021), with a depth ranging between 43-900 m, and Agassizia scrobiculata Valenciennes, 1846 in Agassiz & Desor, 1847, has been recorded on the Pacific coast of Mexico, including the eastern coast of the Baja California Peninsula and the Gulf of California, with a depth range from the intertidal to 62 m (Galván-Villa et al., 2018; Maluf, 1988).
The advantage of having large samples of both fossil and extant echinoids is that we can apply a population approach with multivariate statistical methods (McNamara, 1989; Solís-Marín et al., 2013) and explore new statistical dimensions, such as size variability in a population, changes in growth patterns associated with age, and changes in the allometric relationships for body structures (e. g. Caballero-Ochoa et al., 2021; Ciampaglio & D’Orazio, 2007).
Qualitative diagnosis and descriptions make it hard to distinguish morphological boundaries between species, especially in groups with fossils and recent representatives; the dissimilar quality and quantity of the fossil samples increase complexity when analyzing and comparing morphology within a group. This study aims to propose a practical and effective multivariate statistics routine to solve the problems derived from comparing poor paleontological samples with recent samples using two species of genus Agassizia from Mexico as a model.
Materials and methods
Data collection:
Recent and fossil samples: We used fossil specimens collected by Martínez-Melo (2019) and housed in the Colección Nacional de Paleontología, Instituto de Geología, Universidad Nacional Autónoma de México (IGeol, UNAM), Mexico and recent specimens housed in the LEMA-EQ, Echinoderms Collection, Laboratorio de Ecología Molecular, Microbiología y Taxonomía (LEMITAX), Departamento de Ecología, Centro Universitario de Ciencias Biológicas y Agropecuarias, Universidad de Guadalajara (CUCBA-UDG), Mexico.
For the fossils, we included 49 specimens of A. regia† housed in IGeol, catalog numbers IGM 11257 - IGM 11307, from the Tulijá Formation at IGM-loc 3636, El Gato site, near Palenque, northern Chiapas, Mexico (17°29’ N, 92°56’ W) (Fig. 2c). We used a total of 78 recent specimens of A. scrobiculata, housed in CUCBA-UDG; 10 specimens (LEMA EQ-583) collected in San Andrés, Chamela Bay, Jalisco, Mexico (19°31’32” N, 105°05’31” W) (Fig. 2a), in December 2013, at 3 m depth; 68 specimens collected in Punta Santiago, Manzanillo, Colima, Mexico (19° 05’ 58” N, 104° 21’ 11” W) (Fig. 2b), 12 of them collected in February 2016 (LEMA EQ-592), 23 in July 2017 (LEMA EQ-601), and 33 in October 2021 (LEMA EQ-047 and LEMA EQ-086), all specimens were collected between 6 and 8 m depth.
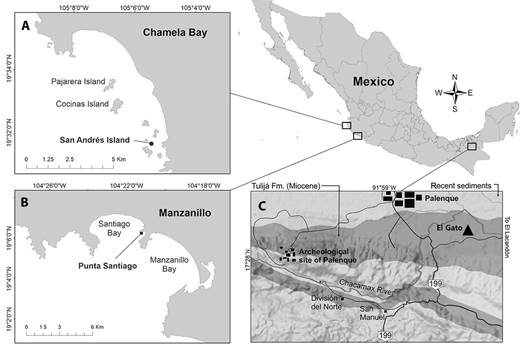
Fig. 2 Sampling sites localization. A) A. scrobiculata from San Andrés Island, Chamela Bay, Jalisco; B) A. scrobiculata from Punta Santiago, Manzanillo, Colima; C) Agassizia regia† in the paleontological site s El Gato, Chiapas.
Measurements: We followed the method used by Martinez-Melo (2019) for measuring recent (A. scrobiculata) and fossil (A. regia†) specimens according to the data reported for A. regia† (Table 5 in Martinez-Melo, 2019). Thirteen measurements per specimen were taken (Fig. 3) using a manual caliper with a precision of 0.05 mm.
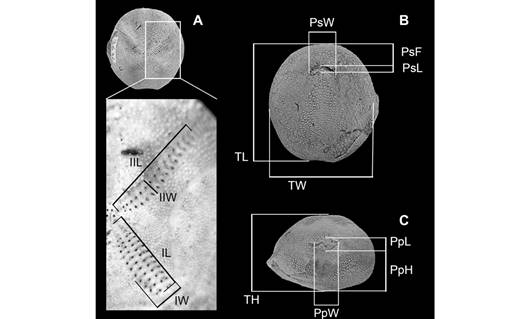
Fig. 3 Measured parameters used in the morphometric analysis of Agassizia. A) Zoom to the ambulacrum region: IL, length of ambulacrum I; IIL, length of ambulacrum II; IW, width of ambulacrum I; IIW, width of ambulacrum II; B) Test in oral view: PsF, distance from the peristome to the anterior margin; PsL, length of the peristome; PsW, width of the peristome; TL, length; TW, width; C) Test in posterior view: PpW, width of the periproct; PpH, height of the periproct, PpL, length of the periproct; and TH, height.
Comparative analysis:
Recovery of missing measurements and discard criteria for statistical evaluation: As with other fossil samples, some of our A. regia† specimens show structural damage in the test that precludes us from taking whole body measurements (Appendix 1). When working with datasets that contain missing values, there methods of treatment exist: 1) Discard any samples or factors with missing values, even if this represents a significant loss of information, 2) Explore statistical tools enable the handling of missing values but assume a significant reduction in the explanatory power of our results, and 3) Use imputation techniques to achieve a complete dataset of data, but being aware of the potential bias associated with the quality of the substituted values (Lin & Tsai, 2020; Stuart et al., 2009).
The Multivariate Imputation by Chained Equations (MICE) is a statistical method widely employed in medical research for treating complex and incomplete datasets, yielding satisfactory outcomes while maintaining original data’s natural tendencies with a few signs of bias (Van Buuren & Groothuis-Oudshoorn, 2011).
Due to A. regia† data set having 35 % missing data, we used the MICE routine to impute the missing values. This was done to prevent significant information loss that would result from discarding incomplete samples (Acuña & Rodríguez, 2004). We used the imputation method by the predictive pairing of means (pmm) with ten imputations and a scalar of ten (maxit), following the criteria recommended by Raghunathan et al. (2001). The data set’s quality was tested graphically, using a xyplot to identify outliers, and numerically, to ensure that the mean difference between the observed and imputed values for each morphometric factor did not exceed two standard deviations (Stuart et al., 2009).
Two samples of A. scrobiculata with missing data were discarded. This decision was supported by the analysis of Acuña & Rodríguez (2004), who discussed how imputing or discarding values for missing data values < 5 % does not significantly affect the results. Caballero-Ochoa et al. (2021) suggest that differences in sample population sizes can lead to errors in interpreting allometric comparisons. To prevent bias, we excluded 32 samples of A. scrobiculata with sizes smaller than the inferior size range of A. regia† (TL < 15.6 mm). The statistical analysis included a total of 93 specimens, 49 of A. regia† and 44 of A. scrobiculata (Appendix 1).
Descriptive morphometry and degree of dissimilarity between species: For the quantitative evaluation, we combined three multivariate statistical methods. To prove morphological differences between both species, we used a permutational multivariable analysis of variance (PERMANOVA) with fixed effects, constructed using the factor species (Sp) as follows: Y= μ + Spi + εi. Additionally, we conducted a similarity percentage analysis (SIMPER) to identify the main morphometric factors contributing to the dissimilarity between the species. Principal Component Analysis (PCA) was used to prove or discard the separation between recent and fossil samples, and to identify the most effective set of morphometric factors that account for this differentiation. The statistical software used for the PERMANOVA and SIMPER analysis was Primer-e® v.6, while the PCA graph was generated using CANOCO v.4.5. All analysis used a Euclidean distance matrix with measurement data previously transformed using the fourth root and 10 000 permutations to demonstrate statistical significance (Clarke & Gorley, 2005; Ter Braak & Smilauer, 2002; Zar, 1999).
To visually compare the morphology of the two species, we constructed a box-and-whisker plot with the values for each morphological factor. The box-and-whisker plot shows the minimum, maximum, and mean values with the standard deviation for each morphological factor.
Systematics
Class Echinoidea Leske, 1778
Order Spatangoida L. Agassiz, 1840
Family Prenasteridae Lambert, 1905
Genus Agassizia Valenciennes, 1846
Type species- Agassizia scrobiculata Valenciennes in Agassiz & Desor, 1847: 20.
Stratigraphic range- Middle Eocene to Recent (Smith & Kroh, 2011).
Modern distribution in Mexico- On the Pacific coast of northern Mexico, including the eastern coast of the Baja California Peninsula and the Gulf of California (Martínez-Melo et al., 2015).
Agassizia scrobiculata Valenciennes in Agassiz & Desor, 1846-1847: 20.
Agassizia scrobiculata Valenciennes in Agassiz & Desor, 1846-1847: 20. Agassizia subrotundaGray, 1851: 133. Agassizia ovulumLütken, 1864: 134.
Type specimens- Syntypes MNHN-IE-2013-10543 and MNHN-IE-2013-10544.
Distribution- From Baja California Mexico to Capón, Peru; including the Gulf of California and the Galapagos Islands (Galván-Villa et al., 2018). The bathymetric distribution ranges from the intertidal to 62 m depth (Maluf, 1988).
Referred specimens- 78 specimens, LEMA EQ-047, LEMA EQ-086, LEMA EQ-583, LEMA EQ-592, LEMA EQ-601.
Locality- San Andrés Island, Chamela Bay, Jalisco and Punta Santiago, Manzanillo, Colima, Mexico (Fig. 2a & 2b).
Habitat- San Andrés is a small island of 7.15 ha, located between the Cuitzmala River and the San Nicolás River. It is part of a coastal archipelago within the Chamela Bay Marine Protected Area, Jalisco, Mexico (Comisión Nacional de Áreas Naturales Protegidas (CONANP), 2008). According to CONANP (2008) and Ríos-Jara et al. (2013), Chamela Bay is a coastal system with a mixed rocky and sandy substrate, ranging from 10 to 25 m in depth. The sea surface temperature (SST) oscillates between 20 and 30 °C, and the salinity ranges from 34 to 35 during cold-dry and warm-rainy seasons, respectively. The average rainfall is 748 mm. The ecosystem supports a high biodiversity, including plankton, corals of the genera Porites, Pavona, and Pocillopora, over one hundred species of Chondrichthyes and bony fishes, and diverse invertebrates of the phyla Mollusca, Arthropoda, Cnidaria, Annelida, Porifera, and Echinodermata. During the sampling work conducted in December 2013, the sea surface temperature (SST) showed a value of 27°C.
Sotelo-Casas et al. (2019) reported an SST range of 21.3 and 31.8 °C for Punta Santiago, Manzanillo bays. The authors described the locality as a coastal system with a mixed sandy and rocky substrate, and a seasonal influx of runoff sediments from Juluapan’s Lagoon. During our sampling work in Punta Santiago, we recorded the following environmental parameters: SST of 30.2 °C, dissolved oxygen concentration of 24.7 %, salinity of 33 ppt, and organic matter content in the sediments of 0.86 %. Additionally, granulometric characterization revealed a predominance of medium sand (Table 1).
Table 1 Grain size distribution of sediment in Punta Santiago, Manzanillo, Colima.
| Diameter (phi) | Percentage (%) | Size class | |
| Coarse texture | -2 | 4.86 | Very coarse sand |
| -1 | 28.816 | Coarse sand | |
| 0 | 40.411 | Medium sand | |
| 1 | 17.511 | Fine sand | |
| 2 | 7.422 | Very fine sand | |
| 3 | 0.977 | Very coarse silt | |
| Fine texture | 4 | 0.001 | Very fine sand |
| 5 | 0 | Very coarse silt | |
| 6 | 0.001 | Coarse silt | |
| 7 | 0 | Medium silt | |
| 8 | 0.001 | Fine silt | |
| 9 | 0 | Very fine silt |
Description (Tapia-Ramírez, 2012) -Test slightly oval, posterior side truncate, anterior side slightly wider than the posterior region. Apical system ethmolytic, with four gonopores. Anterior ambulacra long, reaching the ambitus. Posterior ambulacra petaloid, short and wide. The single anterior ambulacrum without pores, slightly sunken and elongated, reaches the frontal ambitus. Periproct on the posterior side, oval, wider than long. Peristome reniform with prominent labrum. Plastron wide, covered by small tubercles, wider on the posterior region. Peripetal fasciole forming obtuse angles between the ambulacra, except at the front ambulacrum, where it joins the latero-anal fasciole, which forms a “v” below the periproct. Test with abundant tubercles, being more evident on the anterior region.
Agassizia regiaIsraelsky, 1924
Agassizia cleveiCotteau, 1875 pl. 7, Figs 1a, 1b. Agassizia regiaIsraelsky, 1924, p. 142.
Type specimens- Holotype CAS-IG 363 from Eocene-Oligocene, Tuxpam Beds, Tampico Region, Mexico.
Geographical and time record- Reported from the Eocene-Oligocene, Tuxpam Beds, Tampico Region, Mexico (Israelsky, 1924).
Referred specimens- 49 specimens, IGM 11257 through IGM 11307.
Locality and age-Specimens discussed herein were collected from the Tulijá Formation at IGM-loc 3636, El Gato site, near Palenque, northern Chiapas, Mexico (Fig. 2c).
Habitat- The Tulijá Formation is a calcareous sequence of strata clays ranging from 30 to 150 cm in thickness. It is exposed along the Tulijá River and extenders to Palenque. The formation contains high abundance of invertebrate fossils, including foraminifera, ostracods, gastropods, ostreid, bivalves, echinoderms, corals, portunid crabs, tubes of polychaete worms, and sponges, which are so numerous that they form embedded coquinas. The fossil assemblage also includes vertebrate remains, such as shark, ray, and teleostean fish teeth, fish scales, pycnodonts, serranids, percomorphs, and other fish bones, as well as sirenid bones. These extensive fossil records suggest that during the early Miocene, the Tulijá Formation sediments were deposited in a marine environment near the shore, under shallow and high-energy conditions that may have included transgressive and regressive episodes along the inner platform and/or coastal lagoons (Alvarado-Ortega et al., 2018; Martínez-Ortiz et al., 2017; Meneses-Rocha, 2001; Riquelme et al., 2012; Velasquillo-García, 2011).
Description- Small (length 16-27 mm) almost spherical test (width 13-23 mm and height 13-20 mm), more rounded anteriorly than posteriorly, slightly flat near the periproct. Apex slightly posterior, at the apical system, which has four genital pores. Anterior ambulacrum (III) non-petaloid, in slight furrow, with no visible pores. Ambulacra petaloid, II and IV divergent at 120°, petals almost reaching the ambitus; anterior series of pore pairs atrophied, the posterior row with conspicuous pairs of elongated pores. Anterior paired petals depressed, posterior petals short, more depressed than anterior pair, width about one-third the length. Petals I and V 2/3 the length of the anterior pair of petals, lacking interporiferous zones. Periproct high on the posterior the test, horizontally ovate. Peripetalous fasciole unindented in the interporiferous area, extends below the anterior petals; latero-anal fasciole extends from below the periproct upward to point of juncture with peripetalous fasciole, then downward anteriorly to below ambitus in anterior ambulacrum. Oral surface more swollen at the interambulacral 5. Plastron strongly elevated, ornamented with closely spaced scaly tubercles. Peristome reniform, extremely anterior, at 17 % of the length, labiate posteriorly.
Size and morphological references for the Agassizia genus: The average measurements and the minimum and maximum range of sizes were included in Appendix 2. Agassizia scrobiculata had a smaller average size than A. regia†. Thirty-three samples of A. scrobiculats were smaller than the smallest specimen of A. regia†. Fig. 4 showed a visual comparison between fossil species A. regia† and recent species A. scrobiculata.
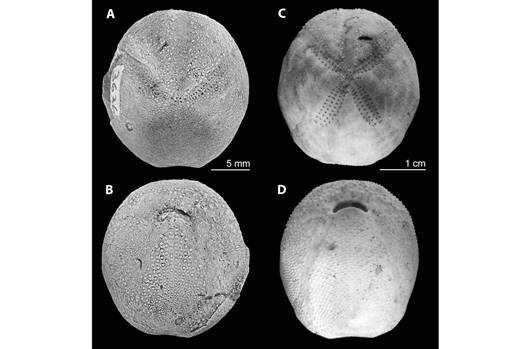
Fig. 4 A morphological comparison between fossil species A. regia† (A: test in apical view, B: test in oral view) and recent species A. scrobiculata (C: test in apical view, D: test in oral view).
Morphometric analysis on genus Agassizia: The Multivariate Imputation by Chained Equations (MICE) generated 209 imputed values for A. regia†. The xyplot does not indicate the presence of outliers (Fig. 5), and only 4.8 % (n = 10) of the imputed values differed from the mean of the observed values by more than two standard deviations. Therefore, we deemed the quality of the imputed data adequate for analysis.
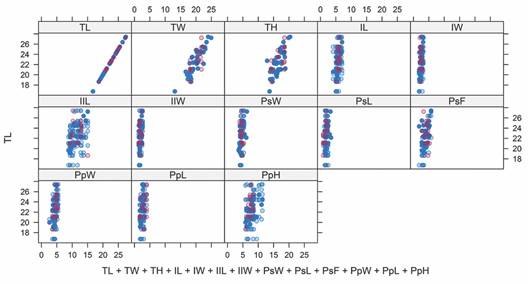
Fig. 5 The xyplot shows the values of the morphometric measurements for A. regia†. The blue circles represent the original values, and the pink circles represent the imputed data: TL, length; TW, width; TH, height; IL, length of ambulacrum I; IW, width of ambulacrum I; IIL, length of ambulacrum II; IIW, width of ambulacrum II; PsW, width of the peristome; PsL, length of the peristome; PsF, distance from the peristome to the anterior margin; PpW, width of the periproct; PpL, length of the periproct; and PpH, height of the periproct.
The PERMANOVA test revealed significant differences between morphometric values of A. regia† and A. scrobiculata (Peudo-F = 6.9196, P = 0.0003). The SIMPER test (cut-off of 50 %) identified PsF, PsL, IIL, PpL, and TL as the morphological values that most contributed to the differences between species (Table 2).
Table 2 The average dissimilarity between morphometric factors was computed by the SIMPER test for A. regia† and A. scrobiculata.
| Species | Contribution % | Cumulative contribution % |
| PsF | 13.17 | 13.17 |
| PsL | 12.22 | 25.39 |
| IIL | 10.66 | 36.05 |
| PpL | 8.62 | 44.67 |
| TL | 7.73 | 52.40 |
The box-and-whisker plot shows that, on average, the samples of the A. regia† species samples were larger in size. Specifically, they had higher values for TL, TW, TH, IL, IW, IIW, PpW, and PpH (Fig. 6). Conversely, A. scrobiculata had the larger sizes for IIL, PsW, PsL, PsF, and PpL.
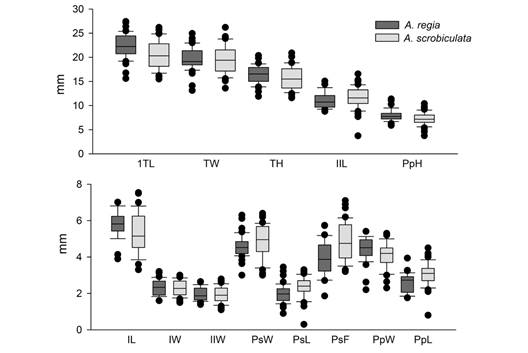
Fig. 6 Box-and-whisker plot for the morphological factors. The plot shows the mean, standard deviation, and outliers for each factor. Dark gray represents the values of A. regia† and light gray values of A. scrobiculata: TL, length; TW, width; TH, height; IL, length of ambulacrum I; IW, width of ambulacrum I; IIL, length of ambulacrum II; IIW, width of ambulacrum II; PsW, width of the peristome; PsL, length of the peristome; PsF, distance from the peristome to the anterior margin; PpW, width of the periproct; PpL, length of the periproct; and PpH, height of the periproct.
The Principal Component Analysis (PCA) indicated a clear separation between the populations of A. regia† and A. scrobiculata (Fig. 7). The maximum body size (TL, TH, TW) did not consistently differentiate between the two species. However, the measurements associated with the length (PsL, PsF) and width (PsW) of the peristome, and the length (PpL) of the periproct, as well as the length of the ambulacrum II (IIL) were significantly shorter in the A. regia† samples.
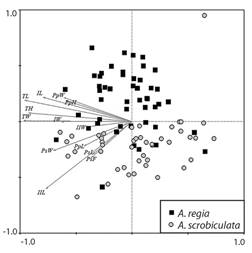
Fig. 7 Principal Component Analysis (PCA) plots of morphological factors for Agassizia; black squares represent the samples of Agassizia regia†, and gray circles represent the samples of A. scrobiculata: TL, length; TW, width; TH, height; IL, length of ambulacrum I; IW, width of ambulacrum I; IIL, length of ambulacrum II; IIW, width of ambulacrum II; PsW, width of the peristome; PsL, length of the peristome; PsF, distance from the peristome to the anterior margin; PpW, width of the periproct; PpL, length of the periproct; PpH, height of the periproct.
It is evident that the morphometric characters of the peristome (PsL, PsF, and PsW), and the length of the periproct (PpL) were larger in A. scrobiculata samples (Fig. 6). Despite A. scrobiculata having smaller specimens on average, the peristome and periproct of A. regia† is proportionally larger. The morphological difference is evident in the arrangement of the samples in the PCA plot (Fig. 7), where the samples with smaller peristome and periproct (A. regia†) are distinct from the species with the larger oral and anal structures (A. scrobiculata) through a vertical gradient.
When comparing the length of ambulacra I and II, it was observed that individuals of A. regia† have a smaller ambulacrum I (IL of A. regia† < IL of A. scrobiculata). Conversely, in ambulacrum II the relationship is inverted (IIL of A. regia† > IIL of A. scrobiculata; Fig. 6 and Fig. 7). This morphological difference appears to be related to a variation in the position of the apical system in each species, with A. scrobiculata having a more anterior position (Fig. 4).
Discussion
The representation of irregular sea urchins in the fossil record tends to be higher than that of regular echinoids (Greenstein, 1993). This is attributed mainly to the ecology developed by both forms and taphonomic processes related to their preservation (Greenstein, 1993; Kier, 1977; Mancosu & Nebelsick, 2019; Nebelsick, 1996; Smith, 1984). In general, irregular echinoids feed on organic matter deposited in sediments, so they remain primarily buried in soft substrates (Nebelsick, 1996), while regular sea urchins are mainly herbivorous organisms that inhabit rocky substrates (Steneck, 2020). The significant representation of irregular echinoids in the fossil record makes it possible to have population samples of some species, as is the case of A. regia† in our study. Population datasets open the possibility of implementing new quantitative comparisons using multivariate statistical methods.
An obstacle to using multivariate statistics on fossil data is the loss of anatomical structures during the fossilization process and the consequent loss of measurements in the data sets (Clarke & Gorley, 2005; Stuart et al., 2009; Zar, 1999). The use of the multivariate statistical method in the descriptive taxonomy of echinoderms is not new. During the last two decades, their use has increased since they are helpful tools to solve taxonomic determinations that classical and genetic methods cannot resolve alone. For example, Coppard & Campbell (2006) applied multivariate statistics to explore morphological differences within the genera Diadema and Echinothrix, and Deli et al. (2019) used these tools to compare populations of Arbacia lixula along the African Mediterranean coast. Multivariate statistics have also been used in morphological analyses with other fossil groups (Lefebvre et al., 2006), and in irregular echinoids (Stara et al., 2023), however performing the MICE routine to recover missing values from damaged specimens is a novel and a complementary alternative. In our study, data recovery using the MICE routine allowed us to work with multivariate statistical tests that do not admit missing data, and avoided the loss of information associated to discard of incomplete data series.
The PERMANOVA analysis confirmed the morphometric differences between A. regia† and A. scrobiculata. The box-and-whisker plot (Fig. 6) showed that morphological factors related to the total size of the test (TL, TH, TW), as well as the width of ambulacra (IW, IIW), the width (PpW), and the height (PpH) of the periproct, and the length of ambulacrum I (IL), being higher in A. regia†. These differences show that despite a priori discarding A. scrobiculata samples with sizes smaller than the lower range of A. regia† (TL < 15.6 mm), on average A. scrobiculata specimens are smaller. However, in the PCA plot, we show that these differences between both species are insufficient to recognize two groups through a size gradient.
During the process of statistical analysis, the smaller average size for A. scrobiculata was evident. This is because more small samples were collected in the field, in contrast with samples with major size in the fossil record of A. regia†. Both species presented a similar range of maximum size (Appendix 2). Further studies would be necessary to explain the absence of small-sized A. regia† in the fossil record.
According to the SIMPER analysis, the differences between the length of the peristome (PsF & PsL), the length of the ambulacrum II (IIL), and the length of the periproct (PpL) are those that contribute the most to explaining the dissimilarity between species (Table 2). The results of these three multivariate tools are consistent, so we can conclude that the differences in the size of the periproct and peristome, as well as in the length of the ambulacra and the position of the apical system, can be used as diagnostic criteria to distinguish these two species within the genus. An extensive and comparative review with population samples of all species would be necessary to know if these diagnostic characters can be extended to all members of the genus Agassizia.
Previous descriptions for the genus Agassizia (Valenciennes in Agassiz & Desor, 1847), A. regia† (Israelsky, 1924; Martínez-Melo, 2019), and A. scrobiculata (Gray, 1851; Mortensen, 1951; Lütken, 1864; Tapia-Ramírez, 2012) show how these morphometric differences had not been identified as a descriptive character. This omission seems to be due precisely to the fact that traditional taxonomy does not always contemplate the quantitative comparison of the specimens, nor are statistical methods explored to evaluate the differences between the possible diagnostic characters. By recognizing the morphometric differences between these two species from qualitative and multivariate analysis, we tested the effectiveness and the relevance of incorporating this type of technique in future descriptive methodologies.
The qualitative descriptions of the species in taxonomic reports are always necessary; nevertheless, those could be non-resolutive when identifying diagnostic characters for species within a genus. Applying multivariate analysis to morphometric data provides an objective and complementary way to revise diagnostic characters, supporting descriptive information with numeric data. Proposing a routine to impute missing data and perform multivariate analysis offers several benefits. The absence of data caused by poorly preserved fossil specimens does not distort the natural patterns of real data. Additionally, it allows for working with populations instead of just individual specimens and reinforces the recognition of morphological patterns. Currently, taxonomists and systematists have started to integrate novel types of analysis to solve complex classification problems (e.g., Dos Santos-Alitto et al., 2019; Humara-Gil et al., 2022; Nethupul et al., 2022), mainly including macro and micromorphology and DNA sequences. As recovering DNA information from fossil records is practically impossible, analyzing qualitative and quantitative morphological information can offer a new data dimension for integrative taxonomy.
Ethical statement: the authors declare that they all agree with this publication and made significant contributions; that there is no conflict of interest of any kind; and that we followed all pertinent ethical and legal procedures and requirements. All financial sources are fully and clearly stated in the acknowledgments section. A signed document has been filed in the journal archives.
See supplementary material


 uBio
uBio 

