


 English (pdf)
 Article in xml format
 Article references
 Send this article by e-mail
 Cited by SciELO
  Similars in
SciELO
Similars in
SciELO  uBio
uBio 
 Permalink
Introduction
Aedes (Fredwardsius) vittatus (Diptera: Culicidae) (Bigot 1861) was characterized based on phenotypic features of adults (N = 86), larvae (N = 41), and pupae (N = 29). It is distinguished within the Aedes genus by several synapomorphies. These include a dark proboscis with a median scattering of pale yellowish scales, bilateral small patches of narrow white scales on the clypeus, three pairs of distinct, small, white spots of narrow scales on the anterior two-thirds of the scutum, a relatively short maxillary palpus with a white-scaled apical portion, and a white spot at the mid-point of tibia III (in anterior view) (Bigot, 1861; Huang, 1977; Pagac et al., 2021; Reinert, 2000). However, it is currently recognized that A. vittatus has a widespread distribution in the tropical regions of Africa and Asia, with some known occurrences in the Mediterranean region of Europe, including France, Italy, Portugal, and Spain, primarily due to favorable climate conditions (Díez-Fernández et al., 2018; Sudeep & Shil, 2017). Similarly, this species has recently been identified in Cuba and the Dominican Republic (tropical region of America) (Alarcón-Elbal et al., 2020; Pagac et al., 2021; Pérez-Menzies et al., 2022).
The invasion of A. vittatus, as well as other species within the same genus such as Aedes aegypti and Aedes albopictus, into new locations is often linked to passive transport facilitated by large-scale anthropogenic activities, such as transcontinental trade (Brown et al., 2011; Medlock et al., 2012; Scholte et al., 2008), as well as local vehicular transport, including both public and private land cargo (Eritja et al., 2017; Guagliardo et al., 2014). In particular, it has been proposed that tire transport could be a significant mechanism for the large-scale spread of A. vittatus (Díaz-Martínez et al., 2021). This is due to the remarkable tolerance of Aedes and other culicid eggs to desiccation, allowing them to remain viable at extreme temperatures for extended periods. This allows them to preserve their characteristics over extensive distances or throughout various times of the year until conditions become optimal for hatching and subsequent development (Diniz et al., 2017). Furthermore, their small size poses challenges in identification and, consequently, in vector control.
Overall, this mosquito is hematophagous, with females feeding on the blood of goats, cattle, humans, and sheep (Chepkorir et al., 2018). It exhibits ecological plasticity by breeding in various habitats, including rock pools, artificial containers, tree holes, puddles, and fresh fruit peels. It is found in forests, savannas, and arid lands, displaying both sylvatic and peri-domestic behavior (Ali et al., 2014; Diallo et al., 2012a; Obi et al., 2022; Suganthi et al., 2014). The presence and distribution of this mosquito in these microhabitats are primarily influenced by climate factors. Below 10 °C, conditions are unfavorable for its biological development; between 11 and 14 °C, only a few individuals can survive, and egg and larva mortality increases. However, between 24 and 27 °C, with humidity levels above 75 %, 75 % to 89 % of the eggs hatch. Remarkably, it exhibits thermophilic characteristics, as evidenced by preimaginal development occurring between 36 and 45 °C, and it displays good tolerance to desiccation (McClelland & Green, 1970; Roberts, 2004; Service, 1970).
Additionally, A. vittatus plays a crucial role in transmitting yellow fever in rural areas of tropical Africa (Bueno-Marí & Jiménez-Peydró, 2010). It also possesses vector competence for dengue (Angel & Joshi, 2008), chikungunya (Diallo et al., 1999) and Zika (Diallo et al., 2014). Similarly, A. vittatus has the vectorial capacity to transmit arboviruses like Japanese encephalitis, West Nile virus, Chandipura, and Chittoor (Sudeep et al., 2020). The diseases transmitted by species of the Aedes genus, including those mentioned earlier, have raised significant concerns in global public health due to the lack of effective vaccines for most arboviruses, with a few exceptions that have shown limited effectiveness, such as the dengue vaccine (Carvalho & Long, 2021; Girard et al., 2020).
Traditional mosquito vector control methods include the use of chemical products, primarily insecticides, and biological products (Baldacchino et al., 2015; Wilson et al., 2020). Biological methods now encompass releasing mosquito populations infected with Wolbachia sp. to render natural populations refractory to the arboviruses they transmit (Caputo et al., 2019; O’Neill, 2018), or using transgenic mosquitoes to suppress populations and interrupt the vector transmission cycles (Bellini et al., 2013; Carvalho et al., 2015). Nevertheless, these efforts primarily target A. aegypti and A. albopictus, which are global vectors responsible for the transmission of diseases such as dengue, Zika, and chikungunya (Weeratunga et al., 2017). In the Americas, these diseases are primarily transmitted by A. aegypti (Kotsakiozi et al., 2017) and occasionally by A. albopictus, which has evidenced possible vertical transmission of Zika, yellow fever, and dengue by this mosquito (Alencar et al., 2021; Martins et al., 2012; Rúa-Uribe et al., 2012). If populations of A. aegypti or A. albopictus were controlled, A. vittatus could become a significant vector for these diseases.
Currently, research on A. vittatus primarily centers on its vector competence for specific arboviruses in Africa (Diallo et al., 2014; Mulwa et al., 2018) and Asia (Angel & Joshi, 2008; Sudeep et al., 2020). There is limited and outdated research on its biology and ecology, primarily conducted in the same regions (Roberts, 2001; Roberts, 2004; Service, 1970). Furthermore, there are reports of its presence in Europe (Bueno-Marí & Jiménez-Peydró, 2010; Eritja et al., 2018), and it has recently become established in the Americas. Additionally, population genetic analysis is being conducted to understand the origin of the A. vittatus invasion in the Caribbean (Alarcón-Elbal et al., 2020; Pagac et al., 2021). Hence, it is crucial to track potential new sites of invasion by this species, as it could complicate the epidemiological landscape in public health.
Ecological niche modeling (ENM) serves as a prediction tool for identifying areas globally with suitable environmental conditions for A. vittatus. This tool uses species presence records and layers of bioclimatic variables, employing a mathematical algorithm to identify geographic areas where the species could potentially invade. This, in turn, helps identify potential locations for arbovirus transmission (Carvalho et al., 2017; Peterson et al., 2011). For instance, this method has been employed to predict the potential distribution areas of significant mosquitoes in public health, both globally, such A. aegypti and A. albopictus (Kamal et al., 2018) and locally, including Culex pipiens pallens (a primary vector of lymphatic filariasis and Japanese encephalitis) and Culex pipiens quinquefasciatus (a primary vector of West Nile fever and lymphatic filariasis) (Chandel et al., 2013; Cui et al., 2013; Liu et al., 2020).
Disease-vector mosquitoes are influenced by climatic variables such as temperature and humidity, as they exhibit positive responses to environmental conditions. For instance, A. aegypti and A. albopictus thrive in temperatures between 20 and 32 °C. Conversely, they exhibit negative responses to temperatures exceeding 39 °C or falling below 16 °C, which extends their life cycle (Ezeakacha & Yee, 2019; Marinho et al., 2016). These factors significantly affect their survival, bite rates, and distribution, consequently impacting the transmission of diseases, either positively or negatively (da Cruz-Ferreira et al., 2017).
One approach to predict the impact of climate change on mosquito distribution is to use prediction models, such as the Shared Socioeconomic Pathways (SSP), which estimate future concentrations of greenhouse gases, including CO2. These include SSP245, SSP370, and SSP585, which can help identify potential future invasion areas by considering the impact of climate change under these scenarios (O’Neill et al., 2017; Riahi et al., 2017).
A. vittatus, along with other vectors, has been the subject of niche modeling studies for chikungunya virus vectors in southeast Senegal’s Kedougou region (Richman et al., 2018), potential distribution of Aedes genus species in Nigeria (Omar et al., 2021), and arbovirus vectors in Morocco (Abdelkrim et al., 2021). Recently, a global study, which included three mosquito species, including A. vittatus, estimated their potential global distribution under current and future climate conditions (Abdelkrim et al., 2022). However, the study did not account for the vector’s ecological characteristics in currently registered zones. Additionally, unlike other mosquito species (Echeverry-Cárdenas et al., 2021; Kamal et al., 2018), the present study did not use the native area for calibration model. Since the native origin of A. vittatus remains unknown, calibration of the accessible area relied on available genetic information. Furthermore, estimations were conducted using new models and climate change scenarios (CMIP6) (Eyring et al., 2016).
Hence, understanding the characteristics of its habitats and identifying potential invasion areas, both current and future in the context of climate change, is essential. This knowledge will help assess its potential global epidemiological impact and enable the inclusion of this vector in surveillance and control strategies for local transmission scenarios. Therefore, our objective was to describe the ecology of the new vector, A. vittatus (Diptera: Culicidae), based on occurrence records and estimate its global invasion potential under two hypothetical origins, Asia, and Africa, for both the present and the future.
Materials and methods
Study area: This global study identified A. vittatus in tropical Africa, tropical Asia, the western Mediterranean region of Europe, and recently, in some Caribbean islands (Alarcón-Elbal et al., 2020; Bueno-Marí & Jiménez-Peydró, 2010; Díaz-Martínez et al., 2021; Pérez-Menzies et al., 2022; Sudeep & Shil, 2017).
Bibliographic review: We conducted a systematic search for scientific articles reporting the first records of A. vittatus at the country level. We used the following databases to identify its geographical presence: Scopus (https://www.scopus.com/), PubMed (https://pubmed.ncbi.nlm.nih.gov/), Springer link (https://link.springer.com/), Science direct (https://www.sciencedirect.com/), Google Scholar (https://scholar.google.es/) and Google (www.google.com). Google was employed to gather non-scientific information, such as news, notes, and reports. In each of the databases, keywords were used, like “Aedes vittatus”, followed by the Boolean operator “AND” and “first registry” and the Boolean operator “OR” and “registries”. To broaden the dataset of vector occurrences, we used the keyword “Aedes vittatus” for the general search of vector registries. We reviewed titles and abstracts from the search results and selected only those that met the criteria, such as the first registry in a country or the presence of the vector in a specific site. The search in each database covered all dates in English, Spanish, and Portuguese.
Registries of presence of Aedes vittatus: We created a dataset from the results of the previous section and data obtained from the Global Biodiversity Information Facility (GBIF, 2021; https://www.gbif.org/). This dataset was used to create a table containing all the first registries and records reported in scientific articles for A. vittatus in each country. The table includes relevant information such as the continent, year of the registry, and reference. In addition, georeferencing of this dataset served as the foundation for estimating the global geographic distribution and potential invasion of A. vittatus (further details in the ‘Estimation of the Geographic Distribution’ section). Data lacking georeferencing information were excluded from this study.
Additionally, this dataset was cleaned to remove duplicate entries and address geospatial issues (Kamal et al., 2018; Kraemer et al., 2015). To achieve this, we used the R Studio environment (R CoreTeam 2017) along with the sp 1.4-1 (Pebesma et al., 2020), raster 3.4-5 (Hijmans et al., 2020a), and dismo 1.3-3 (Hijmans et al., 2020b) packages. Due to the absence of data regarding the native area of A. vittatus, we relied on existing genetic evidence from the COI gene. This evidence, as presented in the haplotype network suggested by Pagac et al. (2021), primarily links most of the analyzed populations to Africa (6 haplotypes) and Asia (21 haplotypes). Haplotype networks help propose the geographic origin or ancestral lineage of species using molecular markers (Leigh & Bryant, 2015). Two scenarios were evaluated, one assuming the native area of A. vittatus is in Africa, and the other in Asia. Under the African origin hypothesis, the occurrence dataset was divided into two subgroups: A, which included occurrences from Africa used for calibration, and B, containing occurrences from the rest of the world for validation. Similarly, under the Asian origin hypothesis, subgroups C and D were formed, with C including Asian occurrences used for calibration, and D containing occurrences from the rest of the world for validation.
Ecological niche modeling and estimation of the accessible area: To predict the potential invasion of A. vittatus under current and future conditions, we employed the maximum entropy algorithm implemented in MaxEnt v3.4.3 software (Phillips et al., 2021). This allows us to assess the influence of environmental variables in the estimations and calibrate models using datasets of various sizes. Additionally, it is suitable for predictions at both temporal and spatial scales (Peterson et al., 2011; Phillips et al., 2006). To calibrate the ENM, we defined the accessible area (M) of the species, including its occurrence records in both continents, Africa, and Asia, following the approach outlined by Barve et al. (2011). This involved implementing a convex minimal polygon that covered a significant portion of the species’ distribution area, as per Rochlin et al. (2013). Similarly, 10 000 random background points were placed within each accessible area for model calibration (Peterson et al., 2011). For each continent, we employed two modeling methods: spatial modeling, projecting ideal current environmental conditions for A. vittatus invasion worldwide, and spatial-temporal modeling, suggesting potential vector invasion on a global scale considering the effects of climate change.
Climate data and ecological characterization: To estimate the current geographic distribution, we used bioclimatic data from WorldClim v2.1 (https://www.worldclim.org/), encompassing 19 bioclimatic variables collected from global weather stations (Fick & Hijmans, 2017). The data had a spatial resolution of 2.5 min, approximately 5 km² (Kamal et al., 2018; Kraemer et al., 2015; Medley, 2010). These variables underwent a Variance Inflation Factor (VIF) analysis in R Studio using the raster 3.4-5 (Hijmans et al., 2020a), rgdal 1.5-23 (Bivand et al., 2021), and usdm 1.1-18 (Naimi, 2017) packages to reduce multicollinearity (Pradhan, 2016). The resulting variable layers were then used to estimate the species potential invasion under current and future conditions.
To estimate the future invasion of A. vittatus in the context of climate change, we used the selected variables from WorldClim v2.1 under the SSP245, SSP370, and SSP585 scenarios for the periods 2041-2060 and 2081-2100. This was performed using Global Circulation Models (GCMs), as they offer a flexible and robust framework to evaluate the statistical significance and importance of variables, providing a straightforward and solid interpretation of the model (Flato et al., 2013; Guisan et al., 2002; Marengo et al., 2014). We used the following models: GISS‒E2‒1‒H, MIROC‒ES2L, MPI‒ESM1‒2‒HR, MRI‒ESM2‒0 (Hausfather et al., 2022), IPSL‒CM6A‒LR, and UKESM1‒0‒LL (Flynn & Mauritsen, 2020). These models were selected based on their values of ECS (2.5-4 °C) and TCR (1.4-2.2 °C) to represent different climate sensitivities. All selected variable layers were adjusted to match the defined accessible area (M) and were used to construct invasion scenarios for the specified climate change periods.
To characterize the habitats where A. vittatus is currently found, we extracted temperature (mean, standard deviation, minimum, and maximum) and precipitation (mean, standard deviation, minimum, and maximum) data from the WorldClim v2.1 dataset (https://www.worldclim.org/). These variables are crucial for understanding the mosquito vectors’ life cycle (Echeverry-Cárdenas et al., 2021; Leyton et al., 2020; Valencia-Marín et al., 2020). We obtained and extracted elevation data from WorldClim v2.1 (https://www.worldclim.org/) and land coverage data from Diva-gis (https://www.diva-gis.org/). We determined the type of urbanization through visual exploration of occurrences using QGIS v3.16 with the available Google Hybrid layer. Urban occurrences were classified as those located within urban areas, while those in urbanization perimeters or immediate vicinity were considered peri-urban areas. Occurrences without human establishments nearby were categorized as rural areas. Additionally, we obtained sea route data (Benden, 2022) and overlaid it on the current invasion potential to assess the potential influence of transcontinental freight transportation routes on the species’ spread.
Estimation of the geographic distribution: To estimate the potential geographic distribution of A. vittatus, we considered four contexts that accounted for latitudinal and longitudinal variations. For model calibration, we used subgroups A and C with environmental variable layers under current conditions confined to accessible areas. Subsequently, we estimated the potential effects of climate change in areas of potential A. vittatus invasion for the periods 2041-2060 and 2081-2100 under the SSP245, SSP370, and SSP585 emission pathways for each respective period.
We conducted all estimations using the maximum entropy algorithm in MaxEnt software v.3.4.3 (Phillips et al., 2021). Each estimation consisted of ten replicates with 1 000 iterations, using the logistic output format. Parameters ‘Do Clamping’ and ‘Extrapolation’ were deactivated for current and future estimations to prevent ecological variable extrapolations (non-analogous climates) (Echeverry-Cárdenas et al., 2021; Kamal et al., 2018). To represent each emission scenario under future conditions, we calculated the mean between the predictions generated by each selected GCM, resulting in a final map (Abdelkrim et al., 2022). We reclassified all resulting maps into a binary format, distinguishing potential invasion areas based on a threshold corresponding to the lowest environmental suitability value associated with known presence records. We considered an omission value (E) of 0.05 (Jiménez-García & Peterson, 2019; Liu et al., 2005; Marques et al., 2020). The potential extension area was quantified in all scenarios.
Validation of the model: We validated the models only under current conditions, as the behavior of A. vittatus under future climate change scenarios is unknown. We used the ntbox packages (Osorio-Olvera et al., 2020) in R Studio to estimate the area under the curve (AUC), with metric values between 0.7 to 0.9 indicating good models and values > 0.9 considered excellent (Peterson et al., 2011). To further assess model performance, we determined the significance level of the AUC using partial analysis of Receiver Operating Characteristics (ROC-partial). This analysis utilized the B and D subsets of A. vittatus presence records (Lobo et al., 2008). This analysis aimed to address AUC deficiencies (Peterson et al., 2008) by adjusting the parameter to 0.05 per 1 000 iterations. To evaluate the model’s significance, we considered AUC values with P < 0.05, indicating that the predictions were statistically superior to those from a random model (Echeverry-Cárdenas et al., 2021; Peterson et al., 2008).
Results
The systematic search resulted in over 1 300 results, with 63 meeting the search criteria. Among these, seven articles reported the first registries of A. vittatus, while the remaining 110 registries were from various locations in Africa, Asia, Europe, and America (Table 1; Fig. 1A). The search on the GBIF platform initially retrieved 395 occurrences, which were reduced to 94 after purging. Therefore, the final dataset from the systematic search and GBIF platform comprises 212 occurrences (Fig. 1A).
Table 1 Records of A. vittatus worldwide were obtained from a bibliographic review. The data are presented chronologically, from oldest to most recent.
| Continent | Country | Year | Reference |
| Europe | France | 1861 | (Bigot, 1861)* |
| Africa | Morocco | 1916 | (Gaud, 1947)* |
| Europe | Spain | 1925 | (Gil-Collado, 1930)* |
| Europe | Spain | 1927 | (Gil-Collado, 1930) |
| Europe | Spain | 1929 | (Gil-Collado, 1930) |
| Asia | Bangladesh | 1949 | (Nasir-ud-din, 1952) |
| Africa | Tunisia | 1952 | (Vermeil, 1953)* |
| Europe | France | 1952 | (Hamon & Remmert, 1952) |
| Europe | Italy | 1960 | (Coluzzi, 1961)* |
| Europe | France | 1960 | (Callot, 1962) |
| Asia | Pakistan | 1960 | (Qutubuddin, 1960) |
| Africa | Zimbabwe | 1967 | (Freyvogel & McClelland, 1969) |
| Africa | Senegal | 1972 | (Diallo et al., 1999) |
| Africa | Uganda | N.A | (Mukwaya, 1974) |
| Africa | Nigeria | 1973 | (Service, 1974) |
| Africa | Nigeria | N.A | (Stafford, 1981) |
| Africa | Nigeria | 1981 | (Irving-Bell et al., 1987) |
| Asia | Pakistan | 1993 | (Suleman & Khan, 1993) |
| Asia | India | 1997 | (Patel, 2016) |
| Asia | India | 1998 | (Rajavel et al., 2005) |
| Asia | Oman | 2000 | (Roberts, 2004) |
| Asia | Saudi Arabia | 2000 | (Miller et al., 2002) |
| Asia | Pakistan | 2000 | (Ilahi & Suleman, 2013) |
| Asia | India | 2006 | (Angel & Joshi, 2008) |
| Africa | Central African Republic | 2006 | (Ngoagouni et al., 2012) |
| Europe | Spain | 2007 | (Bueno-Marí, 2010) |
| Asia | India | 2008 | (Kumari et al., 2011) |
| Africa | Senegal | 2009 | (Diagne et al., 2014) |
| Asia | Saudi Arabia | 2009 | (Al Ashry et al., 2014) |
| Africa | Nigeria | 2010 | (Idowu et al., 2012) |
| Asia | Saudi Arabia | 2010 | (Alikhan et al., 2014) |
| Africa | Senegal | 2011 | (Diallo et al., 2014) |
| Africa | Nigeria | 2011 | (Adeleke et al., 2013) |
| Asia | Iran | 2011 | (Nasirian et al., 2014) |
| Africa | Ghana | 2012 | (Suzuki et al., 2016) |
| Africa | Ghana | 2012 | (Esena et al., 2013) |
| Asia | Pakistan | 2013 | (Ali et al., 2013) |
| Africa | Ivory Coast | 2013 | (Zahouli et al., 2017b) |
| Africa | Ivory Coast | 2014 | (Zahouli et al., 2017a) |
| Asia | Pakistan | 2014 | (Khan et al., 2015) |
| Africa | South Africa | 2014 | (Guarido et al., 2021) |
| Africa | South Africa | 2014 | (Johnson et al., 2020) |
| Europe | Spain | 2015 | (Díez-Fernández et al., 2018) |
| Africa | Kenya | 2015 | (Chepkorir et al., 2018) |
| Africa | Ghana | 2015 | (Captain-Esoah et al., 2020) |
| Europe | Spain | 2017 | (Eritja et al., 2018) |
| Africa | Kenya | 2017 | (Mulwa et al., 2018) |
| Africa | Nigeria | 2017 | (Afolabi et al., 2019) |
| Asia | United Arab Emirates | 2017 | (Roberts, 2020) |
| Asia | Sri Lanka | 2017 | (Chandrasiri et al., 2019) |
| Africa | Ethiopia | 2017 | (Ferede et al., 2018) |
| Africa | South Africa | 2017 | (Omar et al., 2021) |
| Africa | Benin | 2017 | (Anges et al., 2018) |
| Africa | Sudan | 2017 | (Eshag et al., 2019) |
| Africa | Tunisia | 2017 | (Ben Ayed et al., 2019) |
| Asia | India | 2018 | (Singh et al., 2019) |
| Asia | India | 2018 | (Sudeep et al., 2020) |
| Africa | Ghana | 2018 | (Joannides et al., 2021) |
| Asia | Sri Lanka | 2018 | (Surendran et al., 2021) |
| America | Dominican Republic | 2019 | (Alarcón-Elbal et al., 2020)* |
| America | Cuba | 2019 | (Pagac et al., 2021)* |
| America | Cuba | 2020 | (Díaz-Martínez et al., 2021) |
| Asia | India | 2020 | (Reegan et al., 2020) |
* First registries; N.A Year not available.
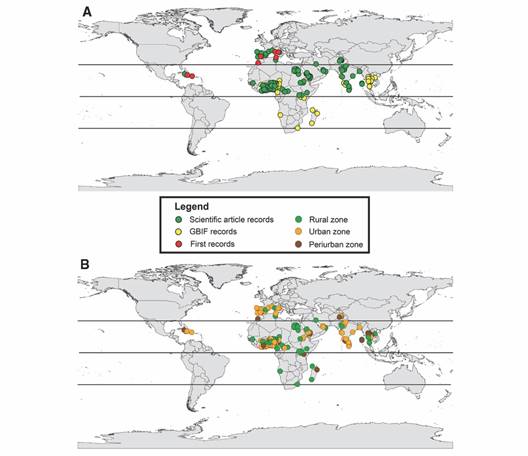
Fig. 1 World map showing records of A. vittatus occurrence. A. Zones where it is found based on the occurrences. B. In both maps the isoclines are presented. The isoclines show the tropical and subtropical regions.
Table 2 lists the selected variables for calibrating the ENM, all of which are important in the biological cycle of A. vittatus. The supplementary material (SMT1) contains the ecological characterization data, which indicates that A. vittatus is mainly found in urban zones (42.4 %), followed by rural (39.6 %) and peri-urban (17.9 %) zones (Fig. 1B). In these zones, the mosquito is found in various habitats, including tropical forests (37.2 %), tropical grasslands (30.1 %), deserts (16.0 %), Mediterranean forests (9.4 %), lakes (2.8 %), high-altitude grasslands (1.8 %), temperate forests (0.9 %), mangroves (0.9 %), and temperate grasslands (0.5 %). Based on global registries collected and with a 30-year data history for temperature and precipitation variables, on average A. vittatus in Africa is found at temperatures of 25.4 °C ± 2.4 (min 9.7-33.3 max), precipitations up to 100.9 mm ± 85.1 (min 0.0-466.0 max), and altitudes of 451.9 m ± 359.9 (min 4-1 656 max). In Asia, the mosquito is found at temperatures averaging 25.9 °C ± 3.0 (min 6.5-35.9 max), with precipitation levels averaging 67.6 mm ± 57.4 (min 0-1 594 max), and altitudes around 415.6 m ± 521.4 (min 2-2 403 max). In Europe, the conditions are characterized by temperatures averaging 15.4 °C ± 5.6 (min 1.4-27 max), precipitation averaging 74.6 mm ± 58.1 (min 2-324 max), and altitudes around 357.9 m ± 376.1 (min 19-1 497 max). In the Americas, A. vittatus typically experiences temperatures averaging 24.7 °C ± 1.6 (min 20.2-27.5 max), precipitation averaging 42.3 mm ± 15.4 (min 25-222 max), and altitudes around 263.3 m ± 317.9 (min 64-630 max). Furthermore, a Kruskal-Wallis analysis determined that between altitude and zone type no statistically significant differences exist (chi-squared= 2.2375, df= 2, P = 0.3267). In turn, in any of the three zones, A. vittatus has been recorded principally between 100 and 500 m approximately, nevertheless, it has been registered in altitudes up to 1 600 m in urban zones and > 2 000 m in peri-urban and rural zones (Fig. 2).
Table 2 Climatic variables selected for the ENM of A. vittatus in the world
| Variable | Unit |
| Rainfall seasonality | % |
| Isothermality | % |
| Annual precipitation | mm |
| Precipitation of the wettest month | mm |
| Precipitation of the driest quarter | mm |
| Mean annual temperature | °C |
| Mean diurnal range | °C |
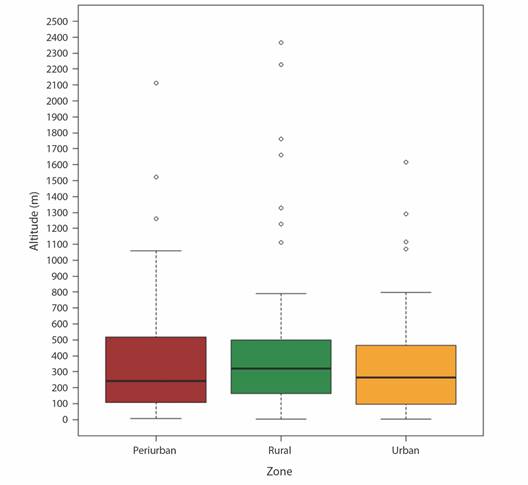
Fig. 2 Box diagram showing the results of the Kruskal-Wallis test for the global registries of A. vittatus with respect to altitude and type of zone.
The estimations under the current context, for both hypotheses of native areas, Africa (AUC= 0.90 and ROC partial P = 0.00) and Asia (AUC= 0.83 and ROC partial P = 0.00), suggest that both models are suitable for making predictions. The invasion scenarios obtained in both estimations indicate that A. vittatus would primarily inhabit tropical regions rather than subtropical ones. These models predict its potential presence in Oceania, North America, and South America, where its presence has not been reported to date. In these estimations, A. vittatus could be found at altitudes of up to 2 900 m in Africa and Europe and 3 900 m in Asia. Conversely, for the African hypothesis, it is estimated that it could inhabit areas up to 3 900 m in America and 900 m in Oceania, while for the Asian hypothesis, it could be found up to 4 900 m in America and 749 m in Oceania.
In the African hypothesis, which assumes Africa as the native area, the proposed invasion encompasses a smaller area (in square kilometers) and fewer sites compared to the Asian hypothesis, where Asia is considered the native area (Table 3). In the African continent, A. vittatus could be found in 96 % of its total extent, spanning across 52 countries, with a more scattered distribution in the northern and southern regions of the continent. In contrast, the Asian hypothesis suggests a distribution that covers regions in every country on the African continent. In the Asian continent, the African hypothesis covers 39 % of the continent (31 countries), while the Asian hypothesis covers 52 % (27 countries) with a greater distribution towards the western regions. It is noteworthy that both hypotheses for the Asian invasion exhibit similarities and include regions such as the Philippine islands, Indonesia, Japan, Malaysia, and Taiwan. In the European continent, the African hypothesis encompasses suitable areas in 91 % of the continent (45 countries). In contrast, the Asian hypothesis concentrates its distribution primarily in the Mediterranean region and eastern Europe, covering approximately 86 % of the continent. Additionally, suitable areas were identified in Iceland, which is not the case in the African hypothesis. In Oceania, according to both hypotheses, the mosquito could be found in much of Australia, with a lesser presence in New Caledonia, New Zealand, and Papua New Guinea. Furthermore, in the American continent, according to both hypotheses, the distribution extends to all countries except Surinam under the Asian hypothesis. In this same hypothesis, the presence of the mosquito could also be noted along the coastline of Alaska (the United States) (Fig. 3).
Table 3 Expansion of current and future potential global invasion areas for A. vittatus.
| Hypothesis | Period | Scenario | Native area (km2) | Invasion area (km2) | Absence area (km2) |
| Africa | Current | ‒ | 18 693 336.5 | 13 082 744.5 | 108 343 919.0 |
| 2041-2060 | SSP245 | 17 679 724.5 | 14 006 475.7 | 108 433 799.8 | |
| SSP370 | 18 019 071.4 | 14 279 094.5 | 107 821 834.2 | ||
| SSP585 | 18 538 825.1 | 14 667 354.9 | 106 913 820.0 | ||
| 2081-2100 | SSP245 | 18 538 230.5 | 15 239 057.0 | 106 342 712.5 | |
| SSP370 | 25 046 653.9 | 26 009 563.2 | 89 063 782.9 | ||
| SSP585 | 23 682 315.9 | 26 163 646.0 | 90 274 038.2 | ||
| Asia | Current | ‒ | 7 123 754.9 | 23 307 443.3 | 109 688 801.8 |
| 2041-2060 | SSP245 | 13 010 899.4 | 28 791 713.6 | 98 317 387.0 | |
| SSP370 | 12 609 887.7 | 28 476 616.3 | 99 033 496.0 | ||
| SSP585 | 14 260 564.9 | 29 400 383.6 | 96 459 051.5 | ||
| 2081-2100 | SSP245 | 18 498 701.5 | 29 065 207.7 | 92 556 090.9 | |
| SSP370 | 17 591 115.3 | 29 199 422.3 | 93 329 462.4 | ||
| SSP585 | 17 555 140.0 | 28 984 905.5 | 93 579 954.5 |
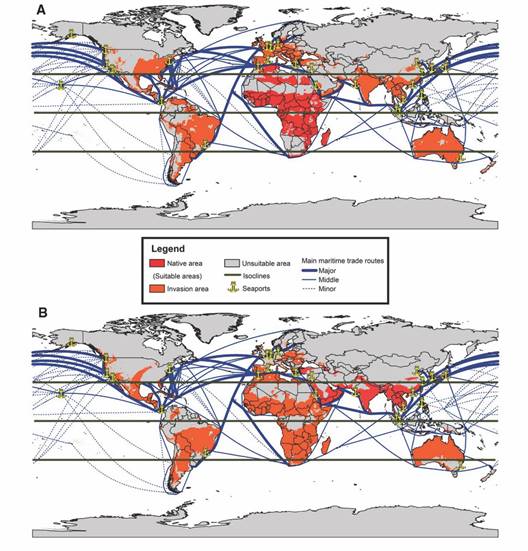
Fig. 3 Model of global potential invasion by A. vittatus under current conditions, assuming A. Africa, and B. Asia as its native regions. In both maps the principal seaports and their principal maritime trade routes are represented.
Overall, in the future context for both hypotheses, the invasion of A. vittatus reaches very similar zones. The invasion consistently tends to increase in tropical zones regardless of the scenario and period, and this trend becomes even more pronounced in subtropical zones with high emission scenarios (SSP370 and SSP585). For the Asian hypothesis, it is estimated that A. vittatus can potentially invade colder zones, which is not the case in the African hypothesis. In both hypotheses, for the 2041-2060 period and across all three scenarios, the mosquito could be found at altitudes of up to 3 900 m in Asia, Africa, and America. Nevertheless, in the Asian hypothesis, it could reach altitudes exceeding 4 000 m in America within all three emission scenarios. In Europe, for both hypotheses, the mosquito could reach altitudes up to 2 900 m. In addition, in Oceania, the maximum altitude is between 500 and 749 m. For the 2081-2100 period, under the African hypothesis, A. vittatus could invade altitudes > 4 000 m in America in scenarios SSP370 and SSP585. Likewise, A. vittatus can reach altitudes > 5 000 m in Asia (China) under the three scenarios in the Asian hypothesis, while for the African hypothesis, this occurs only in high scenarios (SSP585). Furthermore, within the invasion zone encompassing Greenland and Antarctica, the mosquito could be found at altitudes reaching up to 1 900 m.
In future estimations, under a context of climate change, in the African hypothesis for the first period (2041-2060), the potential invasion of A. vittatus in the three scenarios (SSP245, 370 and 585) was quite similar to the current conditions. In SSP245 scenario, the invasion area expanded compared to the invasion under current conditions (Table 3). This is evident in countries across the Americas, including Brazil, Guyana, Suriname, French Guiana, Honduras, El Salvador, Guatemala, Belize, Puerto Rico, the Dominican Republic, the United States, and Canada. However, the potential invasion area decreased in Argentina, Colombia, Ecuador, Panama, and Mexico. Meanwhile, in Asia, it expanded in China and South Korea but contracted in Saudi Arabia, Oman, Yemen, India, Turkey, Iran, Kazakhstan, southwestern Russia, Burma, Iraq, and North Korea. In the European continent, the potential invasion area expanded in Norway, Sweden, Poland, Ukraine, Romania, Hungary, Slovakia, Lithuania, and the Czech Republic but decreased in Spain. Furthermore, in Africa, it increased in certain areas of Tanzania and Kenya but diminished in Morocco, Algeria, Mauritania, Mali, Niger, Chad, Sudan, Ethiopia, Somalia, Eritrea, the Democratic Republic of Congo, and Madagascar. In Oceania, the potential invasion area decreased in Australia and New Zealand (Fig. 4A).
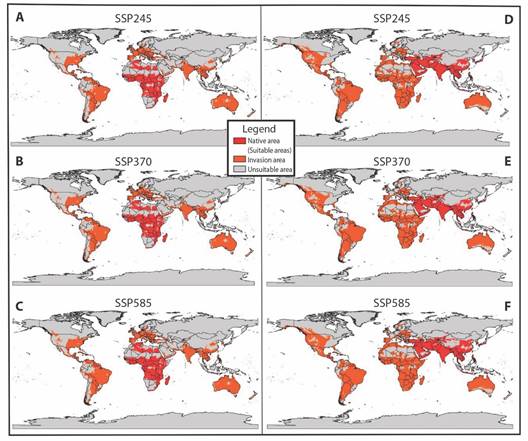
Fig. 4 A.-C. Global potential invasion model for Africa and, D.-F. Asia, during the 2041-2060 period under three climate change scenarios (SSP245, SSP370, and SSP585).
In SSP370 scenario, both the invasion area and the native distribution area expanded (Table 3). The trends are observed in various countries across different continents. In the Americas, countries such as Colombia, Brazil, Venezuela, Guyana, Suriname, Peru, Bolivia, Argentina, Panama, Nicaragua, Guatemala, Belize, the Dominican Republic, Puerto Rico, Mexico, the United States, and Canada have seen these changes. In Asia, we have witnessed increases in Laos, Vietnam, Kazakhstan, Turkmenistan, Turkey, Saudi Arabia, Pakistan, Tajikistan, and Yemen, with decreases noted in Oman and China. In Europe, expansion has been observed in Sweden, Poland, Belarus, Ukraine, Romania, and Spain. In Africa, the invasion has intensified in Algeria, Morocco, Libya, Egypt, Nigeria, Tanzania, Kenya, Uganda, Botswana, Congo, Zimbabwe, and South Africa, while variation is evident in Senegal, Mali, Niger, Chad, and Sudan. Finally, Oceania has seen an increase in Australia (Fig. 4B). In scenario SSP585, the invasion increases (Table 3) for the sites mentioned, including India (Asia), diminishing in Senegal, Mali, Niger, Chad, and Sudan (Africa) (Fig. 4C).
For the second period (2081-2100) in scenario SSP245, the potential invasion remained similar to that of the first period, with a broader extension observed in the Americas, including Brazil, Guyana, Suriname, French Guiana, Peru, Colombia, Venezuela, Argentina, Bolivia, Panama, Nicaragua, Honduras, Guatemala, Belize, El Salvador, Mexico, Puerto Rico, the Dominican Republic, the United States, and Canada. In Asia, the invasion expands in China, India, Pakistan, Tajikistan, Kazakhstan, Afghanistan, Turkmenistan, Turkey, Iraq, Iran, Saudi Arabia, southwestern Russia, and South Korea, while decreasing in Oman and Yemen. In Africa, the potential distribution varies across the continent, particularly in Algeria, Morocco, Libya, Egypt, Eritrea, Senegal, Mali, Niger, Chad, Sudan, Angola, and the Democratic Republic of Congo. In Oceania, the invasion increases in Australia (Fig. 5A).
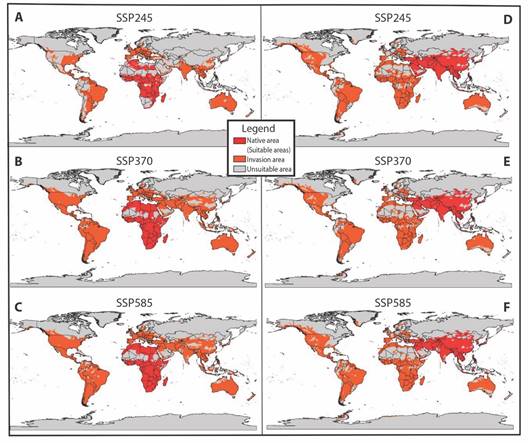
Fig. 5 A.-C. Global potential invasion model for Africa and, D.-F. Asia during the 2081-2100 period under three climate change scenarios (SSP245, SSP370, and SSP585).
In scenarios SSP370 and SSP585, the invasion of A. vittatus in the continents is broader (Table 3), given that for the first scenario, it reaches almost the entire American continent, except for Canada and some sites in the United States and around Colombia, Venezuela, Brazil, Ecuador, and Peru. Similarly, the invasion extends to nearly the entire African continent, with estimates suggesting an invasion into parts of the Sahara. In Europe, the distribution remains unchanged compared to scenario SSP245. However, in Asia, the invasion extends into the central part of the continent and intensifies around Iran, Saudi Arabia, and in islands such as Malaysia and Indonesia. In Oceania, the invasion increases in some zones of Australia, New Zealand, and Papua New Guinea (Fig. 5B). In scenario SSP585, the invasion remains unchanged compared to scenario SSP370; nevertheless, a decrease is projected in certain areas of South America, southern Asia, and Australia (Fig. 5C).
In the Asian hypothesis for the initial period (2041-2060), the potential invasion of A. vittatus in scenario SSP245 increases in the southern part of Asia, particularly around Saudi Arabia and Iran, as well as in North and South America. However, there are variations in certain areas of Africa, such as the Democratic Republic of Congo and countries surrounding the Sahara (Morocco, Mauritania, Senegal, Mali, Niger, Chad, and Sudan). In turn, in Europe, the invasion increases in Spain, Sweden, the United Kingdom, Italy, France, Rumania, Ukraine, Germany, and Austria (Fig. 4D). In scenarios SSP370 and SSP585, the distribution remains quite similar to scenario SSP245 except for some zones where the invasion diminishes for scenario SSP370, as in America (Argentina, Mexico, the United States, and Canada), Asia (Saudi Arabia, China, and Afghanistan), Europe (Germany, Poland, Belarus, Ukraine, Sweden, and Finland), and Africa (Mauritania, Mali and Sudan) (Fig. 4E). In scenario SSP585, the invasion increases for all continents, varying in Africa in Mauritania, Mali, Niger, Chad, and Sudan (Table 3) (Fig. 4F).
For the second period (2081-2100) across all three emission scenarios, an invasion is projected in southern Greenland and an area of the Antarctic, extending through South America (Fig. 5D, Fig. 5E, Fig. 5F). In scenarios SSP245 and SSP370, the invasion expands in North America, encompassing larger areas in Canada and the United States, and in South America, affecting certain regions of Brazil, Colombia, Venezuela, Peru, Ecuador, and Argentina. Similarly, an increase is projected in the Asian continent in China, Mongolia, and southeastern Russia. However, for scenario SSP370, a decrease is expected in certain areas of Africa, particularly around the Sahara (Burkina Faso, Mauritania, Niger, Nigeria, Somalia, Eritrea, Senegal, Mali, Niger, Chad, Sudan, South Sudan) (Fig. 5D, Fig. 5E). For scenario SSP585, a decrease is estimated in the invasion in South America, Africa, and Australia, with an increase in some zones of the United States, like Alaska (Fig. 5F).
Discussion
The A. vittatus mosquito is found in tropical and subtropical regions on all continents, except Oceania. It is distributed across urban areas (42.4 %), rural areas (39.6 %), and peri-urban zones (17.9 %), with altitudes ranging from 2 to 2 403 m. No global studies exist for A. vittatus focusing on its latitudinal and altitudinal distribution. Existing studies are based on faunal surveys that indirectly address A. vittatus in rural, peri-urban, and urban zones in Africa (Captain-Esoah et al., 2020; Diallo et al., 2012a; Diallo et al., 2012b) and Asia (Alikhan et al., 2014; Angel & Joshi, 2008; Nasirian et al., 2014). Furthermore, our current estimations indicate the invasion of large areas in countries across every continent. Consequently, A. vittatus can currently be found in rural, peri-urban, and urban zones. Various studies on other invasive mosquito species and disease vectors suggest that the spread and colonization of new areas are associated with factors such as urbanization, climate, reproductive needs, and habitat preferences (Day, 2016; Rose et al., 2020; Wilke et al., 2019).
Global results indicate that A. vittatus is typically found in areas with temperatures averaging between 24 and 26°C and precipitation ranging from 42 to 101 mm. Species of medical and veterinary importance, such as A. aegypti and A. albopictus, which have a tropical and subtropical distribution, exhibit optimal development temperatures between 20 and 32 °C (Reinhold et al., 2018), while species of the genus Culex thrive at optimal temperatures between 24 and 30 °C (Ciota et al., 2014). Regarding A. vittatus, a study assessing the potential distribution of arbovirus vectors in Morocco suggests that it may be found in regions with a mean annual temperature ranging from 20 to 30 °C (Abdelkrim et al., 2021). However, the mean temperature for Europe was found to be 15.4 °C. Nevertheless, our simulations under current conditions estimate suitable areas on this continent. Reproductive success in colder zones may be attributed to the diapause capacity observed in eggs and larvae of species from genera such as Aedes, Anopheles, Ochlerotatus, Orthopodomyia, among others (Denlinger & Armbruster, 2014; Diniz et al., 2017), as well as population growth during the summer or until conditions become optimal for development (Fonseca et al., 2015).
Based on occurrence records, A. vittatus is primarily found in tropical forests and tropical grasslands, followed by dry (desert) and temperate habitats (Mediterranean forests, temperate forests, and temperate grasslands). At present, there are no studies that provide a detailed description or specification of the habitats where A. vittatus is globally distributed. However, studies in Africa for A. vittatus and other mosquito species have documented their abundance in arid lands, savannas, forests, agricultural soils, and villages in which it has been dominant in microhabitats, like puddles, fruits, rock pools and tree holes. In the absence of natural breeding sites, the vector can reproduce in artificial containers such as plastic bottles, cups, used cans, broken clay pots, and so on (Ali et al., 2014; Diallo et al., 2012a; Obi et al., 2022).
Models obtained under current conditions estimate that A. vittatus is primarily distributed in the tropical region (up to 3 900 m for the African hypothesis and 4 900 m for the Asian hypothesis) and in some subtropical zones (up to 2 900 m for the African hypothesis and 3 900 m for the Asian hypothesis). Currently, it is suggested that A. vittatus is mostly distributed in the tropical region with suitable areas of lower probability in subtropical regions (Abdelkrim et al., 2022). Invasive species at a global scale, such as A. aegypti (African) and A. albopictus (Asian) have distributions in both regions. Specifically, A. aegypti exhibits a wider invasion in tropical regions compared to subtropical regions. In contrast, A. albopictus has a broad invasion in both tropical and subtropical regions, and it is estimated to have established in areas including Europe, Iceland, Greenland, the United States, and Japan (Kamal et al., 2018; Kraemer et al., 2015). According to our estimations, A. vittatus could potentially exhibit a pattern similar to A. albopictus. Regardless of its native area, this mosquito has the potential to invade tropical and subtropical zones with altitudes exceeding 2 000 m. Furthermore, under future conditions, it is estimated that the invasion of both A. aegypti and A. albopictus will increase. In contrast, for A. vittatus, its range of invasion is expected to decrease in high emission scenarios (RCP 8.5) in areas such as Spain, Portugal, Australia, Morocco, and Algeria (Abdelkrim et al., 2022). However, our estimations indicate a decrease in Australia for the period 2081-2100 in both hypotheses. Additionally, reduced invasion is also projected in other regions of Africa, Asia, America, and Oceania under scenario SSP585. In contrast, our results for the period 2081-2100, under the Asian hypothesis, suggest that A. vittatus could be present in areas of Greenland and Iceland, similar to the estimates for A. albopictus in 2050 (Kamal et al., 2018).
In both hypotheses, invasion is projected to occur in tropical and subtropical regions. In the case of the native African hypothesis, it suggests a higher level of invasion toward the European continent and North America. Conversely, for the Asian hypothesis, the distribution and invasion rates at these sites are lower. In the future, under the African hypothesis, invasion is projected to extend further into the tropical and subtropical zones of all continents, including Asia. Conversely, under the Asian hypothesis, the extension into Europe remains limited, with a notable increase in Asia, particularly towards cold zones such as Greenland and Antarctica. Global transport networks, climate change, and increased urbanization have facilitated the spread of invasive species. Additionally, their ability to colonize new territories leads to economic, environmental, and public health damage due to various human activities that favor their proliferation (Schaffner et al., 2013; Weaver & Reisen, 2010). As a result, invasive species such as A. aegypti and A. albopictus have expanded their distribution range (Kraemer et al., 2019). In this case, sea lanes play a crucial role in the distribution and invasion of vectors at continental scales (Lounibos, 2002; Service & Place, 1997) as they enable access to new sites through seaports (Wilke et al., 2022). Consequently, A. vittatus, which had previously been documented only in Africa, Asia, and occasionally in Europe, has recently been reported in the Americas. Estimations suggest a future cosmopolitan behavior for this vector, with the potential to be found in continents where it has not been previously recorded and the possibility of colonizing colder climates, including suitable areas in Greenland, Iceland, and Antarctica.
In conclusion, A. vittatus exhibits a tropical and subtropical distribution, inhabiting rural, urban, and peri-urban areas at altitudes ranging from sea level to 2 500 m.a.s.l., with temperatures between 15 and 30 °C, in various landscapes such as forests, grasslands, deserts, and lakes. The mosquito has the potential to invade new areas in Europe, America, and Oceania. Climate change is expected to drive invasions towards colder subtropical zones in countries across Asia, Europe, and North America, regardless of its native range. In a period of around 80 years (2081-2100), invasion is suggested toward zones of Greenland and the Antarctic with the hypothesis that A. vittatus being native of Asia and reaching altitudes up to 5 000 m in China under the three scenarios. Therefore, given A. vittatus’ potential for invasion and ecological adaptability, vector control and epidemiological disease management programs should include monitoring for the presence of this vector in the locations described in this study. Likewise, it is important that in the areas where the vector has been recorded, studies are conducted to understand its population dynamics, feeding and reproductive behavior, life cycles, and preferred habitats. Similarly, given the recent knowledge of its invasion in the Americas, studies aimed at understanding its population dynamics and potential spread to new locations are recommended.
Ethical statement: the authors declare that they all agree with this publication and made significant contributions; that there is no conflict of interest of any kind; and that we followed all pertinent ethical and legal procedures and requirements. All financial sources are fully and clearly stated in the acknowledgments section. A signed document has been filed in the journal archives.
See supplementary material See supplementary material

