


 English (pdf)
 Article in xml format
 Article references
 Send this article by e-mail
 Cited by SciELO
  Similars in
SciELO
Similars in
SciELO  uBio
uBio 
 Permalink
Introduction
Bat populations play a vital role in natural ecosystems and have a significant positive economic impact, particularly insectivore bat populations in the control of agricultural pests (Cleveland et al., 2006). Colony size is an important variable to understand the biology and ecology of organisms that live in groups. It is also important for the implementation of effective conservation actions for these organisms and can also provide useful ecological information, such as the amount of dispersed seeds, dynamic of the community, and foraging patterns (Hristov, Betke, Theriault, Bagchi, & Kunz, 2010). However, estimating colony size in the field is difficult and has been both a logistical and technological challenge, particularly for endangered, rare, and cryptic species (Kunz & Anthony, 1996; Kunz, 2003; McCracken, 2003; Kunz, Betke, Hristov, & Vonhof, 2009). This is mainly due to the biological characteristics of bats, such as their small size, high vagility, and their strictly nocturnal lifestyle, although it is also a result of the methodologies employed. For example, estimations of colony size using thermal imaging are highly costly (Hristov, Betke, & Kunz, 2007) and visual counts and photographic estimations can be prone to bias (O’Farrell & Gannon, 1999). Capture-mark-recapture (CMR) methods, which consist in marking individuals in a first capture session and then recording the proportion of marked individuals in subsequent recapture sessions, have been demonstrated to be an efficient tool for the estimation of bat colony size (Puechmaille & Petit, 2007). Although to date there are no studies in which the population size of ecologically similar and taxonomically related sympatric bat species is compared, it is to be expected that when subjected to the same environmental conditions they will show similar population sizes, and therefore similar probabilities of capture. The empirical data, at least in the Mexican tropics, do not show a clear pattern in this sense, since some studies show a tendency for species of the same genus to show similar abundances (e. g., Navarro & Leon-Paniagua, 1995; Ramírez-Lucho, Coates, & González-Christen, 2017), while in others there is a clear predominance in the number of captures of a species (e. g. Moreno & Halfter, 2001; Mendoza, Horváth, Ruiz, Escalona, & Navarrete, 2017).
Given the low abundance of roosts that contain colonies of thousands of bats worldwide (Furey & Racey, 2016), it is necessary to carry out estimations of colony size that will help to obtain a better perspective of the dynamics of bat populations across time. In this sense, caves stand out due to their capacity to maintain thousands or millions of individuals (Arita, 1993; Trajano & Giménez, 1998), although they are also relatively more vulnerable systems compared to other roosting sites (Elliott, 2000; Hamilton-Smith & Eberhard, 2000) and are currently subject to threats (guano mining, unsupervised tourist visits, vandalism, and alteration and loss of surrounding vegetation cover) that put bat populations at risk and could even lead to the extinction of species that depend on cave roosts (Mickleburgh, Hutson, & Racey, 2002; Medellín, 2003; Elliott, 2004; Gunn, 2004; McCracken, 2011; Medellín, Wiederholt, & López-Hoffman, 2017).
Considering the above, there is an urgent need to perform studies that provide information about the identity and abundance of species that occupy a given roosts, such as caves and mine tunnels, in order to determine which are the main populations and sites that exhibit higher vulnerability and conservation value (Kloepper et al., 2016). This is important because in most conservation plans and identification of areas in need of protection, the parameters that are taken into account are vegetation cover and forest fragmentation, while subterranean ecosystems (caves, mines, cracks) tend to be underrepresented or even ignored (Sugai, Ochoa-Quintero, Costa-Pereira, & Roque, 2015; Medellín et al., 2017).
The roosts evaluated in this study had not been previously explored, so there are no previous studies that indicated the high diversity of species that the three roosts harbor. However, the results of the diversity (richness and abundance) of the three refuges have been published recently (Hernández-Aguilar & Santos-Moreno, 2020a), so work will continue so that the three sites are considered important sites for bat populations from Mexico. Therefore, the objective of this study was to estimate the colony size of 14 bat species that were recorded throughout one year in a mine and two caves. In addition, we present a new method to estimate the colony size of species with low recapture rates (< 10 %).
Matherials and methods
Study site: The study was carried out in a mine tunnel (hereafter La Mina, 15º54’52’’ N & 96º24’59’’ W, and an altitude of 1 110 m.a.s.l), in the municipality of Pluma Hidalgo, and two caves in Santa María Huatulco: El Apanguito (15º51’58’’ N & 96º21’13.2’’ W, and an altitude of 695 m.a.s.l) and Cerro Huatulco (15º50’59’’ N & 96º21’04.3’’ W, and an altitude of 475 m.a.s.l), located in the state of Oaxaca, Mexico (Fig. 1). The entrances to La Mina are 3 m high and 2 m wide, for El Apanguito it is 1.20 x 1.5 m and at Cerro Huatulco it is 10 x 15 m. The Mine contains water for most of the year and only Cerro Huatulco has four chambers, the remaining two have only one chamber. A complete description of the roosting sites can be found in Hernández-Aguilar & Santos-Moreno (2020a; 2020b). The climate is hot subhumid with rainfall in the summer and the main vegetation in the zone is medium semi-evergreen forest with coffee plantations (Trejo, 2004; OEIDRUS, 2005).
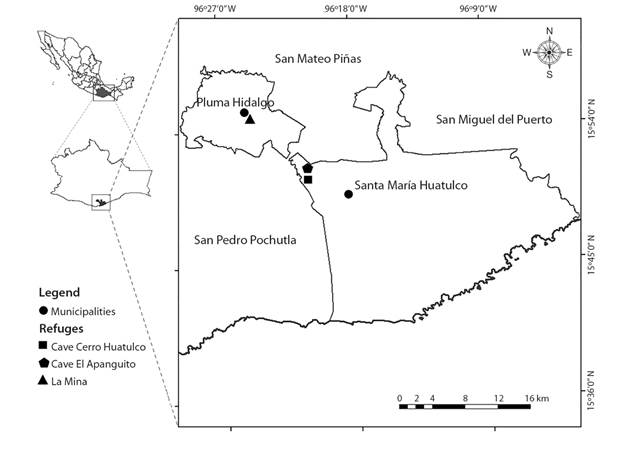
Fig. 1 Geographic location of the three roosts evaluated in the municipalities of Pluma Hidalgo and Santa María Huatulco, Oaxaca, Mexico.
Field work: We carried out monthly samplings from June 2016 to June 2017, with a duration of two nights per roost, including a dry season (October-April) and a rainy season (May-September). It was not possible to perform any sampling during the month of May 2017 due to adverse environmental conditions that made it impossible to access La Mina. Bats were captured with a G5 harp trap (Bat Conservation and Management, Inc., Carlisle, PA, EE. UU.), 1.5 m wide and 2 m high, that was placed at the entrance of the roosts from 18:00 to 00:00. All captured individuals were immediately placed in cloth bags and then processed. We identified the species and determined the sex and age category (juvenile or adult); according to the degree of the phalangeal epiphyses observed against the light of a headlamp (Handley, Wilson, & Gardner, 1991). Finally, we placed an aluminum ring (National Band and Tag Company, Newport, Kentucky, USA) on the forearm of each individual with a unique serial identification number depending on the size of the organism: category A (2.9 mm diameter) for species such as Pteronotus fulvus and Natalus mexicanus; and category B (4 mm) for species such as Artibeus toltecus, Carollia perspicillata, Glossophaga soricina, Pteronotus mesoamericanus, and Mormoops megalophylla. Once all the information was recorded, we released the individuals in the place where they were captured. In the case of recaptured organisms, we obtained complementary data, such as time of recapture and if the ring caused any damage to the forearm. This study was carried out with a Scientific Collection License for wildlife teaching granted by the Ministry of Environment and Natural Resources (SEMARNAT-20/ks-0112/10/16).
Data analysis: We constructed capture-recapture histories of individuals grouped by species and roost. In the case of species with recaptures that represented at least 10 % of total captures, we applied a Cormack-Jolly-Seber model was applied, which includes four assumptions: 1) each animal marked in time (i) has the same probability of being recaptured (p i ); 2) each animal marked in the population at time (i) has the same probability of surviving time (i + 1); 3) the marks do not fall off or are erased, they are detectable, and 4) the information collection process is relative to the interval of each time elapsed between time (i) and time (i + 1). This model includes two parameters: capture probability (p) and apparent survival probability (ϕ). Each parameter can be constant (p o ϕ) or vary across time (pt or ϕt), which results in four possible candidate models for each species and roost. The final model for each species and roost was selected based on the Akaike Information Criterion for small samples (AICc, Burnham & Anderson, 2002). Estimations were performed in Mark version 8.2 (White & Burnham, 1999). Once the final model was selected, we estimated the value or values of p (when the final model included this parameter as constant or varying across time, respectively) and used them to estimate monthly population sizes (N) as the ratio of the number of captured individuals (n) and the capture probability (p): N= n/p (Lindenmayer, Lacy, & Viggers, 1998). In order to apply the Cormack-Jolly-Seber model to species with no recaptures or a recapture proportion lower than 10 % of the captures, we estimated the number of individuals per roost by applying the same proportion between the number of captured specimens and the estimated number for the recorded species that belonged to the same family or to the same trophic guild. For the phyllostomid bat species Artibeus jamaicensis, A. toltecus, A. watsoni, Desmodus rotundus, Glossophaga soricina, Sturnira hondurensis, and Carollia perspicillata from El Apanguito and Cerro Huatulco, the estimated number was obtained by applying the same proportion between the number of captured specimens and the estimated number for Carollia perspicillata from La Mina, whose capture probability had a narrower confidence interval than that of A. toltecus in the same roost. In the case of the mormoopid species Pteronotus fulvus, P. mesoamericanus, and P. psilotis, values were calculated with the proportion observed for insectivorous bat Mormoops megalophylla in El Apanguito, which was the only species of this family for which we obtained enough data to estimate capture probabilities. Moreover, this species shares ecological similarities with other species of the same family and can form large colonies, as those observed in the genus Pteronotus. Given that we did not record M. megalophylla in El Apanguito during the months of May, June, and July and could not estimate the proportion between the number of captured individuals and the number estimated with the Cormack-Jolly-Seber model, we considered the mean value of the proportions of the months when the species was recorded (from September to April). In the case of Balantiopterix plicata (Emballonuridae), Natalus mexicanus (Natalidae), and Myotis pilosatibialis (Vespertilionidae), which did not have recapture proportions higher than 10 % in any roost or an ecologically similar species, proportions were calculated in the same way as for mormoopids, which did not have recaptures or had recaptures lower than 10 % of total captures. The number of individuals per roost and month was calculated as the sum of the estimates of each species present, while the total per roost was calculated conservatively as the sum of the maximum estimated number monthly of each species for each roost throughout the year. This restriction was applied because we do not know the number of individuals that remain in each refuge throughout the year and many individuals would be re-counted as much as 12 times if we the sum of all the monthly estimates of each species.
Results
We captured, marked, and released 5 788 bats of 14 species, 10 genera, and five families: one emballonurid (Balantiopterix plicata), one natalid (Natalus mexicanus), four mormoopids (Mormoops megalophylla, Pteronotus fulvus, P. mesoamericanus, and P. psilotis), seven phyllostomids (Artibeus jamaicensis, A. toltecus, A. watsoni, Carollia perspicillata, Desmodus rotundus, Glossophaga soricina, and Sturnira hondurensis), and one vespertilionid (Myotis pilosatibialis). The most abundant species were P. fulvus and P. mesoamericanus with 41.01 and 32.34 % of the captures, respectively, and the least abundant species were G. soricina (3.11 %) and A. toltecus (1.31 %). We captured 570 individuals in La Mina, 4 306 in El Apanguito and 960 in Cerro Huatulco (Table 1).
Table 1 Number of captured (first number) and estimated (second number) bats per month per roost for species or colonies to which we could not apply capture-recapture models (recapture proportions lower than 10 %)
| Month | Max | ||||||||||||
| Jul | Aug | Sep | Oct | Nov | Dec | Jan | Feb | Mar | Apr | May | Jun | ||
| Roost | Balantiopterix plicata | ||||||||||||
| La Mina | 0-0 | 0-0 | 0-0 | 0-0 | 0-0 | 0-0 | 0-0 | 0-0 | 0-0 | 0-0 | 0-0 | 0-0 | 0-0 |
| CCH | 1-13 | 0-0 | 0-0 | 0-0 | 0-0 | 0-0 | 0-0 | 0-0 | 0-0 | 0-0 | 0-0 | 0-0 | 1-13 |
| CEA | 0-0 | 0-0 | 0-0 | 0-0 | 0-0 | 0-0 | 0-0 | 0-0 | 0-0 | 0-0 | 0-0 | 0-0 | 0-0 |
| Total | 1-13 | 0-0 | 0-0 | 0-0 | 0-0 | 0-0 | 0-0 | 0-0 | 0-0 | 0-0 | 0-0 | 0-0 | |
| Natalus mexicanus | |||||||||||||
| La Mina | 1-13 | 1-13 | 0-0 | 1-13 | 0-0 | 0-0 | 1-13 | 0-0 | 0-0 | 0-0 | 0-0 | 0-0 | 1-13 |
| CCH | 0-0 | 0-0 | 0-0 | 1-13 | 0-0 | 0-0 | 0-0 | 1-13 | 3-40 | 0-0 | 0-0 | 0-0 | 3-40 |
| CEA | 0-0 | 12-159 | 28-371 | 17-225 | 61-808 | 17-225 | 18-238 | 11-146 | 15-199 | 13-172 | 3-40 | 4-53 | 61-808 |
| Total | 1-13 | 13-172 | 28-371 | 19-251 | 61-808 | 17-225 | 19-251 | 12-159 | 18-239 | 13-172 | 3-40 | 4-53 | |
| Mormoops megalophylla | |||||||||||||
| La Mina | 0-0 | 0-0 | 0-0 | 0-0 | 0-0 | 0-0 | 0-0 | 0-0 | 0-0 | 0-0 | 0-0 | 0-0 | 0-0 |
| CCH | 6-79 | 0-0 | 2-27 | 0-0 | 1-13 | 0-0 | 1-13 | 0-0 | 0-0 | 0-0 | 6-79 | 13-172 | 13-172 |
| Total | 6-79 | 0-0 | 2-27 | 0-0 | 1-13 | 0-0 | 1-13 | 0-0 | 0-0 | 0-0 | 6-79 | 13-172 | |
| Pteronotus fulvus | |||||||||||||
| La Mina | 0-0 | 0-0 | 0-0 | 0-0 | 0-0 | 0-0 | 1-13 | 0-0 | 1-13 | 0-0 | 0-0 | 0-0 | 1-13 |
| CCH | 6-79 | 81-1 070 | 70-928 | 37-490 | 167-2 212 | 78-1 033 | 23-305 | 110-1 457 | 100-1 325 | 68-901 | 8-106 | 10-132 | 167-2 212 |
| CEA | 0-0 | 2-26 | 151-2 001 | 65-861 | 138-1 828 | 190-2 516 | 177-2 345 | 499-6 609 | 311-4 119 | 38-504 | 27-358 | 11-146 | 499-6 609 |
| Total | 6-79 | 83-1 096 | 221-2 929 | 102-1 351 | 305-4 040 | 268-3 549 | 201-2 663 | 609-8 066 | 412-5 457 | 106-1 405 | 35-464 | 21-278 | |
| Pteronotus mesoamericanus | |||||||||||||
| La Mina | 2-26 | 10-132 | 41-543 | 14-185 | 16-212 | 8-106 | 15-199 | 1-13 | 0-0 | 5-66 | 0-0 | 0-0 | 41-543 |
| CCH | 12-159 | 6-79 | 9-119 | 12-159 | 1-13 | 1-13 | 0-0 | 3-40 | 4-53 | 1-13 | 17-225 | 8-106 | 17-225 |
| CEA | 58-768 | 108-1 427 | 136-1 802 | 216-2 860 | 117-1 550 | 88-1 165 | 74-980 | 114-1 510 | 74-980 | 186-2 466 | 202-2 675 | 309-4 092 | 309-4 092 |
| Total | 72-953 | 124-1 638 | 186-2 464 | 242-3 204 | 134-1 775 | 97-1 284 | 89-1 179 | 118-1 563 | 78-1 033 | 192-2 545 | 219-2 900 | 317-4 198 | |
| Pteronotus psilotis | |||||||||||||
| La Mina | 0-0 | 0-0 | 0-0 | 0-0 | 0-0 | 0-0 | 0-0 | 0-0 | 0-0 | 0-0 | 0-0 | 0-0 | 0-0 |
| CCH | 2-26 | 0-0 | 0-0 | 0-0 | 0-0 | 0-0 | 0-0 | 0-0 | 0-0 | 0-0 | 0-0 | 0-0 | 2-26 |
| CEA | 0-0 | 0-0 | 0-0 | 0-0 | 0-0 | 0-0 | 0-0 | 0-0 | 0-0 | 0-0 | 0-0 | 0-0 | 0-0 |
| Total | 2-26 | 0-0 | 0-0 | 0-0 | 0-0 | 0-0 | 0-0 | 0-0 | 0-0 | 0-0 | 0-0 | 0-0 | |
| Desmodus rotundus | |||||||||||||
| La Mina | 0-0 | 0-0 | 0-0 | 0-0 | 0-0 | 0-0 | 0-0 | 0-0 | 0-0 | 0-0 | 0-0 | 0-0 | 0-0 |
| CCH | 17-363 | 0-0 | 0-0 | 0-0 | 2.42 | 0-0 | 0-0 | 0-0 | 0-0 | 0-0 | 2.42 | 0-0 | 17-363 |
| CEA | 0-0 | 0-0 | 0-0 | 0-0 | 0-0 | 0-0 | 0-0 | 0-0 | 0-0 | 0-0 | 0-0 | 0-0 | 0-0 |
| Total | 17-363 | 0-0 | 0-0 | 0-0 | 2.42 | 0-0 | 0-0 | 0-0 | 0-0 | 0-0 | 2.42 | 0-0 | |
| Glossophaga soricina | |||||||||||||
| La Mina | 0-0 | 0-0 | 11-235 | 10-214 | 27-576 | 6-128 | 7-149 | 11-234 | 19-406 | 39-833 | 0-0 | 0-0 | 39-833 |
| CCH | 2-43 | 4-85 | 0-0 | 2-42 | 33-704 | 0-0 | 0-0 | 0-0 | 0-0 | 0-0 | 11-235 | 0-0 | 33-704 |
| CEA | 0-0 | 0-0 | 0-0 | 0-0 | 0-0 | 0-0 | 0-0 | 0-0 | 0-0 | 0-0 | 0-0 | 0-0 | 0-0 |
| Total | 2-43 | 4-85 | 11-235 | 12-256 | 60-1 280 | 6-128 | 7-149 | 11-234 | 19-406 | 39-833 | 11-235 | 0-0 | |
| Carollia perspicillata | |||||||||||||
| CCH | 0-0 | 1-21 | 0-0 | 0-0 | 0-0 | 0-0 | 0-0 | 0-0 | 0-0 | 0-0 | 0-0 | 0-0 | 1-21 |
| CEA | 0-0 | 0-0 | 0-0 | 0-0 | 0-0 | 0-0 | 0-0 | 0-0 | 0-0 | 0-0 | 0-0 | 0-0 | 0-0 |
| Total | 0-0 | 1-21 | 0-0 | 0-0 | 0-0 | 0-0 | 0-0 | 0-0 | 0-0 | 0-0 | 0-0 | 0-0 | |
| Artibeus jamaicensis | |||||||||||||
| La Mina | 0-0 | 0-0 | 0-0 | 0-0 | 0-0 | 0-0 | 0-0 | 0-0 | 0-0 | 0-0 | 0-0 | 0-0 | 0-0 |
| CCH | 12-256 | 0-0 | 0-0 | 0-0 | 0-0 | 0-0 | 0-0 | 0-0 | 0-0 | 0-0 | 3-64 | 2-42 | 12-256 |
| CEA | 0-0 | 0-0 | 0-0 | 0-0 | 0-0 | 0-0 | 0-0 | 0-0 | 0-0 | 0-0 | 0-0 | 0-0 | 0-0 |
| Total | 12-256 | 0-0 | 0-0 | 0-0 | 0-0 | 0-0 | 0-0 | 0-0 | 0-0 | 0-0 | 3-64 | 2-42 | |
| Artibeus toltecus | |||||||||||||
| CCH | 1-21 | 0-0 | 0-0 | 0-0 | 0-0 | 0-0 | 0-0 | 0-0 | 0-0 | 0-0 | 0-0 | 0-0 | 1-21 |
| CEA | 0-0 | 0-0 | 0-0 | 0-0 | 0-0 | 0-0 | 0-0 | 0-0 | 0-0 | 0-0 | 0-0 | 0-0 | 0-0 |
| Total | 1-21 | 0-0 | 0-0 | 0-0 | 0-0 | 0-0 | 0-0 | 0-0 | 0-0 | 0-0 | 0-0 | 0-0 | |
| Artibeus watsoni | |||||||||||||
| La Mina | 0-0 | 2-43 | 0-0 | 0-0 | 3-64 | 0-0 | 0-0 | 1-21 | 1-21 | 0-0 | 0-0 | 0-0 | 3-64 |
| CCH | 0-0 | 0-0 | 0-0 | 0-0 | 0-0 | 0-0 | 0-0 | 0-0 | 0-0 | 0-0 | 0-0 | 0-0 | 0-0 |
| CEA | 0-0 | 0-0 | 0-0 | 0-0 | 0-0 | 0-0 | 0-0 | 0-0 | 0-0 | 0-0 | 0-0 | 0-0 | 0-0 |
| Total | 0-0 | 2-43 | 0-0 | 0-0 | 3-64 | 0-0 | 0-0 | 1-21 | 1-21 | 0-0 | 0-0 | 0-0 | |
| Sturnira hondurensis | |||||||||||||
| La Mina | 2-43 | 1-21 | 2-43 | 0-0 | 1-21 | 0-0 | 0-0 | 0-0 | 0-0 | 0-0 | 0-0 | 1-21 | 2-43 |
| CCH | 0-0 | 0-0 | 0-0 | 0-0 | 0-0 | 0-0 | 0-0 | 0-0 | 0-0 | 0-0 | 1-21 | 0-0 | 1-21 |
| CEA | 0-0 | 0-0 | 0-0 | 0-0 | 0-0 | 0-0 | 0-0 | 0-0 | 0-0 | 0-0 | 0-0 | 0-0 | 0-0 |
| Total | 2-43 | 1-21 | 2-43 | 0-0 | 1-21 | 0-0 | 0-0 | 0-0 | 0-0 | 0-0 | 1-21 | 1-21 | |
| Myotis pilosatibialis | |||||||||||||
| La Mina | 0-0 | 0-0 | 0-0 | 1-13 | 3-40 | 0-0 | 0-0 | 0-0 | 1-13 | 0-0 | 0 -0 | 1-13 | 3-40 |
| CCH | 0-0 | 0-0 | 0-0 | 0-0 | 0-0 | 0-0 | 0-0 | 0-0 | 0-0 | 0-0 | 0-0 | 0-0 | 0-0 |
| CEA | 0-0 | 0-0 | 0-0 | 0-0 | 0-0 | 0-0 | 0-0 | 0-0 | 0-0 | 0-0 | 0-0 | 0-0 | 0-0 |
| Total | 0-0 | 0-0 | 0-0 | 1-13 | 3-40 | 0-0 | 0-0 | 0-0 | 1-13 | 0-0 | 0-0 | 1-13 | |
Max=Maximum number of bats per roost per species throughout the entire sampling year. CCH: Cave Cerro Huatulco; CEA: Cave El Apanguito.
The Cormack-Jolly-Seber model was applied only to the data of A. toltecus (16.92 % recaptures) and Carollia perspicillata (15.79 %), both in La Mina, and Mormoops megalophylla in El Apanguito (13.17 %). For C. perspicillata and A. toltecus in La Mina, the final model was the one where both capture probability and apparent survival were constant throughout the year (ϕp), whereas for Mormoops megalophylla in El Apanguito, apparent survival was also constant across the whole sampling period, but capture probabilities varied monthly (ϕpt; Table 2). For the three species, the best supported models presented weights of 95.37, 99.21, and 98.77, respectively. The capture probabilities estimated for C. perspicillata and A. toltecus in La Mina and M. megalophylla in El Apanguito were very low, lower than 0.1. For C. perspicillata in La Mina, we estimated a population size of 684 individuals throughout the year, with monthly fluctuations between 107 (March) and 684 (September). For A. toltecus, we estimated 183 individuals, with a maximum abundance in July (183 individuals) and a minimum abundance in December and January (23 individuals in each month). For M. megalophylla in El Apanguito, we estimated a total population size of 2 106 individuals, with a maximum in March (2 106 individuals) and a minimum in June and July (0) (Table 3).
Table 2 Comparison of four candidate models and parameters of the final model (standard error of the estimation in parenthesis) for the three bat species that had recapture proportions higher than 10 %
| Candidate Model | AICc | ∆AICc | AICc Weights | Model Likelihood | Num. Par. | Deviance | Final model Parameter= Value (EE) |
| Carollia perspicillata La Mina | |||||||
| ϕp | 222.7785 | 0 | 0.9537 | 1 | 2 | 80.4352 | ϕ=0.8585 (0.9500) |
| ϕpt | 228.8673 | 6.0888 | 0.0454 | 0.0476 | 11 | 66.9147 | p=0.0467 (0.0899) |
| ϕtp | 236.7892 | 14.0107 | 0.0008 | 0.0009 | 11 | 74.8366 | |
| ϕtpt | 244.5441 | 21.7656 | 0.00002 | 0 | 19 | 63.1724 | |
| Artibeus toltecus La Mina | |||||||
| ϕp | 97.0229 | 0 | 0.9921 | 1 | 2 | 42.6725 | ϕ=0.7286 (0.8815) |
| ϕpt | 111.5070 | 14.4841 | 0.0007 | 0.0007 | 11 | 34.8584 | p=0.0876 (0.2042) |
| ϕtp | 116.0200 | 18.9971 | 0.00007 | 0.0001 | 11 | 39.3715 | |
| ϕtpt | 127.5036 | 30.4807 | 0 | 0 | 19 | 24.4276 | |
| Mormoops megalophylla El Apanguito | |||||||
| ϕpt | 763.4193 | 0 | 0.9877 | 1 | 9 | 46.9828 | ϕ=0.7818 (0.8784) |
| ϕtpt | 772.9295 | 9.5102 | 0.0085 | 0.0086 | 15 | 44.099 | pSeptember= 0 (0) |
| ϕtp | 774.5513 | 11.1320 | 0.0037 | 0.0038 | 9 | 58.1148 | pOctober=0 (0) |
| ϕp | 785.3180 | 21.8987 | 0.00002 | 0 | 2 | 83.0995 | pNovember=0.0299 (0.1134) |
| pDecember=0.0679 (0.1230) | |||||||
| pJanuary=0.1181 (0.1877) | |||||||
| pFebruary=0.1218 (0.1932) | |||||||
| pMarch=0.0807 (0.1367) | |||||||
| pApril=0.0212 (0.0487) | |||||||
AICc = Akaike Information Criterion for small samples. ∆AICc = difference in AICc between the respective model and the best candidate model. Num. Par. = Number of parameters. p = capture probability. Φ = apparent survival probability.
Table 3 Monthly number of captured (first number) and estimated bats with the probabilistic Cormack-Jolly-Seber model (second number) in three roosts for the three species that had recapture proportions higher than 10 %
| Month | Carollia perspicillata | Artibeus toltecus | Mormoops megalophylla |
| La Mina | La Mina | El Apanguito | |
| July | 23 - 491 | 16 - 183 | 0 - 0 |
| August | 17 - 363 | 4 - 46 | 14 - 185 |
| September | 32 - 684 | 8 - 91 | 12 - 159 |
| October | 10 - 214 | 3 - 34 | 66 - 874 |
| November | 25 - 534 | 14 - 160 | 143 -1 894 |
| December | 8 - 171 | 2 - 23 | 99 - 1 311 |
| January | 10 - 214 | 2 - 23 | 133 - 1 762 |
| February | 20 - 427 | 3 - 34 | 155 - 2 053 |
| March | 5 - 107 | 15 - 171 | 159 - 2 106 |
| April | 19 - 406 | 4 - 46 | 35 - 464 |
| May | 0 - 0 | 0 - 0 | 0 - 0 |
| June | 7 - 150 | 5 - 57 | 0 - 0 |
| Mean | 15 - 313 | 6 - 72 | 68 - 901 |
| Min | 0 - 0 | 0 - 0 | 0 - 0 |
| Max | 32 - 684 | 16 - 183 | 159 - 2 106 |
Even though we obtained recaptures of four other species from the three roosts (Glossophaga soricina in La Mina with 2.36 % of recaptures, Pteronotus mesoamericanus in La Mina and El Apanguito with 3.77 and 4.55 %, respectively, P. fulvus in Cerro Huatulco with 0.39 % and in El Apanguito with 3.67 %, and Natalus mexicanus in El Apanguito with 1.52 % recaptures), the proportions with respect to the number of captures were lower than 10 %, and we were not able to apply the Cormack-Jolly-Seber model. There were no recaptures for the rest of the species, but we were able to obtain an estimation of colony size using the methodology described above. We did not observe any species that was consistently the most abundant in the three roosts. In El Apanguito, we obtained the highest estimations for P. fulvus in February (6 609 individuals), for P. mesoamericanus in June (4 092), and for N. mexicanus in November (808). In La Mina, the highest estimated number of individuals for G. soricina was observed in April (833 individuals), for A. watsoni in November (64 individuals), for S. hondurensis in July and September (43 individuals), and for M. pilosatibialis in November (40 individuals), while in Cerro Huatulco, the highest estimations for D. rotundus, A. jamaicensis, P. psilotis, and B. plicata were obtained in July with 363, 256, 26, and 13 individuals, respectively (Table 1).
In the complex comprised of the three studied roosts, we estimated the presence of 20 105 bats, with 67.71 % in El Apanguito, 12.01 % in La Mina, and 20.26 % in Cerro Huatulco. Overall, we estimated a monthly mean value of 525.15 bats in La Mina, with a maximum in September (1 318) and a minimum in May (0). In Cerro Huatulco, the monthly mean was of 339.5 individuals, with a maximum (2 916) in November and a minimum (0) in September and October, December to February and April. In El Apanguito, the monthly mean was of 1 309 individuals, with a maximum (4 092) in June and a minimum (0) in July and May.
Discussion
We obtained recapture rates higher than 10 % only for three bat species (C. perspicillata 15.79 %, A. toltecus 16.92 %, and M. megalophylla 13.17 %), and lower than 10 % for four species (G. soricina 2.36 %, P. mesoamericanus 5.51 %, P. fulvus 3.95 %, and 1.52 % for N. mexicanus); we did not record any recaptures for the other seven species. In the latter two cases, it was not possible to apply the Cormack-Jolly-Seber model or, if it was applied, the resulting estimations are not accurate. Thus, the implementation of new methodologies is necessary to obtain estimations with extremely low recapture rates as occur with large colonies of bats. In our study, the two most abundant species (P. fulvus with 2 369 individuals and P. mesoamericanus with 1 868 individuals) had such low recapture rates (3.95 % and 5.51 %, respectively, perhaps because they occupy other alternative refuges, since we have identified three caves near El Apanguito and Cerro Huatulco) that it was not possible to directly apply the model. However, with the methodology implemented in this study and taking the proportion between the number of captures and the estimated colony size of M. megalophylla, it was possible to estimate the colony size of the mormoopids P. fulvus and P. mesoamericanus, obtaining thus the largest colony sizes in El Apanguito with 6 609 and 4 092 individuals, respectively.
The specific ecological characteristics of each species, such as roost fidelity, use of alternative roosts, flight patterns, the echolocation abilities to detect the net, and large colony sizes make it difficult to obtain high recapture rates, which makes it difficult to estimate their colony sizes (Lewis, 1995; Storz, Balasingh, Nathan, Emmanuel, & Kunz, 2000; Godoy et al., 2002; Chaverri & Kunz, 2006). The overall recapture percentage (average 6.1 %) were similar to those reported in other studies in México, North America (United States 40 %, Stevenson & Tuttle, 1981; Canada 14 %, Norquay, Martinez-Núñez, Dubois, Monson, & Willis, 2013), and South America (Brazil 0 %, Zortéa, Bastos, & Acioli, 2015; 1 %, McCraken, 2003; 27.4%, Trajano, 1996). In this sense, for bat species with recaptures lower than 10 %, we consider it appropriate to use the approach applied in the present study, where colony size was estimated by using the proportions of the observed number and the number estimated for species with recapture percentages higher than 10 % that are ecologically similar and share the same roost. Although this method has not been applied before in bat species, it is to be expected that when subjected to the same environmental conditions they will show similar population sizes and, therefore, similar capture probabilities. Although it should be noted that the precision of this method should be proven in subsequent studies.
The estimations of colony size obtained with the Cormack-Jolly-Seber capture-recapture model are reasonable for the three studied species (M. megalophylla with 2 106 individuals throughout the year in El Apanguito and C. perspicillata with 684 individuals and A. toltecus with 183 individuals in La Mina) if we consider that the estimated values are within the range known of colony size for these species. For example, M. megalophylla is cave-specialist species that can form colonies from less than 1 000 individuals (Torres-Flores, López-Wilchis, & Soto-Castruita, 2012) to up to 500 000 individuals (Bonaccorso, Arends, Genoud, Canton, & Morton, 1992; Iñiguez-Dávalos, 2005). In the cave system Cuevas del Silvino in Guatemala, the colony size of this species was estimated to be of approximately 44 200 individuals using video cameras (Cajas-Castillo, Echeverría, & Trujillo, 2015). In the case of C. perspicillata and A. toltecus, low population sizes have been reported throughout their distribution area in Mexico (Jalisco, Iñiguez-Dávalos, 1993; Stoner, 2002; Querétaro, Navarro & León-Paniagua, 1995; Oaxaca, García-García, & Santos-Moreno, 2008), which could be related to specific requirements of the roosts such as temperature, humidity, air flow, or light intensity, the diversity of other available roosts, and the availability of food, which could limit the presence of large populations (over 1 000 individuals according to Arita, 1993). Artibeus toltecus, together with A. watsoni and S. hondurensis, apart from roosting in caves, also form small colonies in tents constructed with leaves, holes in trees, tunnels, cracks in rocks, and abandoned constructions (Kunz & McCracken, 1996; McCracken & Wilkinson, 2000; Chaverri & Kunz, 2006). Other species with large colony sizes were P. mesoamericanus and P. fulvus, with colony size estimations of over 20 000 individuals throughout the year in El Apanguito. These are cave-specialist species that can form colonies of thousands of individuals (Bonaccorso et al., 1992; Arita, 1993; Ortega, 2005). Other studies that have carried out estimations for these species, through direct observations in Mexico (Torres-Flores et al., 2012) and video cameras in Guatemala (Cajas-Castillo et al., 2015), have reported colonies of over 6 000 individuals for P. mesoamericanus and up to 98 600 individuals for P. fulvus (Cajas-Castillo et al., 2015). In the case of N. mexicanus, we captured 199 individuals and estimated a colony size of 2 636 individuals in El Apanguito, 66 in Cerro Huatulco, and 52 in La Mina. This species has been observed to form colonies of up to 5 000 individuals, but it is generally found in colonies between 100 and 200 individuals (Torres-Flores & López-Wilchis, 2010). Finally, the estimated colony size of G. soricina was of 833 individuals in La Mina and 704 individuals in Cerro Huatulco. For this species, estimated colony sizes have been of less than 500 individuals in other caves in Mexico (Torres-Flores et al., 2012). Therefore, the estimates obtained in this study are higher than those estimated in other areas, so the precision and usefulness of this method should be tested in the future. We found considerable variation in the monthly estimations of the species recorded in all three roosts, which suggests that the composition of the colonies exhibits considerable dynamics (Hristov et al., 2010).
The total estimated number of bats in the three studied roosts was 20 105, with higher concentrations in El Apanguito (13 615 individuals) and Cerro Huatulco (4 074 individuals). These estimations, together with high species richness, reproduction processes, and occupation dynamics between these roosts (Hernández-Aguilar & Santos-Moreno, 2020a; Hernández-Aguilar & Santos-Moreno, 2020b), allow us to propose these sites as Bat Protection and Conservation Areas in Mexico. We also recommend continuing to monitor the bat populations of these sites and, if possible, implementing other methods to evaluate the accuracy of our estimations.
Some studies have demonstrated that the use of video cameras to record bats emerging from roosts (Escalona-Segura, Vargas-Contreras, & Sosa, 2002; Vargas-Contreras, Escalona-Segura, Arroyo, Rendon Von Osten, & Navarro, 2012; Cajas-Castillo et al., 2015) and the incorporation of acoustic recordings (Kloepper et al., 2016) could be techniques that may produce robust estimations of size of bat colonies. Thus, further studies using these techniques could complement our results or even improve estimates of the number of bats that use the roosts, as well as provide the tools that allow to establish priority criteria for the conservation of roosts and bats in the area.
Even though recent advances, such as digital photography and image analysis, in some cases allow estimating the number of individuals emerging from a roost (Corso, Woolley, & Lacher, 2010), they do not allow to determine the species identity and, thus, it is not possible to know the colony size of each species, except in cases where the roost includes only one species. This is the same limitation of passive acoustic methods (Kloepper et al., 2016), thermal detection systems (Otálora-Ardila et al., 2020), and thermal infrared imaging and computer vision analysis (Hristov et al., 2010). The Light Detection and Ranging (LiDAR) scanning system allows to estimate the number of individuals per species by scanning the roosts and visually recognizing and labelling the areas occupied by each species (Shazali et al., 2017); however, the cost of this system is currently too high for its generalized use. Very recently, genetic tag-recapture methods are expensive but seem to offer advantages over other more invasive methods, although it is only recommended for species that show high fidelity to the refuge and that do not form colonies of thousands or millions of individuals (Oyler-McCance et al., 2018). Therefore, we consider that the estimation method used in the present study provides a low-cost, and reasonably reliable option for the estimation of bat colony size, especially for roosts occupied by more than one species.
Ethical statement: authors declare that they all agree with this publication and made significant contributions; that there is no conflict of interest of any kind; and that we followed all pertinent ethical and legal procedures and requirements. All financial sources are fully and clearly stated in the acknowledgements section. A signed document has been filed in the journal archives.

