


 English (pdf)
 Article in xml format
 Article references
 Send this article by e-mail
 Cited by SciELO
  Similars in
SciELO
Similars in
SciELO  uBio
uBio 
 Permalink
Introduction
Coral reef ecosystems develop and prosper within the oligotrophic tropical and subtropical oceans (Nelson, Alldredge, McCliment, Amaral-Zettler, & Carlson, 2011) and are considered among the most productive marine-costal ecosystems. In them, several species of fishes, mollusks and crustaceans of commercial interest complete their development; therefore, they are economically important for the communities surrounding coral reefs.
In coral reefs, as in other marine systems, the major energy flux comes from the pelagic-benthic coupling, where zooplankton play the principal role due to diel migration patterns undertaken by many of these organisms (Schnack-Schiel & Isla, 2005). The coral reef zooplankton is represented by complex assemblies from different sources: resident species, demersal migratory species, holozooplankton species from oceanic waters transported onto the reef, and merozooplakton reef species (Heidelberg, Sebens, & Purcell, 2004). Variations in zooplankton assemblies can reflect environmental alterations more effectively than the environmental variables themselves (Richardson, 2008), due to the sensitivity of organisms to small changes in the environment (Sabatini, 2008).
Isla del Coco is an oceanic island located in the Eastern Tropical Pacific (ETP) about 500km from the Costa Rican Pacific coast (Cortés, 2008). The island is surrounded by a complex of several coral reefs (Alvarado et al. 2016), from where two new species of monstrilloid copepods (Suárez-Morales & Morales-Ramírez, 2009) and a new species of pontellid copepod were described recently. However, community structure and distribution of zooplankton in this system remains unknown.
The first attempt to describe the zooplankton community in Isla del Coco was carried out by Morales-Ramirez (2008), who recognized 11 taxonomic groups and 136 species. Other works have focused on specific organisms such as holoplanktonic polychaetes (Jiménez-Cueto, Suárez-Morales, & Morales-Ramírez,2012), hyperiid amphipods (Gasca & Morales-Ramírez, 2012), parasitic copepods (Suárez-Morales & Gasca, 2012), appendicularians and chaetognaths (Castellanos, Hernández, Morales-Ramírez, & Corrales,2012).
Several studies have described the zooplankton composition and diversity in oceanic islands (Mujica, 1993, Mujica, 2006a, Mujica, 2006b). However, the information on the coral reef zooplankton in these areas is limited. Zooplankton is a major link in the food webs of coral reefs and a key source for allochthonous nutrients for corals (Yahel, Yahel, & Genin, 2005). The complex zooplankton diversity provides reef ecosystems with substantial nutrient inputs for coral reef fishes, corals and other predators (Heidelberg, O’Neil, Bythell, & Sebens, 2010). The diel migration patterns of the coral reef zooplankton increase both the biomass and abundance at night, thus becoming an important energy source for plankton feeders like corals (Nakajima, Yoshida, Othman, & Toda, 2008; Nakajima, Yoshida, Othman, & Toda, 2009; Heidelberg et al., 2010). Zooplankton provide inorganic nutrients and vitamins which cannot be obtained by the corals through zooxanthellae photosynthesis (Sebens, 1987).
Given the role of zooplankton in coral reef food webs and their susceptibility to small changes in environmental variables, this study aims to provide data on the composition, abundance and biomass of meso- and macrozooplankton in three coral reef systems of Isla del Coco. Based on a statistical analysis we evaluated changes in community structure related to fluctuations in temperature, salinity and dissolved oxygen.
Materials and methods
Study site: Isla del Coco is an oceanic island located 500 km southwest from the Pacific coast of Costa Rica, in the Eastern Tropical Pacific (ETP) (5º32’N-87º04’W). It has 24 km2 of land and 1997 km2 of marine surface. In 1978 it was declared a National Park and UNESCO deemed it as a Human Heritage site in 1997 (Cortés, 2008). The island is influenced by the North Equatorial Countercurrent (NECC), with a seasonal variation in its intensity (Lizano, 2008). The west-east flow carries water and plankton from the central Pacific Ocean to the American coast; thus, Isla del Coco is primarily affected by the NECC and therefore it is the first point for species establishment and distribution in the ETP (Cortés, 2008).
Sampling: Zooplankton samples were collected in March 2009, April 2010, July 2011 and March 2012, in three bays, Wafer, Weston and Chatham, along the northern coast of the island (Fig. 1). Porites lobata is the most abundant coral in Isla del Coco; the bottom in Weston Bay is covered mainly by turf and Chatham Bay is the reef with the highest coverage of sand (Alvarado et al. 2016).
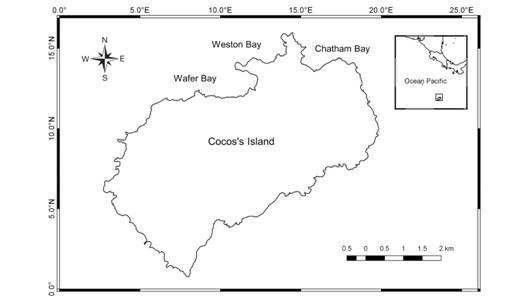
Fig. 1 Locations of zooplankton samplings over coral reefs in three bays at Isla del Coco National Park (2009-2012).
Samples were collected for two or three days during the morning, noon and sunset whenever possible from horizontal trawls above the coral reefs, using conical zooplankton nets (mouth diameter 0.49 m, 2 m long, mesh sizes 200 and 500 µm) with a plastic cup. Trawling lasted three minutes for the 200 µm net, and five minutes for the 500 µm, at approximately 1.5 km h-1. Hauls were performed making a circle trying to cover the greatest possible area of the coral reef. Before zooplankton sampling, data on water temperature and dissolved oxygen were taken with a multiparameter sonde and salinity was measured with a refractometer. The variables were measured on both the surface and the bottom.
Samples were fixed in 4% formaldehyde/sea water solution.
Quantitative and qualitative analysis: Once in the laboratories of CIMAR-UCR, the original samples were fractioned to 1/2, 1/4 and 1/8 subsamples, depending on sample concentration, using a Folsom splitter (McEven, Johnson & Folsom, 1954). The remaining fraction used for quantitative analysis and identification was preserved in 70% ethanol. A minimum of 400 organisms were counted from aliquots taken from the fraction, and emphasis was given to copepod species identification. The volume of water filtered by the net was obtained using the formula S=V/t, where S is the distance, V is velocity and t is time; Vol=AS, where A is the net mouth area. Filtered volumes of 17.45 m3 and 29.08 m3 were obtainedfrom the 200 and 500 µm nets, respectively. Abundance was expressed as individuals m-3, and values are given by mean followed by standard deviation.
Zooplankton biomass calculation: Following Boltovskoy (1981) dry weight biomass (DW) was calculated, using a fraction of the original sample obtained with a Folsom splitter. The fraction was filtered using GF/C pre-weighed filters. The filters with the sample were dried at 60ºC for 24 hours, and weighed in an analytical balance ±0.0001. Biomass is expressed as mg DW m-3.
Statistical analysis: In order to perform the statistical analyses, DW biomass and numerical abundance were standardized through log (x+1). When physical and chemical data were used together they were transformed through mean and standard deviation. Normality of the data was tested using the Shapiro-Wilk test and homoscedasticity was tested using the Bartlett test.
Similarities of the zooplankton community composition among years and sample sites were tested by ANOSIM in Primer 6 software (Clarke & Gorley, 2006), using Bray-Curtis distance. To test similarities among each sample site according to community structure, we performed a cluster analysis using a Bray-Curtis distance (Clarke& Gorley, 2006). A Mantel test was done to determine the influence of physical and chemical variables on the zooplankton community structure. If such a relationship was confirmed, a Locally Weighted Scatterplot smoothing (LOESS smoothing) using PAST software (Hammer, Harper & Ryan,2001) was performed to visualize the changes in similarity of the community according to variation in environmental variables; euclidean distance was used for physical and chemical data and Bray Curtis distance for biological data. The relationship between abundance and DW biomass in sample sites through time was tested with ANCOVA using the PAST software. An ANOVA without replicas (Quinn and Keough, 2003) in R software (R Development Core Team, 2013) was performed to test if DW biomass and zooplankton abundance show significant differences through time.
Results
Physical and chemical variables: Water temperature, salinity and dissolved oxygen showed typical values for tropical Pacific waters during the four years (2009-2012) of this study.Temperatures varied from 29 to 30°C and were highest in 2012; salinity values varied from 31 to 33 psu and the highest value was registered in 2011; dissolved oxygen ranged from 4.4 to 6.3mg/l and the highest values were recorded in 2012 (Table 1).
Table 1 Values of physical and chemical features during zooplankton sampling in three bays at Isla del Coco National Park, Costa Rica (2009-2012)
| Site | Year | Salinity | Temperature (˚C) | Dissolved oxygen (mg/L) |
| Wafer | 2009 | 32,5 | 29,5 | 6,30 |
| 2010 | 31,0 | 28,9 | 5,50 | |
| 2011 | 31,0 | 28,2 | 6,60 | |
| 2012 | 30,0 | 29,3 | 5,17 | |
| Weston | 2009 | 31,0 | 29,5 | 4,30 |
| 2010 | 31,0 | 29,3 | 3,90 | |
| 2011 | 32,5 | 27,7 | 4,42 | |
| 2012 | 33,0 | 27,8 | 4,53 | |
| Chatham | 2009 | 33,0 | 27,8 | 4,77 |
| 2010 | 32,0 | 30,1 | 6,27 | |
| 2011 | 33,0 | 30,1 | 6,30 | |
| 2012 | 32,0 | 30,1 | 6,32 |
Community composition: In total, 21141 organisms were counted and analyzed, 10752 for macrozooplankton and 10389 for mesozooplankton. For macrozooplankton 24 taxonomic groups and 112 taxa were identified. Copepods were the most abundant taxon in 2009 and 2012, representing 59% and 57% of total abundance; however, in 2010 other groups such as chaetognaths and appendicularians were sampled in higher numbers, and the proportion of copepods decreased to 44%. In 2011 the abundance of chaetognaths (36%) exceeded that of copepods (35%). Ichthyoplankton had relatively high abundance through time, 13% in 2010 and 8% in 2011. Mysids increased from 0% in 2009 to 11% in 2012 (Table 2).
TABLE 2 Percentage of abundance for each zooplankton group per year, for macro- and mesozooplankton at Isla del Coco National Park (2009-2012)
| Year | 2009 | 2010 | 2011 | 2012 | |||||
| Taxa | Macro | Meso | Macro | Meso | Macro | Meso | Macro | Meso | |
| Medusae | 0,04 | 0,06 | 0,07 | 0,03 | 0,28 | 0,00 | 0,00 | 0,00 | |
| Siphonophora | 4,25 | 0,24 | 5,42 | 0,20 | 2,37 | 0,12 | 0,97 | 0,33 | |
| Polychaeta | 0,04 | 0,00 | 0,18 | 0,32 | 0,28 | 0,28 | 0,06 | 0,08 | |
| Bivalvia | 0,17 | 0,73 | 0,36 | 5,68 | 0,00 | 0,04 | 0,00 | 1,42 | |
| Pterotracheoida | 0,33 | 0,00 | 0,18 | 0,03 | 1,35 | 0,37 | 0,73 | 2,34 | |
| Pteropoda | 0,99 | 2,45 | 3,03 | 4,44 | 2,19 | 1,18 | 1,52 | 8,20 | |
| Cephalopada | 0,04 | 0,00 | 0,00 | 0,00 | 0,00 | 0,00 | 0,00 | 0,00 | |
| Cladocera | 2,06 | 0,24 | 0,14 | 0,06 | 0,00 | 0,00 | 0,03 | 0,08 | |
| Ostracoda | 0,00 | 0,06 | 0,04 | 0,12 | 0,05 | 0,00 | 0,09 | 0,17 | |
| Copepoda | 58,91 | 82,91 | 43,61 | 69,67 | 35,43 | 87,14 | 57,18 | 72,13 | |
| Nauplio | 0,08 | 0,58 | 0,04 | 0,81 | 0,09 | 1,71 | 0,12 | 3,01 | |
| Cirripedia | 0,00 | 0,00 | 0,00 | 0,00 | 0,09 | 0,00 | 0,03 | 0,08 | |
| Stomatopoda | 0,04 | 0,00 | 0,07 | 0,00 | 0,14 | 0,04 | 0,00 | 0,00 | |
| Myscidacea | 0,00 | 0,00 | 0,00 | 0,00 | 2,61 | 1,42 | 10,65 | 0,33 | |
| Amphipoda | 0,83 | 0,06 | 0,32 | 0,12 | 0,79 | 0,16 | 0,88 | 0,00 | |
| Isopoda | 0,00 | 0,00 | 0,00 | 0,03 | 0,00 | 0,00 | 0,00 | 0,00 | |
| Euphausiacea | 5,07 | 0,95 | 4,01 | 0,69 | 1,72 | 0,08 | 0,47 | 0,00 | |
| Decapoda | 4,17 | 0,52 | 3,83 | 0,26 | 4,56 | 0,33 | 6,07 | 2,85 | |
| Chaetognatha | 9,20 | 1,71 | 11,88 | 3,32 | 35,61 | 5,33 | 7,95 | 1,59 | |
| Larvacea | 1,65 | 7,07 | 13,94 | 13,49 | 2,89 | 1,22 | 1,41 | 5,27 | |
| Salpida | 0,95 | 0,00 | 0,07 | 0,00 | 0,28 | 0,00 | 0,18 | 0,00 | |
| Doliolida | 0,50 | 0,15 | 0,00 | 0,00 | 1,58 | 0,33 | 0,56 | 0,00 | |
| Fish egg | 8,70 | 0,49 | 9,31 | 0,14 | 7,31 | 0,24 | 10,47 | 1,59 | |
| Fish larvae | 1,98 | 1,75 | 3,50 | 0,61 | 0,37 | 0,00 | 0,65 | 0,50 | |
A total of 48 copepods species were identified, Sapphirinidae being the family with the highest number of species (8 spp.). Sapphirina was the most diverse genus (6 spp.). In other families, such as Corycaeidae and Calanidae, four species were identified. Undinula vulgaris was the most common species during the four years with an average of 52.2±40.2 ind m-3 (4.47%).
In the mesozooplankton samples 19 taxonomic groups and 81 taxa were identified. Copepods were the most abundant taxon throughout the years of the study, accounting for 69% in 2010 to 87% in 2011. The second most abundant taxa included Appendicularia in 2009 (7%) and 2010 (13%), Chaetognatha in 2011 (5%) and Mollusca in 2012 (12%) (see Table 2). A total of 39 copepod species were identified, Corycaeidae having the highest number of species (two genera, 6 spp.); Calanidae and Candacidae were represented by four species each. Paracalanus aculeatus was the species with the highest abundance during the four years with an average of 1063.6±779.9 ind m-3 (4.86%).
Zooplankton temporal variation: The zooplankton community assemblies for macrozooplankton and mesoozooplankton did not show differences between years (ANOSIM, R=23.8%, p=0.187) (ANOSIM, R=8.60%, p=0.335) or bays (ANOSIM, R=0.00%, p=0.455), (ANOSIM, R=8.30%, p=0.663), respectively. However, variations in surface water temperature, salinity and dissolved oxygen caused unequal abundances (ind m-3) between years resulting in a less similar community structure of macrozooplankton (r=0.34, p=0.004) (Fig. 2A). The same changes were registered for mesozooplankton (r=0.35, p=0.0040) (Fig. 2B). The taxa that most contributed to those changes were: Mysida 2.55%, Canthocalanus pauper 2.51%, copepodites 2.16%, Subeucalanus 2.12% in macrozooplankton, and Clausocalanus copepodite 2.58%, Limacina spp. 2.28%, and Mysida 2.16% in mesozooplankton samples.
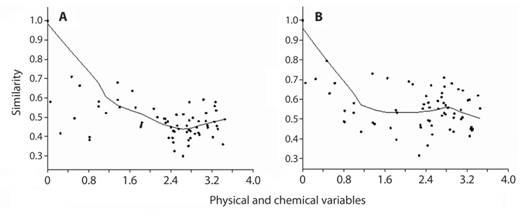
Fig. 2 Relationship between changes in environmental variables and similarity of zooplankton community, (A) for 500 μm net mesh and (B) for 200 μm net mesh, Isla del Coco National Park (2009-2012).
Abundance and biomass: Macrozooplankton abundance reached the highest values in 2012 with 2090.79±750.97 ind m-3 and the lowest in 2010 with 368.41±750.97 ind m-3. Among bays, the highest mean abundance was at Chatham bay in 2012 with 3302.03±1290.37 ind m-3 and the lowest was found at Wafer bay in 2011 with 190.33±797.72 ind m-3 (Fig. 3A).There were no significant differencesin abundance during different sampling years (ANOVA, F=1.26, d.f.=7, p=0.368) or between sample sites (ANOVA, F=0.14, d.f.=7, p=0.874). The highest mean biomass was observed in 2012 with 9.6±3.8 mg DW m-3, and the lowest occurred in 2010 (1.8±3.8 mg DW m-3). Among bays, the highest DW biomass was observed in Chatham bay in 2012 (16.9±4.3 mg DW m-3) whereas the lowest values were recorded in Wafer bay (Fig. 3B). There were no significant differences in biomass between years (ANOVA, F=0.114, d.f=7, p=0.949) or sample sites (ANOVA, F=0.0596, d.f=7, p=0.943).
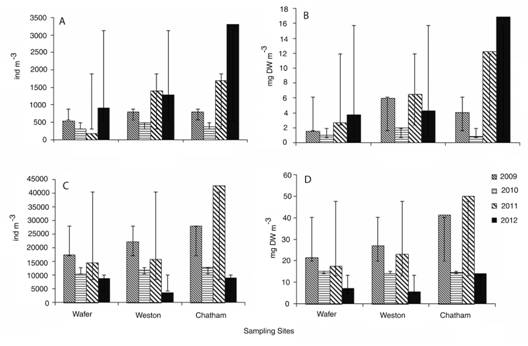
Fig. 3 (A) Average density of organisms and (B) average biomass per year and sample location for zooplankton sampled with 500 μm net mesh. (C) Average density of organism and (D) average biomass per year and sample location for zooplankton sampled with 200 μm net mesh. Isla del Coco National Park, 2009-2012.
The highest mean abundance for mesozooplankton was recorded in 2011 with 26302.06±9123.21 ind m-3 and the lowest in 2012 with 7137.59±9123.21 ind m-3. Among bays, Chatham had the highest mean abundance, reaching 42781.30±15975.80 ind m-3, and the lowest was found in 2012 at Weston bay with 3666.97±3007.16 ind m-3 (Fig 3C). Zooplankton abundance showed significant differences between sample years (ANOVA, F=33.79, d.f.=7, p=0.001) and between bays (ANOVA, F=5.78, d.f.=7, p=0.040). Zooplankton showed its highest DW biomass mean value in 2009 (28.8±21.7 mg DW m-3); the lowest was in 2012 (8.9±21.7 mg DW m.3). DW zooplankton biomass was highest in Chatham bay in 2011 (50.1±17.3 mg DW m-3), whereas the lowest value was observed in Weston bay in 2012 (5.7±4.4 mg DW m-3); in 2010 DW biomass values were similar in the three bays (Fig. 3D). Biomass showed significant differences between years (ANOVA, F=15.44, d.f=7, p=0.00315), and between sample sites (ANOVA, F=6.18, d.f=7, p=0.0348).
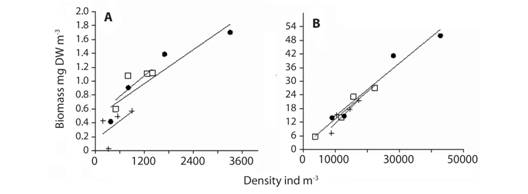
Macro and mesozooplankton biomass and abundance were positively correlated among bays and years (ANCOVA, F=0.33, p=0.729), (ANCOVA, F=0.15, p=0.880) respectively (Fig. 4).
Discussion
Zooplankton richness and taxonomic composition: The Isla del Coco waters are characterized by a typical epipelagic copepod fauna, dominated by calanoid species. Zooplankton density is dominated by mesozooplankton organisms and variations in physical and chemical variables influence the zooplankton community composition in Isla del Coco coral reefs.
The composition of coral reef zooplankton in Isla del Coco is similar to that found it in other oceanic islands. In this study Calanoida showed the highest number of species followed by Poecilostomatoida. These results are similar to those of Melo et al., (2010) where in the Saint Peter and Saint Paul archipelago in the Atlantic Ocean a higher number of calanoid copepod species were found, followed by Cyclopoida , and U. vulgaris and P. aculeatus were the most common species, followed by the oncaeids and corycaeids. Suarez-Morales & Gasca (2000), in the Mexican Caribbean, found U. vulgaris to be the most representative species in the reef, and this species in particular has been described as indicating the extent of the oceanic influence in the reef environments (Renon, 1993). Copepods belonging to the genera Paracalanus, Oithona and Oncaea were dominant components of the coral reef copepod community in the Redang and Tioman islands, Malaysia (Nakajima et al, 2008, Nakajima et al,2009), similar to the results found in our study. The study by Mujica (1993) in Eastern Island show similar results to this study, where copepods had the highest abundance, followed by chaetognaths, euphausids and lower abundances of decapod larvae and ichthyoplankton. Our study differs from that of Mujica (1993) in that the latter found a greater number of euphausids, 8.54% as opposed to 1 to 4% in our study, and an appendicularian abundances of 2% in Easter Island versus 5 to 7% in Isla del Coco.
Some differences can be found between Isla del Coco zooplankton assemblages and continental coral reef systems, where decapod larvae and zoeae constitute important taxa after copepods, as was recorded by Guzmán & Obando (1988) in Isla del Caño, Costa Rica, and in the Yucatan Península, Mexico (Castellanos Osorio & Suarez-Morales, 1997). Groups like ichthyoplankton and molluscs show similarities in abundance in both coral reef systems. Comparing Isla del Coco with other insular coral reef systems under oceanic influence, similarities in community composition and abundance are found, copepods, appendicularians and chaetognaths being the three major groups in terms of abundance, as was recorded by Hamner, Colin & Hamner (2007) in Palau, Nakajima & Yoshida (2008) in Tioman Island, Malaysia, and Nakajima, Yoshida, Otman & Toda (2008) in Redang Island, Malaysia.
Differences in community structure of macro- and mesozooplankton were found with respect to variations in physical and chemical variables (water temperature, salinity and dissolved oxygen). Similar results were found in Culebra Bay, Costa Rica, where appendicularians, zoeae, naupli and two copepod species showed a positive correlation with dissolved oxygen, while copepods and ostracods species were correlated with salinity (Bednarski & Morales-Ramírez, 2004). Geographic and oceanographic conditions in an area could cause saline and thermic variations, not detectable on a large scale but important for some organisms. Changes in the relative abundance of some taxonomic groups of zooplankton groups reflect local changes in salinity, temperature, light, density, water circulation and other physical and biological factors. This environmental variation on a temporal and spatial scale causees changes in the number, abundance and diversity of zooplankton taxa (Hernández-Trujillo, Esqueda-Escárcega, G & Palomares-García,2010).
A higher number of macrozooplankton taxa agrees with the results of Tseng, Dahms, Hung, Chen & Hwang,(2011) in the China Sea, where the highest number of taxa were collected with larger mesh net size (330 µm). Although larger mesh net size (>200 µm) underestimates the number of relatively small copepod species, their copepodites (e.g. Acartia, Calocalanus, Clausocalanus) and many harpacticoids (Gallienne & Robins, 2001), thin mesh net size can cause an underestimation of larger taxa (i.e. copepods of 2 mm or more) due to the generated current, the filtering efficiency and evasion by larger organisms (Fleminger & Clutter, 1965; Tseng et al.,2011; Makabe et al.,2012).
A high abundance of larvaceans was recorded in a coral reef system in Malaysia, reaching second place after copepods (Nakajima, Yoshida, Othman & Toda, 2014). These densities could be linked to an increase in pico and nanoplakton, which in turn might increase the number of Appendicularia (Arevana& Palma, 2002), but there are no data in situ to support this possibility. However, through satellite data Lizano (2008) reported the influence of a bloom near the Costa Rican coast from January to March in the Isla del Coco, increasing phytoplankton concentrations, a situation that could be favorable to the appendicularians, with an increased abundance in April after the bloom.
The higher densities of Chaetognatha in 2011 could be explained by the availability of prey such as appendicularians and copepods, since chaetognaths feed mainly on appendicularians and copepods (Froneman & Pakhomov, 1998; Tönneson & Tiselius, 2005). Flaccisagitta enflata, a common chaetognath species in the Isla del Coco (Morales-Ramírez, 2008), showed a feeding preference for larvaceans and copepods (Lie & Wong, 2012), suggesting that this feeding behavior could have an impact on the composition of zooplankton communities and influence the abundance of copepods (Froneman, Pakhomov, Perissinotto, & Meaton, 1998; Giesecke & González, 2004).
Dry weight biomass: The DW biomass was dominated by the mesozooplankton community, but in 2012 the macrozooplankton community surpassed the mesozooplankton, which could result from a succession of larger over small-bodied organisms. When available food concentrations rise, the biomass of small organisms may increase as a response to phytoplankton production, reflected later in time by an increase in biomass of larger bodied organisms (Suárez-Morales & Gasca, 1994). In the Sargasso sea a succession of macrozooplankton over mesozooplankton was observed, with increased macrozooplankton biomass through time, suggesting that predation is more important than food availability in controlling the populations of small herbivores (Davis & Wiebe, 1985). Predation control over small zooplankton herbivores has been documented in coastal regions (Davis, 1984), and it could be an important mechanism in oligotrophic oceanic regions where food supply is low (Hayward & McGowan, 1979). A positive correlation between zooplankton density and DW biomass was expected and has been reported in others studies, including in the Balearic Sea (Fernández de Puelles et al. 2003). This correlation is more significant in nets with the smallest-sized mesh where density and biomass are higher (Buskey, 1993; Auel & Hagen, 2002), thus supporting our results, due to small-sized organisms characteristic of oligotrophic waters.
Our results showed that small organisms dominated the DW biomass at Isla del Coco coral reefs, but under certain oceanographic conditions a succession of larger over small-bodied organisms could increase macrozooplankton biomass due to predation of large organisms on small ones.
Another factor that could have affected zooplankton abundance and biomass during the study was the influence of El Niño-Southern Oscillation (ENSO) in 2010 (Sarachik & Cane, 2010). Changes in biomass, lower abundances and species shifting are some of the implications of ENSO on the zooplankton community (Gómez-Gutierrez, Palomares-García, & Gendron, 1995; González, Sobarzo, Figueroa, & Nöthig, 2000). The low abundance of copepods in samples taken with the 500 µm mesh net during 2010 and 2011 was due to the large number of Appendicularia and Chaetognatha. Appendicularia increased its abundances in 2010. During the present study, in 2010 both biomass and abundance declined in almost every sample station. Similar results were found by Kozak, Franco-Gordo, Suárez-Morales, and Palomares-García (2014) in the ETP, who recorded a significantly lower abundance of copepods during the ENSO period in 1997-1998. The same situation was reported in the Oregon coast during the same ENSO event where, besides the decline in biomass and abundance, there was a shift in copepod species, winter species being replaced by summer species as a consequence of warming waters (Peterson, Keister, & Feinberg 2002). However, the present study did not find a shift in species composition.
The results of this study show that coral reef zooplankton in Isla del Coco is typical of that of tropical and subtropical insular oceanic and coral reef lagoons under oceanic influence, characterized by high abundances of calanid copepods, chaetognaths and larvaceans. Zooplankton community composition in Isla del Coco did not show differences during the four seasons of sampling, but zooplankton biomass and abundance was apparently affected by season and oceanographic conditions. Additional efforts must be made to learn more about the dynamics of zooplankton in oceanic islands and understand the effect of islands in a world of global change.
Ethical statement: authors declare that they all agree with this publication and made significant contributions; that there is no conflict of interest of any kind; and that we followed all pertinent ethical and legal procedures and requirements. All financial sources are fully and clearly stated in the acknowledgements section. A signed document has been filed in the journal archives.

