


 English (pdf)
 Article in xml format
 Article references
 Send this article by e-mail
 Cited by SciELO
  Similars in
SciELO
Similars in
SciELO  uBio
uBio 
 Permalink
Introducción
Heavy metals released into aquatic ecosystems from industrial, agricultural, and domestic sources, municipal sewage treatment plants, and from other anthropogenic activities have the potential to bioaccumulate at various trophic levels and can induce damage in DNA (Mitchelmore & Chipman, 1998; Ohe, Watanabe, & Wakabayashi; 2004, Bolognesi, Perrone, Roggieri, Pampanin, & Sciutto, 2006; Isani et al., 2009; Sharifuzzaman et al. 2016). Thus, given the extreme toxicity of heavy metals, understanding their effects in aquatic ecosystems is of significant importance.
Mercury is one of the most dangerous heavy metals, causing deleterious effects on biota (W.H.O., 1990; Buhl, 1997; Rocha et al. 2011a; Anual, 2014; Nabi, 2014; Kandroo, Tripathi, & Sharma, 2015; Morcillo, Esteban, & Cuesta, 2017). This toxicant interferes with the formation of the mitotic spindle during cell division, causing the contraction of chromosomes, a delay in the division of the centromere, and a slower movement during anaphase, as well as chromosomal breakage (Skerfving, Hansson, & Lindsten, 1970; Catherine Ferens & United States, 1974; Thier, Bonacker, Stoiber, & Böhm, 2003). Chromatin fragments derived from chromosomal breakage (clastogenic event) or spindle dysfunction (aneugenic event), or even whole chromosomes in the case of chromosome lag, do not migrate to the poles during anaphase and are included in the daughter cells, becoming encapsulated into a separate smaller nucleus, generally referred to as a micronucleus (Miller,1973; Miller et al., 1998; Wirzinger, Weltje, Gercken, & Sordyl, 2007).
Fishes have a greater ability to metabolize xenobiotics, accumulate pollutants, and are capable of inhabiting practically all zones of the aquatic habitat. In addition, unlike mammals, fish erythrocytes are nucleated and have been shown to be more sensitive to the induction of DNA damages (Mir et al., 2014). These characteristics make them an excellent model for assessing the potential danger of chemicals introduced into the aquatic environment. Indeed it has been shown that after exposure to different pollutants under field and laboratory conditions the peripheral erythrocytes of fishes have a higher incidence of micronuclei formation (Al-Sabti & Hardig, 1990; Heddle et al., 1991; Vanparys, Deknudt, Vermeiren, Sysmans, & Marsboom, 1992; Torres de Lemos, Rödel, Terra, D’Avila de Oliveira, & Erdtmann, 2007; Ali, El-Shehawi, & Seehy, 2008; Yadav & Trivedi, 2009; Monteiro, Cavalcante, Viléla, Sofia, & Martinez, 2011; Özkan, Gündüz, Berköz, & Hunt, 2011; Bakar, Ashriya, Shuib, & Razak, 2014; Fatima et al. 2014; Vignardi et al, 2015; Ivanova & Popovska-Percinic, 2016). Therefore, fishes are suitable organisms in which to evaluate the clastogenic and aneugenic effects of genotoxic compounds, with the assay being called the micronucleus test (MNT), a widely applied method due to its simplicity, reliability, sensitivity, and adaptive suitability (Carrasco, Tilbury, & Myers, 1990; Al-Sabti & Metcalfe, 1995; Udroiu, 2006; Junín, Rodríguez, Heras, & Braga, 2008). Indeed, research on clastogenic or mutagenic effects in neotropical fish has become increasingly common (Cestari et al., 2004; Rocha et al., 2011b; Zapata et al., 2016).
Some authors have observed, in addition to micronucleated erythrocytes (MNE), the occurrence of other nuclear abnormalities (ENAs), such as blebbed, lobed, binucleated, and notched nuclei, suggesting that these anomalies should be considered analogous to MNs, and, therefore, should be taken into consideration as potential indicators of cytotoxicity (Carrasco et al., 1990; Ayllon & Garcia-Vazquez, 2000, 2001; Çavaş & Ergene-Gözükara, 2003, 2005; da Silva Souza & Fontanetti, 2006; Matsumoto et al., 2006; Ergene et al., 2007; Jiraungkoorskul et al., 2007; Costa et al., 2008; Monteiro et al., 2011; Tasneem & Yasmeen, 2018). Our preliminary, unpublished observations, showed a significant proportion of erythrocytes with notched nuclei in fish exposed to mercury, leading us to investigate if this nuclear anomaly could be effectively employed as a genotoxic marker. Thus, in the present study, we assessed the proportion of MNE and notched erythrocytes (NE) after the administration of mercury chloride in Andinoacara rivulatus (Günther 1860), a freshwater teleost fish naturally distributed from the north of Ecuador to the north of Peru, and also spread throughout the world as an aquarium pet colloquially known as Vieja Azul or Green Terror.
MATERIALS AND METHODS
All specimens used in this study were acquired from a stock obtained via induced reproduction that is carried out by the repopulation program of the species in La Tembladera Wetland, in El Oro Province of Ecuador (http://asogrotem.org/). Fish were transported in plastic bags to the laboratory and acclimated for 24 h.
Bioassay, blood sampling and smear preparation: Fish were divided into four groups of 16 individuals, and each group was placed in separate aquaria (140 L) provided with filtered water and constant aeration. Fish were not fed while the test was ongoing. Mercury chloride (HgCl2) was administered by a single intraperitoneal (IP) injection (Al-Sabti & Metcalfe, 1995). Concentrations of 20, 50, and 100 µg/ml of mercury were used in a ratio of 0.5 ml of solution per 100 g of weight (0.1, 0.25, and 0.50 mg HgCl2/Kg). Fish from the control group were injected with a physiologic solution. The mercury doses tested were chosen considering the mercury content (mg/kg) reported in some freshwater species of teleosts (Cyprinus carpio Linnaeus 1758, 0.1-0.5, max. 0.8; Gambusia affinis (Baird & Girard 1853), max. 0.5; Lepomis macrochirus Rafinesque 1819, 0.1-0.3, max. 0.41; Micropterus salmoides (Lacepède 1802) 0.35-0.85, max. 1.9) (Saiki, Jennings, & May, 1992). Four individuals from each group were randomly selected every 24 h until 96 h, and peripheral blood smears were prepared by draining blood via caudal vein puncture using a syringe without anticoagulant. All the fish were anesthetized with benzocaine before blood extraction. The fish of the control group were immediately released while the fish injected with mercury were euthanized with anesthetic overdose, incinerated and the ashes placed in plastic bags and buried in a landfill. Smears were air-dried, fixed in absolute ethanol for 20 min, and stained with 10 % Giemsa in phosphate buffer (pH 6.88) for 20 min. Three slides per fish were mounted using Canada balsam and archived until evaluation. The procedures were conducted in accordance with Institutional Authorization Research Project 396/2016, Universidad Técnica de Machala and Protocol number 1027 for experiments with animals of Universidade Estadual Paulista “Julio de Mesquita Filho”.
Cell scoring: On each plate, a series of 15-20 photographs were taken at random with an Olympus BX53 photomicroscope (1 000 x magnification) to guarantee that no fewer than 1000 cells/slide were counted. Scoring was performed on the digital images by a single observer. The frequencies of MNE and/or NE were expressed per 1 000 counted cells.
Statistical analysis: Levene’s and Kolmogorov-Smirnov tests were applied to check the homoscedasticity and normality, respectively. Since data obtained did not present a normal distribution and violated the homogenous variance principle for both MNE and NE frequencies, they were square root transformed to normalize and homogenize the variances. Then, data were analyzed by two-way ANOVA and Fisher's Least Significant Difference (LSD) post-hoc test (P≤ 0.05) for comparison of differences among groups. The relationship between MNE and NE frequencies was analyzed using linear regression analysis by the least squares method. Pearson’s correlation coefficients were calculated between NE and MNE. The entire analysis was done with the statistical package STATGRAPHICS® Centurion XVI (version 16.1.18).
RESULTS
Fish exposed to 0.50 mg/kg of HgCl2 died progressively during the period of the experiment. At 96 h only one fish was still alive in this group. Therefore, data from this group were excluded for statistical analysis. The analysis of peripheral blood smears of the studied fish showed that normal erythrocytes appeared with an oval shape and a centric ellipsoid nucleus with well-defined boundary (Fig. 1A). The following nuclear abnormalities were found: small, non-refractive circular/ovoid particles in the cytoplasm resembling a nucleus with respect to staining properties were considered an MNE varying to some extent in size and position in the cytoplasm (Fig. 1B, Fig, 1C, Fig. 1D); blebbed nucleus appeared as a small evagination of the nuclear envelope resembling a micronucleus (Fig. 1E, Fig. 1F); binucleated cell contains two nuclei that are not attached and relatively similar in size (Fig. 1G); nuclei showing a deep invagination toward the center were considered an NE (Fig. 1 H). Some fractured notched nuclei were also observed (Fig. 1I, Fig. 1J, Fig. 1K, Fig. 1L).
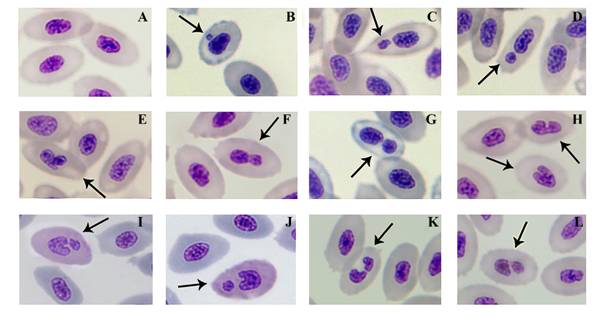
Fig. 1 Photomicrographs showing cells with normal nucleus (A) and nuclear abnormalities (arrows) in peripheral blood erythrocytes of Andinoacara rivulatus exposed to HgCl2: micronuclei (B, C, D), blebbed nucleus (E, F), binucleated cell (G), Notched nucleus (H), putative fragmented notched nucleus (L).
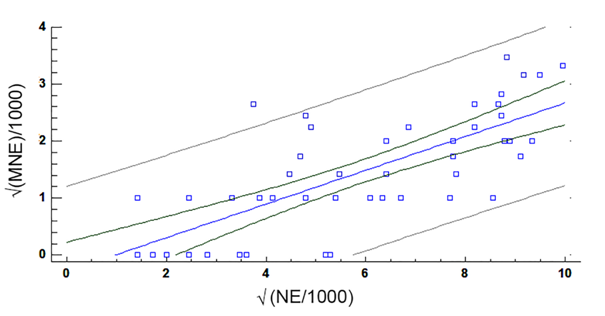
Compared with the control group, fish exposed to HgCl2 showed an increase in the frequency of MNE and NE with a peak in MNE 24 h after dosing (Fig. 2). Two-way ANOVA with three levels of concentration of HgCl2 (0, 0.1, 0.25 mg/kg) and four levels of exposure time (24, 48, 72, 96 h), followed by a post-hoc LSD test revealed significant differences in the MNE and NE among groups exposed to different concentrations of HgCl2 (Table 1). Simple linear regression analysis between the frequency of MNE and NE (Fig. 3) revealed a moderately strong relationship (F = 54.84, P < 0.0001), with the linear model 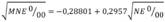 and a correlation coefficient R = 0.74. The adjusted model explains 54.38 % (R2) of the variability in
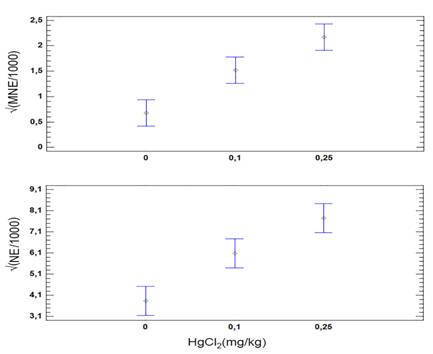
Fig. 2 Frequency of micronucleated erythrocytes (MNE) and erythrocytes with notched nucleus (NE) in Andinoacara rivulatus exposed to HgCl2 (mg/kg). Bars represent 95 % Fisher's Least Significant Difference.
TABLE 1: Mean ± standard deviation of micronuclei (MN), notched nuclei (Notch), and MN+Notch per 1 000 erythrocytes in Andinoacara rivulatus injected with two doses of HgCl2 and subjected to 96 h of exposure
| HgCl2 (mg/g) | n | √MN | LSD | √Notch | LSD | √(MN+Notch) | LSD | |
| 0 | 16 | 0.68 ± 0.56 | X | 3.84 ± 1.75 | X | 3.93 ± 1.75 | X | |
| 0.1 | 16 | 1.52 ± 0.94 | X | 6.08 ± 2.40 | X | 6.31 ± 2.46 | X | |
| 0.25 | 16 | 2.15 ± 0.92 | X | 7.71 ± 1.76 | X | 8.05 ± 1.79 | X | |
| ANOVA | - | F= 16.96 *** p= 0.0002 | - | F= 16.90 *** p= 0.000 | - | F= 19.20*** p= 0.000 | - | |
| - | ||||||||
| Time (H) | n | √MN | LSD | √Notch | LSD | √(MN+Notch) | LSD | |
| 24 | 12 | 1.86 ± 1.09 | X | 5.29 ± 2.12 | X | 7.03 ± 2.29 | X | |
| 48 | 12 | 1.35 ± 0.97 | XX | 5.33 ± 2.52 | X | 5.57 ± 2.54 | X | |
| 72 | 12 | 0.94 ± 0.83 | X | 6.19 ± 2.54 | X | 5.41 ± 2.58 | X | |
| 96 | 12 | 1.66 ± 1.03 | X | 6.75 ± 2.93 | X | 6.43 ± 3.05 | X | |
| ANOVA | - | F= 3.77 * p= 0.0189 | F= 0.195 ns p= 0.1950 | - | F= 1.92 ns p= 0.1433 | - | ||
| - | ||||||||
| Interaction HgCl2 x Time | F= 1.88ns p= 0.1116 | F= 1.35ns p= 0.2591 | F= 1.57ns | p= 0.1853 | ||||
F-tests (F) and probability values (p) on Analysis of Variance (ANOVA) with results of post-hoc test (LSD) for establishing significantly different means are shown.
DISCUSSION
Fish exposed to HgCl2 showed an increase in the frequency of MNE and NE, demonstrating that the species here studied is sensitive to mercury at the concentration used. Similar time-dependent effects in MNE frequency were also reported in Oreochromis niloticus (Linnaeus 1758), Phoxinus phoxinus (Linnaeus 1758), and Poecilia latipinna (Lesueur 1821) exposed to different heavy metals (Ayllon & Garcia-Vazquez, 2000; Jiraungkoorskul et al., 2007).
Differences in sensitivity to the induction of MNE and other erythrocyte nucleus anomalies among fish species have been reported after IP injection of mercurial compounds in Salmo trutta Linnaeus 1758, P. phoxinus (Sanchez-Galan et al., 1999), and Channa punctata (Bloch 1793) (Yadav & Trivedi 2009). Here, a low frequency of MNE and NE in the control group indicates that a percentage of these abnormalities were generated naturally. Indeed, spontaneous micronucleus frequencies (control) have been observed in several species of fish such as Astyanax bimaculatus (Linnaeus 1758) (Matsumoto & Cólus, 2000), S. trutta, Anguilla anguilla (Linnaeus 1758) P. phoxinus (Rodriguez-Cea, Ayllon, & Garcia-Vazquez, 2003), Mullus barbatus Linnaeus 1758 (Bolognesi et al., 2006), Rhamdia quelen (Quoy & Gaimard 1824), C. carpio, Hypostomus punctatus Valenciennes 1840, O. niloticus (Salvagni, Ternus, & Fuentefria, 2011), and Colossoma macropomum (Cuvier 1816) (Rocha et al., 2011b), with analogous frequency to that found in this study.
Cell populations treated with a genotoxic agent must undergo mitosis for MNE to appear (Savage, 2000; Harding et al., 2017). In fishes, erythrocytes arise from small lymphoid hemoblasts maintained by continuous mitotic divisions in the intertubular tissues of the kidney, although in some fishes like trout, the spleen is also active, while in others like perch, only the spleen is active (Catton, 1951). In fishes, a peak in micronucleated erythrocytes occurs 1-5 days after exposure to genotoxic substances, but in most species, it takes place after 2 or 3 days (Udroiu, 2006). Thus, the MNE peak here detected at 24 h suggests that mitotic spindle poisoning and/or the clastogenic effects of mercury (or their reactive metabolites) arose from already active mitotic cells after dosing. By the contrary, the lower frequency of MN after 72 and 96 h of exposure could be a result of a weakening of the normal process of cell division (mitosis) in the hematopoietic tissues, probably produced by the toxic effect of mercury. Indeed, the decrease in the erythrocyte count in Astronotus ocellatus (Agassiz, 1831), Anabas scandens (Daldorff, 1797), Salmo trutta caspius Kessler, 1877; Hypophthalmichthys molitrix (Valenciennes, 1844), exposed to chronic doses of mercurial compounds has been attributed to the impairment of erythropoiesis due to direct effect of this heavy metal (Rodríguez et al., 2017).
The results of linear regression analysis revealed that an increase in the frequency of notched cells was accompanied by a proportional increase in micronuclei bearing cells, with a high significant correlation index (R = 0.74; P < 0.0001), suggesting a direct relationship between these nuclear anomalies. These data are congruent with previous results obtained in other fishes like Clarias gariepinus (Burchell, 1822), Alburnus orontis Sauvage, 1882, Mugil cephalus Linnaeus, 1758 (Ergene et al., 2007), Dicentrarchus labrax (Linnaeus, 1758), and Mugil spp.Linnaeus, 1758 (Strunjak-Perovic, Topic Popovic, Coz-Rakovac, & Jadan, 2009a). The cytotoxicity of mercury compounds causes damage in cell function, resulting in the inability of cells to proliferate (Silva-Pereira et al., 2005). Studies in rats exposed to HgCl2 have shown that this metal has a high affinity for chromatin in the cell nucleus (Rózalski & Wierzbicki, 1979) and studies on the effect of mercury on the nucleus of Dictyostelium discoideum Raper, 1935, a species of soil-living amoeba recognized as a model organism by the American National Institute of Health (http://www.nih.gov/science/model), revealed that 10 mM of HgCl2 provokes an increase in MNE frequency, in addition to the carbonylation and quantitative changes in nuclear proteins (Boatti et al., 2017). Other compounds, such as the herbicide sulfentrazone, have induced MNE and nuclear DNA fragmentation on Allium cepa L. cells (Bianchi et al., 2016).
Mechanisms of erythrocyte nuclei deformity have not yet been explained and there is no consensus about the causes of these changes (Strunjak-Perovic, Coz-Rakovac, Topic Popovic, & Jadan, 2009a, 2009b). Recently, it has been proposed that severe nuclear deformations can also originate from physical forces, such as the compression of the nucleus during migration through confined spaces that can lead to nuclear envelope rupture (Shah, Wolf, & Lammerding, 2017).
Although further studies are required to explain the mechanisms involved in the concomitant variation of MNE and NE in A. rivulatus, it is likely that mechanical stress might contribute to generation of chromatin fragmentation. In other words, in addition to the known cytotoxic effects of mercury on spindle apparatus damage and chromosomal ruptures, local defects in nuclear envelope might also results from a third mechanism linked to mechanical stress.

