


 English (pdf)
 Article in xml format
 Article references
 Send this article by e-mail
 Cited by SciELO
  Similars in
SciELO
Similars in
SciELO  uBio
uBio 
 Permalink
Niche segregation is frequently proposed as a mechanism by which multiple species may coexist (MacArthur & Levins, 1967; Schoener, 1974; Karanth & Sunquist, 2000; Davies, Meiri, Barraclough, & Gittleman, 2007). Partitioning of resources in ecological communities may occur along the space, time, and/or food axes (Schoener, 1974). Traditionally, most studies have focused on the spatial and trophic dimensions to assess the mechanisms underlying the coexistence of species (Schoener, 1974). Although time has being considered an important organizing factor in structuring ecological communities (Dayan & Simberloff, 2005; Davies et al., 2007), its role as a mediator of ecological interactions is poorly understood (Kronfeld-Schor & Dayan, 2003). This is especially true for tropical forest communities, particularly the large and medium-sized animals which tend to be shy, elusive and may occur at naturally low population densities (Linkie & Ridout, 2011).
Jaguars (Panthera onca), pumas (Puma concolor) and ocelots (Leopardus pardalis) are sympatric over much of their range (GonzalezBorrajo, Lopez-Bao, & Palomares, 2016). The three felids have been described as opportunistic hunters (Emmons, 1987; Taber, Novaro, Neris, & Colman, 1997; Sunquist & Sunquist, 2002) whose diets frequently overlap, making them potential competitors. Agonistic interactions among them are reported in the literature (Mondolfi & Hoogesteijn, 1986; Crawshaw, 1995; Nuñez, Miller, & Lindzey, 2000; Harmsen, Foster, Silver, Ostro, & Doncaster, 2009), with the puma most likely being dominant over the ocelot and the jaguar over both of these, based on body size differences (Schaller & Crawshaw, 1980; Di Bitetti, Angelo, Di Blanco, & Paviolo, 2010). Given the high dietary overlap observed between jaguars and pumas (Emmons, 1987; Taber et al., 1997; Nuñez et al., 2000; Crawshaw & Quigley, 2002; Leite & Galvaõ, 2002; Scognamillo, Maxit, Sunquist, & Polisar, 2003; Novack, Main, Sunquist, & Labisky, 2005) and between pumas and ocelots (Emmons, 1987; Rabinowitz & Nottingham, 1986; Sunquist & Sunquist, 2002), coexistence among these felids suggests they have evolved behavioral traits that ecologically separate them or that resources are abundant enough that sharing does not negatively affect either species (Emmons, 1987; Nuñez et al., 2000).
Interference competition has been proposed as a key factor promoting temporal separation between jaguars and pumas (Emmons, 1987; Harmsen et al., 2009; Romero-Muñoz, Maffei, Cuéllar, & Noss, 2010). Avoidance of temporal overlapping eliminates the negative effects of interference interactions (i.e., harassment, robbing, killing, etc.) and has been observed in competing species of desert rodents (Kenagy, 1973; O’Farrell, 1974), foxes (Di Bitetti, Di Blanco, Pereira, Paviolo, & Pérez, 2009), felids (Azlan & Sharma, 2006; Di Bitetti et al., 2010) and canids (Arjo & Pletscher, 1999), among other taxa (Kronfeld-Schor & Dayan, 2003; Barrull et al., 2014). In this paper, we evaluated if temporal separation existed among three species of neotropical felids and if their activity patterns were related to that of a particular prey. Carnivores with similar body sizes tend to eat similarly sized prey (Rosenzweig, 1966), thus increasing the probability of interspecific competition and intraguild aggression (Donadio & Buskirk, 2006). We hypothesized that, as a result of interference competition, the pairs of cats with the highest morphological similarity (puma-jaguar and puma-ocelot) would exhibit a stronger temporal segregation than the leastsimilar (jaguar and ocelot).
Materials and methods
Study site: Corcovado National Park (CNP) is a 500 km2 expanse of tropical rainforest located in Southwestern Costa Rica. It comprises a mosaic of primary and secondary forests from 0-700 masl. The climate is hot and humid, with mean annual temperature of 25 °C and mean annual precipitation of 4 000 mm, with pronounced wet (May-November) and dry (December-April) periods (Carrillo, 2000).
Santa Rosa National Park (SRNP) is a 387 km2 expanse of tropical dry forest located in Northwestern Costa Rica. It comprises a mosaic of second-growth forests from 0-500 masl. Annual temperature ranges from 16-38 °C (mean 28 °C) and precipitation ranges from 900-2 500 mm (mean 1 600 mm) (Janzen, 1988; Pacheco, 1994).
Camera-trap data collection: Cameratrap data were collected from 87 locations inside the CNP between 2003-2015, and from 61 locations inside the SRNP between 2005-2015. Cameras were located along forest trails, unused dirt roads and near water sources (in SRNP only) with a minimum distance of 2.5 km from one another (Silver et al., 2004). They were programmed to operate 24 h d-1 and to record the date and time of each photograph with a minimum delay of 10 min. We used Bushnell Trophy Cams for most of our study, although Cam Trakker and Stealth cameras were also employed during the first years of research.
Statistical analysis: To quantify the overlap between the activity periods of the felids and their prey, we used the two-step approach developed by Ridout & Linkie (2009). First, we determined the daily activity patterns of each predator and prey species using kernel density estimates. This method presupposes that the animals are equally likely to be photographed at all times when they are active (Ridout & Linkie, 2009), and treats pictures as random samples from an underlying continuous distribution instead of grouping them into discrete time categories (Foster et al., 2013). The second step consisted on estimating the degree of overlapping between two probability functions. We used the coefficient of overlap (Δ), defined as the area under the curve that is formed by taking the minimum of the two density functions at each time point (Linkie & Ridout, 2011). The coefficient of overlap ranges from (no overlap) to 1 (complete overlap) (Ridout & Linkie, 2009; Linkie & Ridout, 2011). We used the Δ1 and Δ4 estimators recommended for small and large samples, respectively, and calculated confidence intervals as percentile intervals from 1 000 bootstrap samples (Ridout & Linkie, 2009). Analyses were performed in the software R and the package Overlap (R Development Core Team, 2017).
Results
A total of 5 506 photographic records (including animals and people) were collected at SRNP and 5 075 at CNP (Digital Appendix 1 and Digital Appendix 2). Of these, 4 009 and 2 711 non-human, species-level records from SRNP and CNP, respectively, were used for statistical analysis (Table 1 and Table 2). Felid activity was slightly higher in the rainforests of CNP, where jaguars, pumas and ocelots were active 64 % (CI: 0.36-0.69), 71 % (CI: 0.510.82) and 52 % (CI: 0.37-0.56) of the time, respectively; compared to 57 % (CI: 0.47-0.65), 58 % (CI: 0.41-0.72) and 40 % (CI: 0.32-0.50) of the time at SRNP. Activity schedules were predominantly nocturnal, with a probability of being active between 18:00-06:00 ranging from 0.66-0.71 for jaguars, 0.49-0.55 for pumas and 0.79-0.81 ocelots in the dry and rainforest, respectively. Activity peaks occurred near midnight for all cats except pumas in the dry forest, which increased their activity at dawn and at noon (Fig. 1).
Table 1 Estimates of activity pattern overlap between the jaguar, puma and ocelot and their presumed prey species in the Santa Rosa National Park (SRNP), Costa Rica
| - | - | Coefficient of overlap (95 % Confidence interval) | ||
|---|---|---|---|---|
| Species | n* | Panthera onca | Puma concolor | Leopardus pardalis |
| Procyon lotor | 58 | 0.821 (0.735-0.938) | 0.703 (0.572-0.818) | 0.792 (0.703-0.916) |
| Tapirus bairdii | 220 | 0.818 (0.765-0.878) | 0.609 (0.501-0.706) | 0.846 (0.789-0.923) |
| Conepatus semistriatus | 107 | 0.745 (0.653-0.833) | 0.665 (0.562-0.770) | 0.739 (0.633-0.830) |
| Didelphis marsupialis | 58 | 0.736 (0.595-0.811) | 0.582 (0.456-0.688) | 0.802 (0.708-0.905) |
| Canis latrans | 23 | 0.687 (0.531-0.833) | 0.716 (0.556-0.851) | 0.582 (0.399-0.708) |
| Odocoileus virginianus | 931 | 0.629 (0.551-0.671) | 0.799 (0.724-0.871) | 0.513 (0.421-0.561) |
| Dasypus novemcinctus | 19 | 0.606 (0.413-0.739) | 0.498 (0.320-0.632) | 0.648 (0.474-0.791) |
| Panthera onca | 259 | - | 0.737 (0.648-0.817) | 0.823 (0.770-0.904) |
| Leopardus pardalis | 127 | 0.825 (0.767-0.906) | 0.641 (0.531-0.744) | - |
| Nasua narica | 85 | 0.454 (0.332-0.504) | 0.656 (0.511-0.738) | 0.354 (0.220-0.403) |
| Aramides cajanea | 59 | 0.452 (0.324-0.516) | 0.655 (0.506-0.730) | 0.348 (0.214-0.405) |
| Dasyprocta punctata | 482 | 0.461 (0.381-0.496) | 0.631 (0.532-0.696) | 0.343 (0.241-0.382) |
| Penelope purpurascens | 83 | 0.446 (0.337-0.497) | 0.634 (0.499-0.718) | 0.339 (0.219-0.392) |
| Puma concolor | 97 | 0.747 (0.640-0.820) | - | 0.639 (0.531-0.747) |
| Tigrisoma mexicanum | 70 | 0.410 (0.307-0.458) | 0.607 (0.458-0.669) | 0.302 (0.185-0.362) |
| Cebus capucinus | 106 | 0.387 (0.274-0.419) | 0.596 (0.477-0.668) | 0.298 (0.178-0.329) |
| Leptotila sp. | 95 | 0.399 (0.304-0.445) | 0.575 (0.439-0.644) | 0.292 (0.182-0.349) |
| Crax rubra | 955 | 0.393 (0.324-0.429) | 0.574 (0.481-0.630) | 0.280 (0.185-0.319) |
| Ctenosaura similis | 175 | 0.194 (0.134-0.230) | 0.385 (0.291-0.469) | 0.156 (0.951-0.221) |
The underlying activity densities were calculated by kernel density estimation based on individual photograph times recorded between 2005 and 2015. The estimate of overlap for each pair of species is indicated with 95 % bootstrap confidence interval in parenthesis. *n= sample size.
Table 2 Estimates of activity pattern overlap between the jaguar, puma and ocelot and their presumed prey species in the Corcovado National Park (CNP), Costa Rica
| - | - | Coefficient of overlap (95 % Confidence interval) | ||
|---|---|---|---|---|
| Species | n* | Panthera onca | Puma concolor | Leopardus pardalis |
| Tapirus bairdi | 112 | 0.782 (0.700-0.915) | 0.729 (0.636-0.830) | 0.842 (0.776-0.920) |
| Procyon cancrivorus | 24 | 0.765 (0.709-0.978) | 0.693 (0.587-0.847) | 0.821 (0.792-1.026) |
| Cuniculus paca | 112 | 0.668 90.543-0.791) | 0.599 (0.490-0.681) | 0.779 (0.679-0.849) |
| Didelphis marsupialis | 195 | 0.657 (0.545-0.769) | 0.595 (0.498-0.677) | 0.775 (0.692-0.844) |
| Tamandua mexicana | 16 | 0.694 (0.602-0.938) | 0.700 (0.612-0.936) | 0.610 (0.449-0.802) |
| Dasypus novemcinctus | 48 | 0.471 (0.622-0.894) | 0.659 (0.542-0.768) | 0.821 (0.733-0.939) |
| Mazama americana | 28 | 0.589 (0.418-0.716) | 0.637 (0.514-0.781) | 0.475 (0.301-0.576) |
| Conepatu semistriatus | 15 | 0.557 (0.393-0.747) | 0.448 (0.282-0.594) | 0.616 (0.427-0.784) |
| Panthera onca | 49 | - | 0.797 (0.722-0.942) | 0.803 (0.747-0.955) |
| Tayuassu pecari | 149 | 0.543 (0.376-0.630) | 0.616 (0.510-0.700) | 0.397 (0.279-0.446) |
| Leopardus pardalis | 133 | 0.806 (0.746-0.955 | 0.732 (0.651-0.835) | - |
| Puma concolor | 111 | 0.797 (0.722-0.942) | - | 0.731 (0.652-0.833) |
| Nasua narica | 56 | 0.520 (0.341-0.619) | 0.606 (0.474-0.696) | 0.391 (0.243-0.443) |
| Pecari tajacu | 69 | 0.489 (0.325-0.578) | 0.578 (0.457-0.664) | 0.359 (0.226-0.405) |
| Tinamus major | 163 | 0.494 (0.341-0.567) | 0.512 (0.407-0.567) | 0.381 (0.248-0.398) |
| Eira barbara | 40 | 0.449 (0.266-0.529) | 0.527 (0.390-0.600) | 0.310 (0.160-0.343) |
| Crax rubra | 278 | 0.438 (0.280-0.510) | 0.513 (0.419-0.576) | 0.288 (0.185-0.320) |
| Dasyprocta punctata | 1 113 | 0.447 (0.293-0.522) | 0.498 (0.419-0.557) | 0.292 (0.200-0.329) |
The underlying activity densities were calculated by kernel density estimation based on individual photograph times recorded between 2003 and 2015. The estimate of overlap for each pair of species is indicated with 95 % bootstrap confidence interval in parenthesis. *n = sample size.
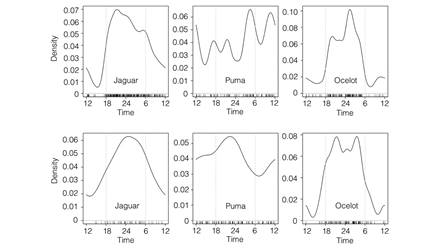
Fig. 1 Density estimates of the daily activity patterns of jaguar, puma and ocelot in the dry (SRNP; upper row) and rainforests (CNP; lower row) of Costa Rica. The short vertical lines above the x-axis indicate the times of individual photographs recorded between 2003 and 2015, and the grey dashed vertical lines indicate the approximate time of sunrise and sunset.
Activity schedules of each felid species were very similar between the dry and rainforests with coefficients of overlap of 0.84 (CI: 0.83-0.99) for jaguars, 0.79 (CI: 0.69-0.89) for pumas and 0.83 (CI: 0.78-0.93) for ocelots. Interspecific temporal overlap was also high at each study site. Jaguar and puma were found to be active during the same hours 75 % (CI 0.64-0.82) of the time in the dry forest and 80 % (CI 0.72-0.94) in the rainforest. Diel overlap between the puma and the ocelot ranged from 0.64 (CI 0.53-0.74) in the dry forest, to 0.73 (CI 0.65-0.83) in the rainforests; while the coefficients of overlap for ocelots and jaguars were 0.82 (CI 0.0.76-0.90) in the dry forest and 0.81 (CI 0.74-0.95) in the rainforest (Fig. 2).
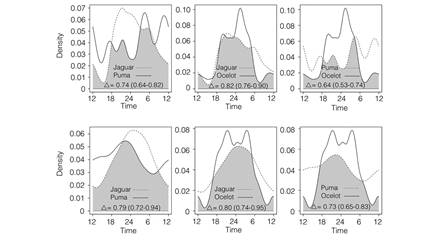
Fig. 2 Estimates of the daily activity patterns of jaguars, pumas and ocelots in the dry (SRNP; upper row) and rainforests (CNP; lower row) of Costa Rica. The dash and solid lines are kernel density estimates for the indicated species based on individual photograph times recorded between 2003 and 2015. The overlap coefficient is the area under the minimum of the two density estimates, as indicated by the shaded area in each plot. The estimate of overlap is indicated in each plot with 95 % bootstrap confidence interval in parenthesis.
Temporal overlap with prey species varied with prey composition and abundance at each site (Digital Appendix 1 and Digital Appendix 2). In the dry forest, jaguars overlapped mainly with tapirs, armadillos and white-tailed deer; while in the rainforest, they matched the activity of pacas, ant eaters and brocket deer. Pumas, on the other hand, overlapped with a larger number of prey, including white-tailed deer, coatis, agoutis and crested guans in the dry forest, and with ant eaters, armadillos, brocket deer and peccaries in the rainforest. Ocelots overlapped mainly with opossums, armadillos and racoons at both sites (Table 1 and Table 2).
Discussion
Activity of jaguars, pumas, and ocelots may vary significantly from place to place as a result of changes in environmental conditions such as prey availability (Rabinowitz & Nottingham, 1986; Quigley & Schaller, 1988; Sunquist & Sunquist, 2002; Harmsen, Foster, Silver, Ostro, & Doncaster, 2011), competition (Taber et al., 1997; Romero-Muñoz et al., 2010), seasonality (Emmons, 1987; Carrillo, Fuller, & Sáenz, 2009), and human disturbances (Paviolo, Di Blanco, De Angelo, & Di Bitetti, 2009). In this study, the activity schedules of each cat did not vary significantly between sites; however, the three felids displayed higher activity levels in the rainforest than in the dry forest. The latter could derive from differences in prey composition and availability between sites, which could cause predators to spend more or less time securing their prey (Sunquist & Sunquist, 1989; Cruz-Díaz, 2012; Montalvo, 2012). Alternatively, the higher temperatures observed in the SRNP could exert an influence on the activity of felids. Previous research has shown that increases in temperature have a negative effect on the activity of felids and other mammals (Crawshaw & Quigley, 1991; Mills & Biggs, 1993; Sunquist, 1981). Podolski, Belotti, Bufka, Reulen, & Heurich (2013), for instance, determined that Eurasian Lynx (Lynx lynx) decreased their activity by 30 min for every 10 °C increase in temperature. In the SRNP temperature can reach 46 °C (unpublished data) while surface water virtually disappears from some areas of the park during the driest months. Such conditions could force animals to decrease their activity in order to conserve energy and avoid dehydration (Scognamillo et al., 2003).
Despite the strong temporal overlap observed between the felids, fine-scale differences in their activity schedules are likely to contribute to their local coexistence. Not only did the cats differ in their activity peaks but they also showed different degrees of nocturnality. The ocelot, for example, was strongly nocturnal, while the jaguar displayed certain level of diurnal activity but was mostly recorded at night. Pumas, on the other hand, were similarly active by day and night. Partitioning of time has been observed in other carnivore assemblages (Arjo & Pletscher; 1999; Azlan & Sharma, 2006; Di Bitetti et al., 2009). Di Bitetti et al. (2010), observed different levels of temporal segregation, with some species displaying apposite schedules (jaguarundi and margay) while others differed in their activity peaks or were active at any time of the day (puma and oncilla). Although in our case, time might not be the primary segregation mechanism, it probably plays a role in the local coexistence of these felid communities.
As we predicted, the pairs of cats with the highest morphological similarity (puma-jaguar and puma-ocelot) had a smaller temporal overlap (and therefore, a strongest separation) than the more morphologically-distinct jaguar and ocelot. It is likely that the ecological niches of the jaguar and the ocelot are too different for competition to take place (Davies et al., 2010). It has been determined that jaguars and ocelots have very little diet overlap, with 92 % of the ocelots’ prey weighing less than one kg, while 85 % of jaguar’s prey weighed more than one kg (Emmons, 1987). Pumas, on the other hand, may consume a high proportion (100 % in some cases) of the prey species taken by jaguars and ocelots (Crawshaw, 1995). Similar investigations (Polis, Myers, & Holt, 1989; Palomares & Caro, 1999) suggested that competition for food is a key factor precipitating intraguild killing (the most extreme form of interference competition). For instance, extensive dietary overlap among large African carnivores was correlated with high levels of interspecific aggression (Schaller, 1972; Mills & Biggs, 1993). If spatial and trophic overlap are common in our felid assemblage, the temporal segregation of the daily activity patterns could be an effective mechanism to reduce competition (Carothers & Jaksic, 1984). Furthermore, a stronger partitioning of time should be expected between the species with the highest diet similarity (puma-ocelot and puma-jaguar), as was observed in this and other studies (DiBitetti et al., 2010).
Jaguars, pumas and ocelots have been described as opportunistic predators whose movements and activity schedules largely depend on those of their major prey (Rabinowitz & Nottingham, 1986; Quigley & Schaller, 1988). Due to the weak temporal segregation observed between our felids, it is likely that their activity schedules resulted largely from the activity patterns of their prey. Jaguars, for example, showed a significant (> 50 %) time overlap with tapirs, deer and white-lipped peccaries, three of the most frequently detected species in this study (Digital Appendix 1 and Digital Appendix 2). Ocelots, on the other hand, were highly nocturnal, matching the activity of opossums, armadillos and raccoons (Digital Appendix 3 and Digital Appendix 4). Previous investigations determined that jaguars in the CNP changed their activity and movement patterns every two weeks, depending on the availability of marine turtles, a large, predictable and easily-hunted prey (Carrillo et al,. 2009; Herrera, 2016).
In conclusion, segregation of activity patterns does not appear to be the principal mechanism facilitating the coexistence of jaguars, pumas and ocelots in our study areas. Other factors, such as space use or prey availability, may play a fundamental role in determining felids’ behavior and community structure. However, fine-scale (e.g. activity peaks) or spatiotemporal differences in the activity schedules of predators might contribute to their coexistence in these environments. Activity of prey seems to be a stronger predictor of the felids’ activity. High overlapping coefficients between the jaguar, puma and ocelot and their potential prey species suggest that these cats synchronize their activity with that of their prey. Predators that hunt when the probability of prey capture is greatest should have greater prey capture success, and at lower cost, than individuals that forage at random (Gantchoff & Belant, 2016). Moreover, if predators exist at low densities and direct confrontations are uncommon, the benefits of foraging at times when prey activity is high may outweigh the costs of proximity to dominant competitors (Davies et al., 2010). Research at the interface between habitat use, resource utilization and temporal distribution of prey and potential competitors may provide valuable insight into the mechanisms underlying species coexistence in neotropical felid communities (Chesson, 2000).
See Digital Appendix at: / Ver Apéndice digital en: revistas.ucr.ac.cr

