


 English (pdf)
 Article in xml format
 Article references
 Send this article by e-mail
 Cited by SciELO
  Similars in
SciELO
Similars in
SciELO  uBio
uBio 
 Permalink
Estuarine systems are important habitats for adults and juveniles of numerous fish species (Nagelkerken, 2009; Cowan, Yañez-Arancibia, Sánchez-Gil, & Deegan, 2013). The definition of such systems as nursery areas (Beck et al., 2001) or essential juvenile habitats (Dahlgren et al., 2006) depend on the contribution these areas make to adult populations in the adjacent shelf waters. A first step in the knowledge of this important aspect is the documentation of the composition of fish assemblages considering not only the relative contribution of different species but also their length composition as a means to know the proportion of juvenile in each species. The studies of temporal and spatial variations of fish assemblage’s characteristics are essential for the understanding of the factors driving such variations.
Temporal and spatial variability in the composition of estuarine fish assemblages has been documented by several authors (Barletta, Barletta-Bergan, Saint-Paul, & Hubold, 2003; Rueda & Defeo, 2003; Ramos-Miranda et al., 2005). Salinity gradients have been mentioned as a main factor structuring fish assemblages in estuarine habitats (Araujo et al., 2002; Barletta, Barletta-Bergan, Saint-Paul, & Hubold, 2005) as well as the characteristics of the bottom including sediment’s granulometry and organic matter contents (Vinagre, França, & Cabral, 2006; Reis-Filho & Santos, 2014).
A review of pertinent literature on estuarine fish assemblages of Mexican Pacific coast yielded only qualitative mentions on the presence of juvenile fish in coastal lagoons and other estuarine systems. In most cases, the authors did not measure the collected fish and mention of the presence of juveniles is therefore not supported with quantitative data (Díaz, Cano-Quiroga, Aguirre-León, & Ortega-Bernal, 2004; Benítez et al., 2007; Rodríguez-Romero et al., 2011). Two papers were found which report limited information about fish lengths of some species in coastal lagoons (Amezcua-Linares, 1977; Mendoza, Castillo-Rivera, Zárate-Hernández, & Ortiz-Burgos, 2009) but the majority of studies were not focused in documenting size composition of fishes. Only recent research in Barra de Navidad lagoon has yielded the first quantitative data on fish lengths suggesting a dominance of juvenile fish in these systems (González-Sansón et al., 2014, 2016).
Barra de Navidad lagoon (BNL) is one of the main coastal wetlands in the coast of the State of Jalisco, Mexico. This lagoon has been declared Ramsar site (wetland of international importance) and has been included among the 81 mangrove sites with biological relevance and ecological rehabilitation needs by Mexico’s National Commission for the Knowledge and Use of Biodiversity (Rodríguez-Zúñiga et al., 2013). Fish fauna in this lagoon is composed in a great proportion (> 70 %) by species in juvenile stages (González-Sansón et al., 2014) and it is highly probable that this wetland could be an important nursery area for many marine species with commercial and ecological relevance (González-Sansón et al., 2016).
Although fish fauna composition is well known in BNL, little evidence exists that support seasonal and spatial changes of fish assemblages’ structure. Therefore a study was designed to address spatial and temporal variations in fish fauna composition in the lagoon. The hypothesis tested in this study was that there are significant seasonal and spatial changes in fish assemblages’ composition which can be explained, at least partially, by changes in salinity, water temperature and sediment’s granulometry.
Material and methods
Barra de Navidad lagoon is located in the southern coast of Jalisco State, Mexico (19°11’25’’ N & 104°39’53’’ W). It has a water surface of 334 ha and is surrounded by a well developed mangrove forest (571 ha) mainly in its northeastern and southeastern margins (Figure 1). Fresh water inputs in the western extreme of the lagoon come from the Arroyo Seco River and an artificial channel communicating the lagoon with the Marabasco River. Some fresh water input is also present in the north-western side of the lagoon coming from urban drainage of Barra de Navidad town. The lagoon communicates permanently with sea through a 100 m wide mouth. Based on a 64 years record (1946 to 2010) two seasons related to rainfall are defined for the lagoon (Gonzalez-Sanson et al., 2014): A rain season from June to October and a dry season from November to May.
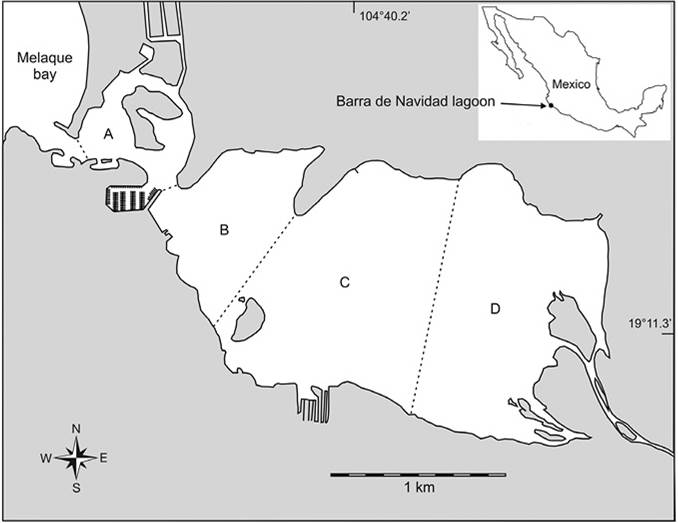
The research was performed on fish sampled monthly from October 2012 to September 2013 at four zones of Barra de Navidad lagoon (Figure 1). The zones were defined based on natural basins of the lagoon (the bigger, most eastern basin was divided in two zones). One sample was taken at each zone each month. The position of sampling in each zone was selected randomly for each sampling operation. Sampling gear was a gill net of 180 m length, 2.7 m high and 7.62 cm mesh size. The net was deployed forming a circle and then was collected maintaining the circle closed and progressively reducing its diameter. This maneuver forced fish inside de encircled area to try to escape and get meshed. Collected fish were identified at species level and individually measured for total length (± 1 mm). Valid species names are given after Eschmeyer, Fricke, and van der Laan (2017). Orders and families are arranged after Nelson, Grande, and Wilson (2016). Information on feeding habits of most abundant species was obtained from Fishbase (Froese & Pauly, 2018).
Prior to each sampling operation, water salinity and temperature were measured using an YSI-30 probe. Samples of sediment were collected with a Van Veen grab sampler in three randomly selected points of each zone. A sub-sample of 200-250 g of sediment was used for the estimation of grain size composition based on methodology by Folk (1974) and three fractions were defined based in particle size as mud (≤ 0.0625 mm), sand (> 0.0625 and ≤ 2.00 mm ) and gravel (> 2.00 mm). Organic matter content was estimated from weight loss of a sub-sample burned at 550 °C during one hour and expressed as percentage of dry weight.
Variations of the number of individuals per fishing operation were analyzed for most abundant species using generalized linear models considering a Poisson distribution for the response variable (individuals caught per fishing operation) and log as the link function. Based on the analysis design developed by Livingston (1997) two nominal variables or fixed effects factors were considered in the models, namely, season (dry-rain) and zone. Monthly values within each season were then considered as replicates and the lack of autocorrelation among them was tested. In all cases, no significant autocorrelation values were found for replicates in each combination of season and zone. For each species the existence of a significant interaction term (season x zone) was tested and if not significant, a simpler model with just additive effects was used. The significance of the effects was tested using the Likelihood Ratio Test assuming a χ2 distribution (Zuur, Ieno, Walker, Saveliev, & Smith, 2009). Analyses were made using R software (R Core Team, 2017).
A two way permutational multivariate analysis of variance (PERMANOVA) was used to test the differences in species composition of the samples classified after factors defined a priori (season, zone). A repeated measures design was used and an analogue to the test of sphericity used in univariate parametric ANOVA was applied following the procedure suggested by Anderson, Gorley, and Clarke (2008). No significant differences were found among treatments in relation to correlation structure and the analysis was considered valid. This analysis was based on a Bray-Curtis similarity matrix calculated with log transformed data of number of fish caught for each species. The homogeneity of groups’ dispersions was tested using the PERMDISP routine based on centroids. Analyses were based on 9999 permutations and were performed using the package PRIMER 6 (Clarke & Gorley, 2006) with the add-on package PERMANOVA+ (Anderson, Gorley, & Clarke, 2008).
Species-environment relationship was estimated using redundancy analysis (Legendre & Legendre, 2012) based on data of all species. Prior to the analysis, species data were transformed as suggested by Legendre & Gallagher (2001) to get an ordination based on Hellinger’s distance. Scaling was focused on inter-species correlations, species scores were divided by the standard deviation and data were centered by species. Forward selection of environmental variables was performed automatically and statistical significance determined by unrestricted Monte Carlo permutation tests with 9999 permutations. Environmental (explanatory) variables included temperature, salinity and mud fraction in sediments. A triplot was used for the representation of ordination results and interpreted using the rules summarized by Legendre and Legendre (2012). Sample scores which are weighted averages of species scores (identified as SAMP in the software) were plotted. Analyses were made using CANOCO 4.5 for Windows (ter Braak & Smilauer, 2002).
Results
Abiotic variables: Mean monthly salinity values were high and stable during the dry season with values in zone A slightly lower than those in the rest of the zones (Figure 2, Table 1). During the rainy season, mean monthly salinities drop along the season reaching lowest values in September, with zone D showing a minimum value of 24.4 in that month. Difference in mean seasonal values was significant (F1,88 = 36.61; P < 0.001) while differences among zones were not (F3,86 = 0.03; P = 0.993). Mean monthly temperature values followed the expected seasonal cycle with lowest values in April and highest values in July and October (Figure 2, Table 1). Difference in mean seasonal values was significant (F1,88 = 154.47; P < 0.001) but zones were highly homogeneous for this factor and mean values were not significantly different (F3,86 = 0.36; P = 0.783).
Table 1: Summary statistics for abiotic variables
| Variable | Season | Zones | ||||
| A | B | C | D | |||
| Salinity | R | Mean | 31.2 | 31.1 | 31.4 | 30.2 |
| Range | 27.4-33.3 | 27.7-33.9 | 28.6-34.1 | 24.4-34.2 | ||
| D | Mean | 33.9 | 34.4 | 34.5 | 34.6 | |
| Range | 33.7-34.1 | 34.2-34.6 | 34.1-34.8 | 34.1-35.1 | ||
| Temperature (ºC) | R | Mean | 31.4 | 31.2 | 31.2 | 31.6 |
| Range | 29.8-32.3 | 29.6-32.8 | 29.5-32.8 | 28.4-33.3 | ||
| D | Mean | 27.6 | 27.8 | 27.8 | 28.6 | |
| Range | 25.2-29.6 | 25.5-29.8 | 26.3-30.1 | 26.4-30.5 | ||
| OM (%) | Mean | 3.0 | 2.6 | 8.1 | 18.9 | |
| Range | 0.8-5.1 | 0.9-4.3 | 5.4-10.8 | 12.2-25.7 | ||
| Mud (%) | Mean | 24.5 | 21.1 | 62.5 | 95.6 | |
| Range | 6.8-42.2 | 2.9-39.3 | 29.7-94.9 | 95.4-96.2 | ||
| Sand (%) | Mean | 69.2 | 75.8 | 37.4 | 4.3 | |
| Range | 47.1-91.4 | 56.7-95.0 | 4.5-70.3 | 3.6-4.9 | ||
| Gravel (%) | Mean | 6.3 | 3.1 | 0.1 | 0.14 | |
| Range | 1.8-10.7 | 2.1-3.9 | 0.04-0.11 | 0.13-0.16 | ||
R: Rain, D: Dry; OM: Organic matter. Zones defined in Figure 1.
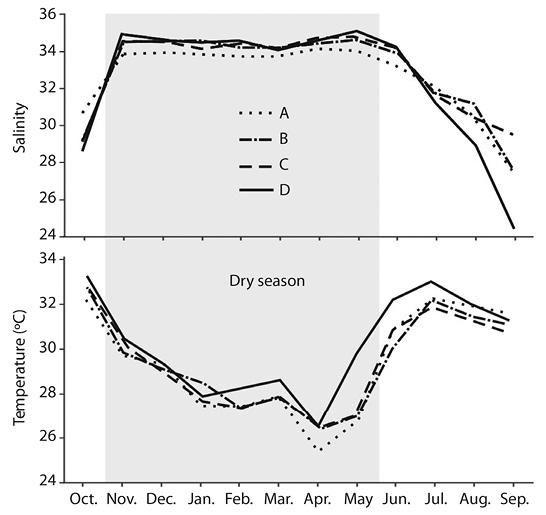
Figure 2 Salinity and temperature values measured during sampling operations. A, B, C and D are sampling zones (see Figure 1).
Mean percentages of mud fraction and organic matter increased significantly (F3,8 = 8.72; P = 0.006) along the main axis of the lagoon (from West to East) with lowest values in zones A and B and highest in zones C and D. Correlation between percentage of mud fraction and percentage of organic matter was very high and significant (r(12) = 0.974, P < 0.001). Due to this collinearity only mud percentage was used in further analyses. Based on the particle size composition, western region of the lagoon (zones A and B) had sediments dominated by sand with small percentages of gravel while the eastern region was characterized by muddy bottoms (Table 1).
General composition of the fish assemblage: A total of seven individuals of four species, two families and one order of Chondricthyans and 2019 individuals of 44 species, 23 families and 9 orders of Actinopterygians were collected. Families with more species were Carangidae (10 spp), Gerreidae (4 spp), Engraulidae (3 spp) and Lutjanidae (3 spp). Slightly more than 90 % of all fish counted belonged to nine species: Peruvian mojarra (Diapterus brevirostris), Pacific crevalle-jack (Caranx caninus), White mullet (Mugil curema), Blue sea-catfish (Ariopsis guatemalensis), Oval flounder (Syacium ovale), Pacific lined sole (Achirus mazatlanus), Yellowfin mojarra (Gerres simillimus), Pacific bumper (Chloroscombrus orqueta) and Freckled porcupinefish (Diodon holocanthus). Other 15 species amounted to slightly more than 98 % of all individuals (Table 2).
Table 2: Taxa contributing 98 % of caught individuals (N), ordered after the mean number of individuals per fishing operation
| Species | Code | Mean ± se | % N | % Nacu | LM | % < LM | Main food |
| Diapterus brevirostris | Diaper | 27.65 ± 3.07 | 65.5 | 65.5 | 18.5 | 100 | SBI |
| Caranx caninus | Carcan | 3.56 ± 0.70 | 8.4 | 73.9 | 54.0 | 100 | F&BI |
| Mugil curema | Mugcur | 1.83 ± 0.25 | 4.3 | 78.3 | 18.5 | 0 | D |
| Ariopsis guatemalensis | Arigua | 1.23 ± 0.25 | 2.9 | 81.2 | 32.3 | 85 | F&BI |
| Syacium ovale | Scyova | 1.17 ± 0.21 | 2.8 | 84.0 | 9.5 | 0 | F&BI |
| Achirus mazatlanus | Achmaz | 1.08 ± 0.24 | 2.6 | 86.5 | 12.8 | 21 | F&BI |
| Gerres simillimus | Gersim | 0.73 ± 0.19 | 1.7 | 88.3 | 20.6 | 63 | SBI |
| Chloroscombrus orqueta | Chlorq | 0.71 ± 0.18 | 1.7 | 89.9 | 18.5 | 15 | F&BI |
| Diodon holocanthus | Diohol | 0.65 ± 0.17 | 1.5 | 91.5 | 29.0 | 100 | BI |
| Opisthonema libertate | Opilib | 0.54 ± 0.15 | 1.3 | 92.7 | 15.8 | 0 | Zo |
| Chanos chanos | Chacha | 0.38 ± 0.22 | 0.9 | 93.6 | 65.0 | 100 | PpPb&BI |
| Scomberomorus sierra | Scosie | 0.31 ± 0.09 | 0.7 | 94.4 | 53.1 | 100 | F |
| Haemulopsis elongatus | Haeelo | 0.27 ± 0.13 | 0.6 | 95.0 | 18.5 | 0 | BI |
| Diodon hystrix | Diohys | 0.19 ± 0.08 | 0.4 | 95.5 | 49.3 | 100 | BI |
| Lutjanus colorado | Lutcol | 0.17 ± 0.05 | 0.4 | 95.9 | 49.3 | 100 | F&BI |
| Trachinotus kennedyi | Traken | 0.17 ± 0.10 | 0.4 | 96.3 | 48.8 | 100 | BI&F |
| Caranx caballus | Carcab | 0.13 ± 0.07 | 0.3 | 96.5 | 31.6 | 83 | F&BI |
| Selene peruviana | Selper | 0.13 ± 0.09 | 0.3 | 96.8 | 23.8 | 100 | F&BI |
| Selar crumenophthalmus | Selcru | 0.10 ± 0.07 | 0.2 | 97.1 | 21.1 | 0 | F&BI |
| Xenichthys xanti | Xenxan | 0.10 ± 0.05 | 0.2 | 97.3 | 15.2 | 0 | Zo |
| Centropomus robalito | Cenrob | 0.10 ± 0.08 | 0.2 | 97.5 | 20.9 | 0 | F&BI |
| Polydactilus approximans | Polapp | 0.08 ± 0.04 | 0.2 | 97.7 | 21.7 | 33 | BI&F |
| Sphoeroides annulatus | Sphann | 0.08 ± 0.06 | 0.2 | 97.9 | 25.9 | 100 | SBI |
| Acanthurus xanthopterus | Acaxan | 0.06 ± 0.06 | 0.1 | 98.1 | 25.5 | 100 | Pb |
LM= length at maturation (cm). % < LM= % of individuals with TL less than LM. Categories of main food: D= Detritus; Pb= Phytobenthos; PpPb&BI= Phytoplankton, Phytobenthos & small invertebrates; Zo= Zooplankton; SBI= Small benthic invertebrates; BI= Benthic invertebrates; BI&F= Benthic invertebrates & Fishes; F&BI= Fishes & benthic invertebrates; F= Fishes. Main food data was obtained from FishBase (Froese & Pauly, 2018).
The analysis of size composition of fish pertaining to most abundant species allowed the identification of those which appear in the lagoon predominantly as juveniles or as adults (Table 2). Individuals of 11 species were always in juvenile stage. This was the case for A. xanthurus, C. caninus, C. chanos, D. brevirostris, D. holocanthus, D. hystrix, L. colorado, S. sierra, S. peruviana, S. annulatus and T. kennedi. Fish of other three species were mostly juveniles, namely A. guatemalensis and C. caballus (> 80 %) or were juvenile in more than 50 % (G. simillimus). Finally, 10 remnant species appeared mostly as adults. In summary, around 85% of total individuals caught during sampling operations were juveniles. Most species (83 %) and individuals (98 %) sampled are demersal and include in their diets benthic invertebrates as major food items. Only two species are zooplanktivores, one feeds on benthic vegetation and one is piscivorous. These four species included just 2 % of all individuals caught.
Changes in fish assemblage composition: Seasonal and spatial changes of mean abundances of the nine most abundant species showed different patterns according the species (Figure 3). In most cases interaction between factors season and zone was not significant (Table 3) with the exception of M. curema which showed opposite patterns of spatial changes in abundance during each season. Only two species (D. brevirostris and C. caninus) yielded significant differences in abundance between seasons with higher mean values during the rainy season (Table 3). Most common pattern of significant changes was found among zones. For three species (D. brevirostris, A. mazatlanus, S. ovale) mean abundance increased towards the east (highest at zone D) while three other species (C. caninus, C. orqueta, D. holocanthus) were significantly most abundant in zone B. The species G. simillimus was most abundant at zone A with very low values in other zones. Finally, S. guatemalensis was significantly most abundant in zone C (Table 3).
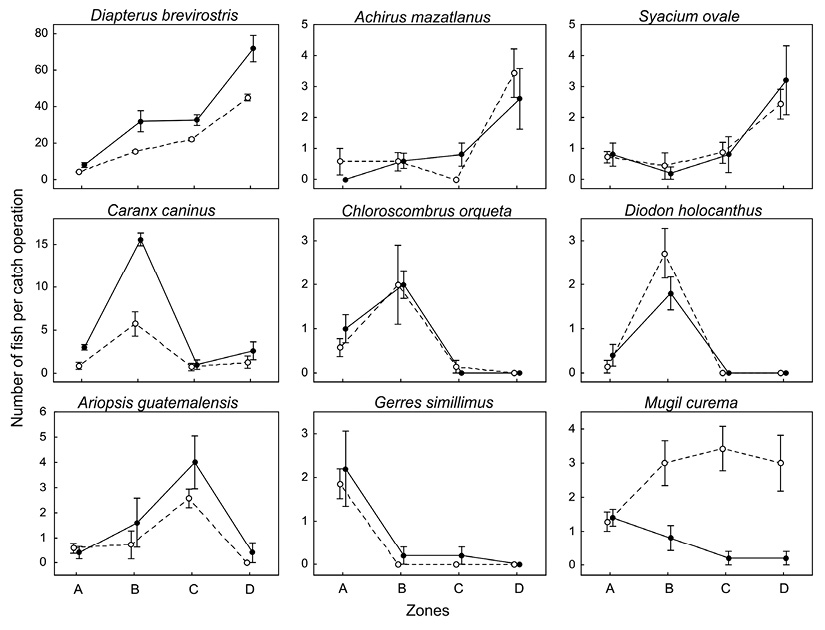
Figure 3 Mean number of fish caught per fishing operation (± standard error) for the nine most abundant species. Black circles and continuous lines: wet season; open circles and dashed lines: dry season.
Table 3: Results of generalized linear models for nine most abundant species
| Diabre | Achmaz | Syaova | Carcan | Chlorq | Diohol | Arigua | Gersim | Mugcur | ||||||
| Se | χ2 | 87.08 | 0.22 | 0.20 | 37.42 | 0.08 | 0.49 | 3.77 | 0.732 | - | ||||
| p | <0.001 | 0.638 | 0.652 | <0.001 | 0.773 | 0.481 | 0.052 | 0.392 | - | |||||
| Zo | χ2 | 594.05 | 49.88 | 31.89 | 151.47 | 46.57 | 66.24 | 49.85 | 55.21 | - | ||||
| p | <0.001 | <0.001 | <0.001 | <0.001 | <0.001 | <0.001 | <0.001 | <0.001 | - | |||||
| Se x Zo | χ2 | - | - | - | - | - | - | - | - | 13.25 | ||||
| p | - | - | - | - | - | - | - | - | 0.004 | |||||
| Pseudo-R2 | 0.918 | 0.482 | 0.384 | 0.733 | 0.622 | 0.810 | 0.475 | 0.735 | 0.538 | |||||
| zones | A | c | b | b | b | b | b | b | a | - | ||||
| B | b | b | b | a | a | a | b | b | - | |||||
| C | b | b | b | b | c | c | a | b | - | |||||
| D | a | a | a | b | c | c | b | b | - | |||||
χ2=value of Likelihood Ratio Test; p=Probability of χ2. Small case letter in last four rows indicate results of Tukey´s pairwise tests of means for each species. Se= Season; Zo= Zone. Species codes in Table 1. Bold face indicates significant values.
PERMANOVA yielded non significant interaction among zones and seasons (Pseudo-F3,40 = 1.54, P = 0.0877) but significant differences among zones (Pseudo-F3,40 = 15.41, P = 0.0001) and among seasons (Pseudo-F1,40 = 6.24, P = 0.0001). Pairwise comparisons among zones were in all cases highly significant (p=0.0001) and based in a good number of unique permutations (always > 9949). A detailed analysis of changes for each of the most abundant species between seasons and among zones was presented before. The PERMDISP test was not significant for seasons (Pseudo-F(1,46) = 0.003, P = 0.9542) and marginally significant among zones (Pseudo-F(1,46) = 3.815, P = 0.0372). After the pairwise test, multivariate dispersion was lower in zone D compared to other zones, which did not show significant differences among them.
Two first canonical axes of RDA explained a 23.3 % of the variation in species data (Table 4). First axis, however, identified the most important gradient with an eigenvalue of 0.195. This axis was strongly correlated with percentage of mud in sediment. The second axis was much less important (eigenvalue = 0.038) but was clearly correlated with salinity (negatively) and temperature (positively) identifying a second, weaker seasonal gradient. Forward stepwise selection of variables indicates that mud percentage is the most important variable explaining the ordination patterns (79 % of explained variance), followed by salinity (16.6 % of explained variance). Axis 4 is non-canonical and equivalent to the first axis of a PCA performed on the matrix of residuals. Its high eigenvalue indicates that there are other factors not controlled in this study which could explain a part of the remaining variation not accounted for by the canonical axes.
Table 4: Summary of redundancy analysis
| Summry of the ordination axes | 1 | 2 | 3 | 4 |
| Eigenvalues | 0.195 | 0.038 | 0.006 | 0.167 |
| Species-environment correlations | 0.858 | 0.620 | 0.329 | 0.000 |
| Cumulative percentage variance | ||||
| Of species data | 19.5 | 23.3 | 23.9 | 40.7 |
| Of species-environment relation | 81.3 | 97.3 | 100.0 | 0.0 |
| Canonical coefficients for standardized variables & inter-set correlations of environmental variables with species axes | Canonical coefficients | Inter set correlations | ||
| Axis 1 | Axis 2 | Axis 1 | Axis 2 | |
| Salinity | -0.038 | -0.746 | -0.050 | -0.600 |
| Temperature | 0.062 | 0.328 | 0.106 | 0.512 |
| Mud | 0.994 | -0.084 | 0.854 | -0.055 |
Samples taken in zones A and B had mostly negative scores on first axis of RDA and are clearly separated from samples of zones C and D which have in all cases positive scores on this axis (Figure 4). This indicates a major separation along a gradient of increasing mud contents in sediments. Abundance of the species D. brevirostris is highly correlated with this axis while species C. caninus, D. holocanthus and C. orqueta showed high negative correlations. A less sharp separation of samples occurs along the second axis, with most samples of dry season lying on the negative side and most samples of rain season lying on the positive side. The abundance of the species M. curema is negatively correlated with this axis.
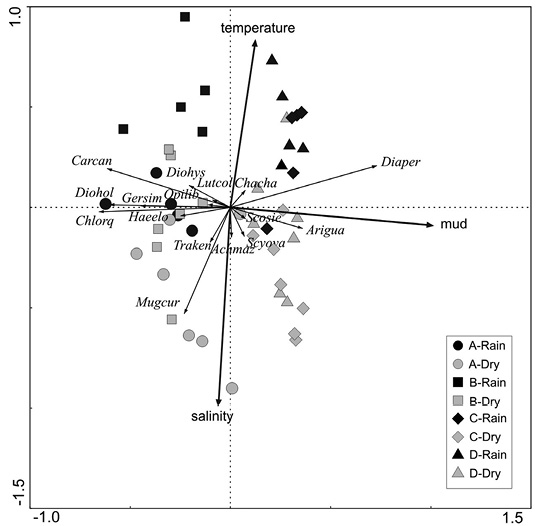
Figure 4 Triplot showing results of Redundancy Analysis based on Hellinger’s transformation of the values of number of fish caught per fishing operation. Data points classified after sampling zones (see figure 1) and season. Species codes in Table 2.
Discussion
The main result of this study was that fish assemblage’s composition varies along two main gradients defined by mud fraction of sediments in a small spatial scale (~ 3 km) and salinity in a seasonal scale. The influence of sediment grain size on fish assemblages composition has been proposed by Franco et al. (2011) while the change of estuarine fish species composition with salinity has been found also in other studies (Barletta et al., 2005; Costa de Azevedo et al., 2007).
The background for a correlation between sediment characteristics (i.e. mud fraction and organic matter contents) and species composition of a fish assemblage lies in the relationship between benthic invertebrates, which are a main component of the diet in estuarine fishes, and sediment features. The response of benthic macrofauna to percentage mud is very strong with the consequence of a species turnover in the composition of benthic assemblages along gradients of sediment particle mean size (Anderson, 2008; Van Colen et al., 2014). A high percentage of species and individuals collected in this study include benthic invertebrates as a major component of their diets and the most important species by its numeric representation (D. brevirostris) feeds exclusively on small benthic invertebrates (Chávez-Comparán & Hammann, 1989). It is very difficult, however, to find specific explanations for the response patterns of individual species. Detailed information on the composition of food, ecomorphology and feeding behavior of each species together with good knowledge of benthic assemblages used as food sources would be needed for an explanation of why a species appears with more abundance in some places along the mud percentage gradient.
Most fishes found in estuarine systems are euryhaline and can support daily and seasonal changes in salinity, but most of them have a salinity optimum (Barletta et al., 2005) and this feature is the basis for expecting some change in fish assemblage composition correlated with changes in salinity. In this study, spatial differences in salinity were small and not significant while changes between seasons were significant. At least three fish species showed significant differences between seasons in their abundance (D. brevirostris, C. caninus and M. curema).
An explanation of changes in fish assemblage composition as a consequence of individual species responses to abiotic factors agrees with a widely accepted paradigm (Marshall & Elliot, 1998; Kupschus & Tremain, 2001; Rodriguez-Climent, Caiola, & Ibañez, 2013). Other authors, however, have emphasized that environmental variables are not the exclusive drivers of estuarine fish assemblage’s changes and a set of biotic processes (e.g. reproduction, recruitment, ontogenic migrations and habitat shifting) should also be considered. Such life cycle traits present a high inter-species variability and a good understanding of them is essential for a more comprehensive explanation of spatial and temporal variations in the composition of the estuarine ichthyofauna (Barletta et al., 2008; Sheaves & Johnston, 2009).
In the present study, strong evidence was found for seasonal and spatial changes in the composition of fish assemblages. The attempt to explain these changes using three environmental variables in a direct gradient analysis yielded significant relationships with assemblage composition but the percentage of variation explained by canonical axes was less than 25 %. This result indicates that other factors should be influencing changes in assemblage composition. For example, spawning is a seasonal process in most fish species and recruitment pulses should also be seasonal. As most species appear as juveniles in the lagoon, fluctuations in their abundances can be linked, at least partially, with recruitment events.

