The dolphinfish, Coryphaena hippurus (Linnaeus, 1758), is a highly migratory pelagic species found in extensive areas of the world's oceans. It lives in tropical and subtropical areas of the Atlantic, Indian, and Pacific Oceans (Massuti, Deudero, Sanchez, & Morales-Nim, 1998; Norton, 2000; CIB, 2007; Merten, Appel-doorn, & Hammond, 2014) and is believed to migrate seasonally to warm areas (mean water temperature of 28°C) (Palko, Beardsley, & Richards, 1982). Coastal distribution and abundance seems to be strongly related to surface temperature and distance from temperature fronts (Farrel, Boustany, Halpin, & Hammond, 2014; Furukawa et al., 2014). The dolphinfish has a high growth rate and fast sexual maturity (Alemany & Massuti, 1998; Castro, Santiago, Hernandez-Garcia, & Pla, 1999), which may be associated with physiological adaptations for a pelagic predator (Benetti, Brill, & Kraul, 1995). The dolphinfish is a general predator that feeds on fish, crab, and squid; this species expends a lot of energy seeking and catching prey in the epipelagic zone, and it consumes ~5.6% of its body mass in food each day (Olson & Galvàn-Magana, 2002; Aguilar-Palomino et al., 1998). The dolphinfish can reach up to one meter long and weighs up to 8 kg in its first year of life, and lives an average of two years and a maximum of five years (Beardsley, 1967). Between these ages it can reach 2 m long and weigh up to 40 kg. From six months old, males are usually bigger and heavier than females, and their neurocranium develops more in the front part of their head (Benetti, Brill, & Kraul, 1995). Males and females mature at four or five months, start to reproduce when they reach 20 cm long, and reproduce about three times a year (Hagood, Rothwelly, Swafford, & Tosaki, 1981; Chatterji & Ansari, 1982).
The dolphinfish is exploited in industrial, small-scale artisanal and recreational fisheries (Palko et al., 1982; Sakamato & Kojima, 1999; Morales-Nim et al., 1999; CIB, 2007). Most of the existing information about dol-phinfish fishing is based on studies conducted in warm water, especially in the South East of the United States (Palko et al., 1982; Thompson, 1999; Norton, 2000; Merten et al., 2014), Japan (Sakamoto & Kojima, 1999), the Western Atlantic and the Caribbean (Oxenford, 1985, 1999; Oxenford & Hunte, 1986) and the Mediterranean Sea (Massuti & Morales-Nim, 1997; Lleonart, Morales-Nim, Massutti, Deudero, & Reñones, 1999; Morales-Nim et al., 1999). In the Atlantic Ocean, commercial fisheries occur from Florida to Rio de Janeiro, Brazil (Palko et al., 1982; Parker, Singh-Rent-on, Hackett, & Launckner, 2000; Prager, 2000) though in the East coast of the United States (from Florida to North Carolina), recreational fishing of dolphinfish accounts for the largest proportion of fishing of the species (Oxenford & Hunte, 1986; Thompson, 1999). While in the Pacific Ocean, a large proportion of the species is also fished in Mexico, where some areas industrial fishing is prohibited and only sport and recreational fishing are allowed (Alejo-Plata, Gomez-Marquez, & Salgado-Ugarte, 2011; Alejo-Plata, Gomez, & Serrano-Guzman, 2014). In tropical zones, specifically Central and South America, the species is commercially exploited from Southern Mexico (Alejo-Plata et al., 2011, 2014) to Southern Peru in the Pacific Ocean (Estrella, Guevara-Carrasco, & Palacios, 1998; Lasso & Zapata, 1999), and the Gulf of Mexico to South West Caribbean (Mahon & Oxenford, 1999; Parker et al., 2000; Prager, 2000).
In the Eastern Tropical Pacific (ETP), the highest exploitation rates of dolphinfish occur in Costa Rica and Ecuador (Patterson & Martinez, 1991; Martínez-Ortiz & Zúñiga-Flores, 2012). In these countries, exploitation of this species is higher than observed in shrimp (Peneidae) and sharks (Carcharinidae), but slightly lower than values registered for tuna (Campos, Segura, Lizano, & Madrigal, 1993; Lasso & Zapata, 1999). Throughout this region, dolphinfish is subject to different fishing methods. For example, in Mexico dolphinfish is reserved for sport fishing and commercial exploitation is prohibited (Rocha-Olivares & Chavez-Gonzalez, 2008). In other regions of the ETP, industrial fishing of the species is very important for the local economies (Lasso & Zapata, 1999). Dolphinfish also is taken from the Central Eastern Pacific: 60% of the total incidental catch of this species reported for tuna purse-seine fishing occurred in this area (Martinez-Rincon, Ortega-Garcia, & Vaca-Rodriguez, 2009).
In Panama, the dolphinfish is among the most commercially important species, as industrial and small-scale fisheries and recreational fishermen fish it. However, no specific information about the fishery in Panama exists. Lasso & Zapata (1999) suggested the existence of only one stock in the Gulf of Panama and that it is related to the previously established stock for Costa Rica, Colombia, and Ecuador.
Herein, we evaluated the dolphinfish fishery in Pacific waters of Panama for the first time. We generated a growth model and examined fluctuations in annual total catch and in catch per unit effort (CPUE) per year of the species over a four-year period (2006-2009) using data collected from industrial vessels in the Gulf of Panama and the Gulf of Chiriquí and filling the existing gap in information about dolphinfish between the Central American and Northern South American fisheries. The results can be used to begin to develop a regional management strategy for conservation of this resource.
Materials and Methods
Sampling: The biometric data used in this study are based on catches of dolphinfish from the industrial fisheries in open-sea Gulf of Panama/Gulf of Chiriqui and coastal Gulf of Chiriqui, which are located in the Pacific Ocean of the Republic of Panama. Coordinates for fishing grounds were not provided by fishermen adducing confidential information from the industry. Between November 2007 and January 2010, biometric measurements (length, weight, visual maturity, and sex) were made onboard industrial vessels and at processing plants, and landing sites, following standard procedures. Total length of specimens was measured using a custom-made ichthyometer to the nearest mm and weight with a digital crane scale Model OCS to the nearest 0.1kg. Sampling of all four parameters was conducted only onboard vessels, however maturity (e.g., sexual mature) of individuals was not measured at the processing plants and landing sites because the fish had already been gutted, and was obtained for general information and not for quantitative analyses by gross visual examination of the gonads (sensu Schwenke &amp; Buckel, 2008). Gross visual examination of ovaries was used to classify maturity stages: stage I, immature; stage II, early maturity; stage III, late maturating; IV, ripe; and stage V, spent (for details see Bearsley, 1967). Sex was determined through fish external morphology and macroscopic examination of the gonads. A total of 14 913 dolphinfish were measured from the industrial fishery: 10 459 fish represented open-sea fishing (> 50 km from shore) in the gulfs of Chiriqui and Panama, and 4 454 exclusive from near shore (< 50 km) Gulf of Chiriqui, respectively. Access to small-scale artisanal fishing in the Gulf of Panama was limited and not included in the study.
Length-weight relationship and age-growth model: The length-weight relationship was determined based on length and weight data from the 10 459 dolphinfish collected onboard open-sea vessels, because the remaining 4 454 only length was measured. The FAST 2.1 program (Slipke &amp; Maceina, 2005) was used to calculate both regressions and a length versus age chart. This program had been designed exclusively for fishery analysis showing reliable results in similar studies (Sakaris, Daugh-erty, &amp; Buckmeier, 2011; Kaeser, Bonvechio, Harrison, &amp; Weller, 2011). Dolphinfish growth was determined by the von Bertalanffy model (von Bertalanffy, 1938) using the equation Lt=L^ (1- e-K(t - t0)). In addition, parameters (a, b, K, and 9) were also determined from the length-weight relationship.
Size, age distribution, sex ratio, and weight structures: A size frequency histogram was constructed based on total length (TL) data in millimeters. Among fishery studies means in TL, standard length and fork length are very consistent and evidence of reduced bias between these measurements has been observed (Kahn, Pearson, &amp; Dick, 2003). Once the different age classes were determined following size criteria established by Palko et al., 1982, a catch by age chart was created using the program FAST 2.1 (Slipke &amp; Maceina, 2005). The sex ratio was determined by the ratio of the sexes (female/male) present per year. A pronounced crest in the males and absence in females determined sex difference while in young animals a macroscopic examination of the gonads was conducted (Collete, 1995). Exploratory analyses found these data to be skewed and non-parametric. Therefore, consistency of age and size structure was tested using a Kruskall-Wallis among years and a Mann Whitney pairwise test between sexes per year. The overall weight fluctuation of the fish was also analyzed per year using descriptive statistics.
Fishery assessment and CPUE: Overall assessment of the open-sea industrial fishery (n = 10 459) was made using collected data (weight, size, and sex) and total catch data records from the processing plant (2006-2009). Seasonal analysis of the catch was examined by comparing interannual and intra-annual data. CPUE was determined by kg/day/vessel tabulated and charted per year and month for the four-year period studied (Everhart &amp; Young, 1981). Typically, a vessel used ca. 1 000 hook/day in average (range 700-1 700). The significance of the interannual and intra-annual fluctuations in catch per year and by month was measured using Kruskal-Wallis test.
Mortality: Mortality was estimated using an empirical formula of Pauly (1980) using a Weighted Catch-Curve Regression analysis that allows us to estimate natural mortality (M) and survival (S) using the software FAST 2.1. We also estimated the K/M ratio for C. hippu-rus also using FAST 2.1.
Results
The average size for the 10 459 fish caught by open-sea fishery was 1 011 ± 1.71 mm (± se) and the range was 353-1 715 mm. For the coastal fisheries, the average size of the 4 454 fish from the Gulf of Chiriqui was 1 069 ± 2.48 mm (range, 589-1 840 mm). Four age classes were recorded among the fish. The greatest number of fish fell within age classes 2 and 3 while a reduced number of individuals belong to age classes 1 and 4.
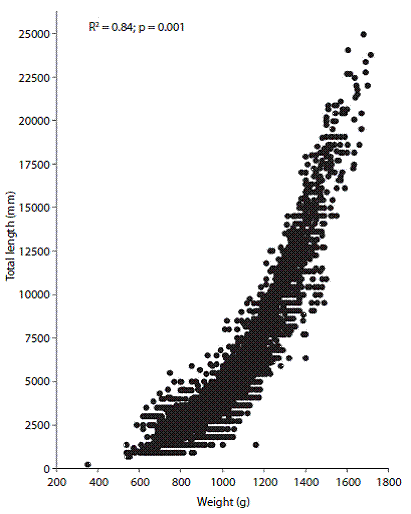
Length-weight relationship and age-growth model: The length-weight relationship was significant and positive (r2 = 0.841, p < 0.001) (Fig. 1). The growth parameters used to develop the von Bertalanffy equation were also obtained from this relationship (a = -6.73, b = 3.44, K = 0.36 mm/year, and =1 715 mm), and the model calculated from these values revealed a growth efficiency of 9 = 4.61.
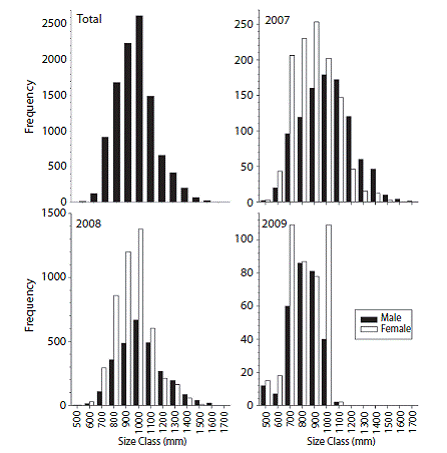
Size structure, age distribution, sex ratio, and weight range: The maximum sizes of C. hippurus for the open-sea fishery (10 459) corresponded to ages 3 (1 200 mm-1 499 mm) and 4 (1 500-2 000mm). However, the greatest number of fish belonged to age class 2 (600-1 199 mm) while fish smaller than 599mm were considered at age 1. The frequency histogram showed a normal size distribution between 353 mm and 1 715 mm, with an average size of 1 010.85 mm and a mode of 1 000 mm among the four age classes observed (Fig. 2). Interannual comparisons (2007-2009) revealed that females were abundant in the fishery for the three years period and age class 2, with maximums numbers in 2008 and maximum size skewed to class 3 in 2009 (Fig. 2).
The weight of the sampled fish ranged from 0.22 to 29.71 kg, with an average weight of 4.94 kg and a mode of 2.7 kg. In the total sample, the sex ratio favored females at 1.5:1 (females/males). However, 86% of fish with lengths of > 1.5 m (ages 4 and 5) were males. Regarding fecundity, > 90% of the analyzed individuals exhibited grade III of maturity (i.e., sexually mature females with enlarged ovaries and at least two distinct size of eggs easily visible at naked eye bright yellow to orange).
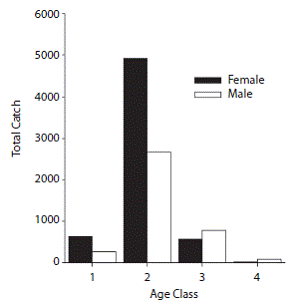
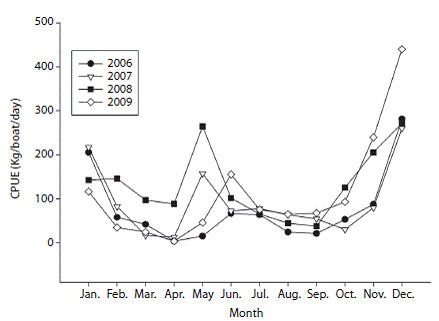
Assessment of fishing and CPUE: Catch data by age and sex revealed that the highest numbers of fish caught were in age class 2 (mm) and medium catch values were recorded for age 3 (mm) while the lowest catch values were reported for ages 1 (< 599 mm) and 4 (1 500-2 000 mm). Females were dominantly abundant than males at age 2 and relatively similar for other ages (Fig. 3). Analysis of the total catch per year showed an increase in fishing activity over the past few years, with maximums in 2008 (1 370T) and 2009 (1 114T) (Table 1). Similarly, the highest numbers of vessels were recorded in the area in 2008 and 2009 (Table 1). Nevertheless, this increase in fishing activity was not significant (Kruskall-Wallis, H = 5.482, p = 0.140). Similarly, CPUE showed maximums in 2008 and 2009 (Table 1). For the four-year study period, the values of this variable ranged between 3.4 and 440.43 (kg/day/ vessel), with an average of 104 (kg/day/vessel). The interannual and intra-annual variation of CPUE showed two annual maximums, a highest intensity one between November and January (with maximums in December) followed by April and May; these patterns were consistent during the four years studied (Fig. 4).

Fig. 2: Overall size frequency distribution and interannual (2007-2009) comparison by sex for Coryphaena hippurus industrial fishery in Pacific Panama.

Fig. 3: Total catch (T) per age and sex for Coryphaena hippurus in Pacific Panama: age 1 (0-599 mm), age 2 (6001 199 mm), age 3 (1 200-1 499 mm), age 4 (1 500-2 000 mm).
Mortality: Calculated mortality (M) and survival (S) values using a Weighted Catch-Curve Regression analysis were 0.524 and 0.476 respectively. K/M ratio was 1.44 using the K value of 0.36 (mm/year) obtained from the length-weight relationship discussed in previous section.
Discussion
Developing an accurate growth model and understanding the selective pressures experienced by fish due to fishing (e.g. mortality due to overfishing and the fishing effort, among others) are essential for long-term and efficient management, and for maintaining sustain-ability and reproductive capacity (fitness) of dolphinfish (Maunder et al., 2006; Schwenke &amp; Buckel, 2008). The failure to effectively manage marine resources can have severe economic consequences in developing countries, particularly those whose economic growth is strongly supported by the fishing sector (Montenegro, 2007). Dolphinfish is one of the main fish species of commercial importance in the corridor of the Eastern Tropical Pacific and, although it is fished across its distribution in the corridor there is no evidence of overexploitation of the resource in this zone, based on industrial and recreational fishing.
Our results showed an age distribution and size frequency histogram with a normal distribution and maximums similar to those found for dolphinfish in the central Atlantic (Canary Island) (Castro et al., 1999) for oceanic and coastal zones of the North Pacific Ocean (CIB, 2007; Ditty, Shaw, Grimes, &amp; Cope, 1994), the Tehuantepec Gulf in Mexico (Alejo-Plata et al., 2011) and the Eastern Tropical Pacific (Campos, et al., 1993; Lasso &amp; Zapata, 1999; Martínez-Ortiz &amp; Zúñiga-Flores, 2012). Furthermore, the maximum size and weight recorded in this study (1 715 mm and 29.71 kg, respectively) were close to the maximums recorded in other zones (2 000 mm and 30 kg) (Uchiyama, Burch, &amp; Kraul, 1986; Lasso, 1996; Díaz-Jaimes, Uribe-Alcocer, Ortega-Garcia, &amp; Durand, 2006). A latitudinal variation in size has been observed in Ecuador, increasing in size toward the North (Martínez-Ortiz &amp; Zúñiga-Flores, 2012).
Table 1: Total annual catch (t), mean monthly catch (t), mean catch per unit effort (CPUE; kg/day/vessel), and total number of vessels per year


Fig. 4: Monthly catch per unit effort (CPUE; kg/vessel/day) for Coryphaena hippurus in Pacific Panama between 2006 and 2009.
Although the sex ratio of the total sample favored females, 86% of males belonged to ages 3 and 4 with the biggest sizes reported only male individuals 1 700 and 1 751 during 2008. This size distribution that favors males is consistent with results reported in previous studies for the species (Rose &amp; Hassler, 1969; Palko et al., 1982; Alejo-Plata et al., 2011). A possible explanation for the lack of females in the larger size classes is either males have a life expectancy that is slightly longer than that of females or the sexes may exhibit differential patterns of distribution during the last season of growth (Rose &amp; Hassler, 1969; Oxenford, 1999)
The length-weight and age data in this study were similar to those recorded in other dolphinfish studies (Rose &amp; Hassler, 1969; Rivera &amp; Appeldoorn, 2000) and reflect allo-metric growth. The K value (0.36 mm/year) recorded in this study is within the range previously reported for the species and is close to that recorded by Patterson and Martinez (1991) (K = 0.41) for dolphinfish populations in Ecuador and K = 0.40 for Indian Ocean populations (Benjamin &amp; Madhusoodana, 2012). Martinez-Ortiz and Zuniga-Flores (2012) recently reported K values of 0.37 and 0.38 for males and females, respectively. Our study shows K values between 0.25-1.18, which is consistent for species with a high growth rate (Uchiyama et al., 1986; Patterson &amp; Martinez, 1991; Castro et al., 1999; Lasso &amp; Zapata, 1999). The growth efficiency calculated in this study was 4.61, which is within the range reported for Coryphaena hippurus (3.95-4.70), and similar to 4.07 reported for Ecuador (Martinez-Ortiz &amp; Zúñiga-Flores, 2012) and 4.18 reported by Alejo-Plata et al. (2011). This high growth rate also reflects the fast maturity of the species (Pew, 1957; Hinton, 1962; Castro et al., 1999), which allows them to reach commercial sizes and weights in a short period of time.
Few studies have analyzed mortality. Obtained mortality value (0.52) as well as K/M ratio (1.44) is similar to previous values obtained for C. hippurus and close related species (Bentivoglio, 1988; Oxenford, 1985; Murray, 1985; Sparre &amp; Venema, 1992; Benjamin &amp; Madhusoodana, 2012, Manjusha et al., 2012). In particular, Murray (1985) and Manju-sha et al. (2012) reported comparable values of 0.66 and 0.60, respectively.
Previous studies have reported seasonal variations in catch and CPUE for this species, with two maximums: the first between December and February and the second between April and May (Lasso &amp; Zapata, 1999), contrasting with Ecuador that shows only one maximum between October and February with a peak in December (Martinez-Ortiz &amp; Zúñiga-Flores, 2012). These maximums are consistent with those recorded in our study. The two catch maximums were also consistent in the seasonal scale studied. Recently, Zuñiga, Ortega-Garcia and Klett-Traulsen (2008) demonstrated a positive and significant correlation between catch of dolphinfish and surface temperature, and it is possible that temperature plays a key role in determining reproduction and nursery zones of species populations (Ditty et al., 1994; Alemany &amp; Massuti, 1998). In conjunction with surface temperature, reproductive pattern might play an important role in the bimodal distribution of the CPUE observed in this study. Although the species can consistently reproduce throughout the year (as indicated by the presence of mature individuals and females in stage 3 throughout the year), data indicate that the species has a bimodal reproductive pattern (Zapata, 1993; Estrella et al., 1998; Lasso &amp; Zapata, 1999).
Although the increase in the number of boats coincided with the years of the largest catch rates and CPUE (2008 and 2009), the increase in the number of boats per year was not significant (p = 0.140). This shows that the increase and fluctuation in the catch can be affected by other factors, such as changes in the surface temperature, migration, and reproduction, and not only fishing effort (Kingsford &amp; Defries, 1999; Kraul, 1999). The maximum catches observed coincided with the dry season, during which lower surface temperature values were recorded in the Gulf of Panama as a result of the upwelling process (D'Croz &amp; O'Dea, 2007). Similarly, between 1994 and 1996, the peak catches occurred between December and April in Colombian waters (Lasso &amp; Zapata, 1999). In other areas, such as the Baja California Peninsula, C. hippurus migrations have been observed associated with variations in the surface temperature (Norton, 2000). Additionally, migrations of the species to the South have occurred in the Eastern Tropical Pacific due to the influence of the El Niño phenomenon (Estrella et al., 1998).
Although the calculated CPUE values in our study correspond only to dolphinfish caught by the industrial fishery, these values provide a good preliminary estimate of the interannual and intra-annual fluctuations of fishing activity and their possible effect on the sustainability of the species (Kraul, 1999). Although CPUE usually is used to estimate fishing stocks and their abundance, the use of this kind of data is complicated because CPUE rarely tells the full story of exploitation of a species that is affected by more than one factor (Lleonart et al., 1999; Maunder et al., 2006). The CPUE data obtained in this study were within the range of values estimated by Lasso and Zapata (1999), which included populations from Panama, Colombia, and Ecuador. Although our values reflect only industrial fishing (which has been estimated to account for 60% of total fishing of the species in other countries, including small-scale fishing and, in some cases, recreational fishing), our total catch values and CPUE are well below the high value recorded in 1990 in Ecuador (11 600T) the zone with the highest catch in the Pacific Ocean (Patterson &amp; Martinez, 1991) using longlines with 100-700 hooks, and other zones of the Pacific (Kraul, 1999). This may be a good indicator of the sustain-ability of dolphinfish populations in Pacific Panama. Another good indicator of fishing sustainability may be the low rate at which the small fish (< 599 mm age 1) are caught (e.g. reduced number of fish were caught at this size class and age); this value could be used for the future establishment of a minimum catch size in Panama. Furthermore, the increasing slightly trend if annual catch suggests that the fishery needs to be regulated in the near future (e.g. quota, minimum size, number, size and type of hook, length of long-line, fishing ground, among others).
In the future, better fishing estimates are needed, including catch estimates for the rest of the Panamanian industrial fleet and more data on small-scale artisanal and recreational fishing, which have proved to be relevant in zones of the Pacific Ocean such as Mexico (Rocha-Olivares &amp; Chávez-González, 2008). This study did not evaluate extensively the small-scale artisanal fishing that occurs in coastal waters, where we believe larger populations of young individuals vulnerable to overexploitation may exist. Finally, stock assessments along the Eastern Tropical Pacific are essential for establishing regional management and conservation policies for dolphinfish, and may include a large-scale tagging program to evaluate spatial and temporal movements in this region (sensu Merten et al., 2014), particularly, between Colombia and Costa Rica.


 uBio
uBio 


