


Services on Demand
Journal
Article
 English (pdf)
 Article in xml format
 Article references
 Send this article by e-mail
Indicators
-
 Cited by SciELO
 -
 Access statistics
Related links
-
 Similars in
SciELO
Similars in
SciELO  uBio
uBio
Share

 Permalink
Revista de Biología Tropical
On-line version ISSN 0034-7744Print version ISSN 0034-7744
Rev. biol. trop vol.62 n.3 San José Jul./Sep. 2014
Efficacy of calcein and Coomassie Blue dyeing of shell growing-edges and micro growth-bands: Ageing juvenile of Pinctada mazatlanica (Pterioida: Pteriidae)
Eficiencia de la tinción de bandas de crecimiento con calceina y azul de coomassie, para estimar la edad de jóvenes de Pinctada mazatlanica (Pterioida: Pteriidae)
Eficiencia de la tinción de bandas de crecimiento con calceina y azul de coomassie, para estimar la edad de jóvenes de Pinctada mazatlanica (Pterioida: Pteriidae)
Abstract
Age validation is the first step to determine shellfish species age determination. This information is vital for different inferential models used in marine ecosystem management activities. In spite that various validation techniques are used for marking carbon calcium structures, the calcein marking technique for oysters had never been used for age validation in Pinctada mazatlanica. Thus the objectives of this study included: the evaluation of calcein to mark a shell growing-edge, and the efficacy of Coomassie Blue staining on posterior shell growth, to produce visible micro growth-bands that would enable age validation of juvenile mother-of- pearl oysters. Oysters were collected and cultivated at The Perlas del Cortez S. de R. L. MI. pearl-farming opera tion, in Pichilingue, La Paz Bay, Baja California Sur, Mexico; a total of 36 oysters (shell height 11.5-36.4mm) were injected with calcein (0.125g/L), and another 50 oysters (shell height 14.8-42.7mm) were submersed in calcein (0.4 and 0.7g/L). Shell slices of calcein-marked oysters were posteriourly stained with Coomassie Blue R-25 for micro growth-band recognition. Our results showed that Calcein marking only worked by submersion and produced a concise bright lime-green florescent band along the growing-edge with clear boundaries for both concentrations. However, marks resulted better at the lower calcein concentration (0.4g/L) with more “perfect” and “good” marks on the growing-edge (p=0.0012). Commassie Blue staining technique was successful, and allowed to conclude that one micro growth-band was laid down per day, similar to other oyster species. Mean 15-d increment of shell growth height was slightly greater at the lower calcein concentration (
 =0.735mm) than at the higher one (
 =0.577mm) (not significant difference, p=0.198). Calcein marking of shell growing- edges and Commassie Blue staining of posterior shell growth, as a method for age validation is recommended for shellfish shell growth-band counts. This will allow back-dating for estimation of very precise colonization dates, both spatially and temporally in future work.
 Key words: age validation, calcein, coomassie blue dye, Gulf of California, micro growth-bands, Pinctada mazatlanica, shellfish.
Resumen
La validación de la edad es el primer paso para determinar las edades de las especies de moluscos, esta información es de vital importancia para los diferentes modelos de inferencia utilizados en actividades de gestión de los ecosistemas marinos. Diversas técnicas de valida- ción se utilizan para marcar estructuras de carbonato de calcio, aunque la técnica de marcado de calceína en ostras nunca se había utilizado para la validación de la edad de P. mazatlanica. Los objetivos de este estudio fueron: evaluar la calceína como marcador interno de la concha y la eficiencia del azul de Coomassie en la tinción de la matriz proteica de la concha, para facilitar la observación y conteo de micro bandas de crecimiento que permiten validar la edad de las ostras juveniles de madre perla. Las ostras fue- ron recolectadas en la costa de la empresa Perlas del Cortez S. de RL MI., en Pichilingue en Bahía de La Paz, Baja California Sur, México. Se inyectaron 36 ostras (altura de concha 11.5-36.4mm) (0.125g/L de calceína) y otras 50 ostras (altura de la concha 14.8-42.7mm) se sumergieron (0.4 y 0.7g/L de calceína). Secciones de la concha marcadas con calceína fueron teñidos con azul de Coomassie R-25 para el reconocimiento de las micro bandas de crecimiento. El marcado con calceína fue exitoso por inmersión y produjo una banda fluorescente de color verde lima brillante con- cisa a lo largo del crecimiento interno de la concha. Sin embargo, las marcas fueron mejores a una concentración de calceína inferior (0.4g/L), con mayor cantidad de marcas “buenas” y “perfectas” (p=0.0012). La técnica de tinción con azul de Commassie también fue exitosa. Se detectó un crecimiento diario por micro banda, similar a lo encontrado en otras especies de ostras. La diferencia del crecimiento medio en relación a la altura de la concha en un lapso de 15 días, fue ligeramente mayor con una concentración de calceína inferior (
 =0.735mm) que con la de mayor concentración (=0.577mm), pero no significativamente (p=0.198). El marcado de conchas con calceína y tinción de matrices proteicas con azul de Coomassie posterior a su crecimiento, es recomendando como un método para la validación de la edad facilitando el conteo de micro bandas de crecimiento internas de la concha. Además, permitirá estimar edades con el fin de predecir fechas de colonización y ubicación de bancos naturales.
Palabras clave: calceina, Golfo de California, micro-bandas de crecimiento, ostras, madreperla, Pinctada mazatla nica, azul de coomassie, validación de edad.
Age determination of shellfish is an important variable used by fisheries and government institutions in the application of several inferential prediction models. This information allows researchers to make decisions about distinct situations concerning wild mollusk populations or aquaculture activities around the world. In Baja California, México this information is crucial for management decisions of many federal institutions responsible for marine areas concerning: aquaculture activities, sustainable fishing, establishment of marine legislation and marine reserves (Cudney-Bueno et al., 2008; Erisman et al., 2011), and for ecosystem-based management within the Gulf of California (Wilson, 2006; Leslie & McLeod, 2007; Leslie, Schluter, Cudney-Bueno, & Levin, 2009; Ainsworth et al., 2012).
Techniques for ageing have been tested in several studies by using various chemicals as markers of different marine organisms containing calcium-carbonate (Nakahara, 1961; Hidu & Hanks, 1968; Jones, Thompson, & Ambrose, 1978; Monaghan, 1993; Pricker & Schiel, 1993; Day, Williams, & Hawkes, 1995; Peck, Baker, & Conway, 1996; Mohler, 1997; Campana, 2001; Fujikura, Okoshi, & Naganuma, 2003). Bivalves are filter feeders and accumulate inorganic elements and organic compounds from the water column by ingestion (Jing, Li, xie, & Zhang, 2006). Ingested elements and compounds translocate from tissue to the out- side epidermis of the mantle to the extrapallial fluid and then are incorporated into the inner surface of the newly forming calcium carbonate growth-band (Tynan, Eggins, Kinsley, Welch, & Kirste, 2005).
Poly-anionic calcein (fluorescein complex) is a fluorescent compound that unites to CaCO3 in growth structures that are bio-mineralized (such as shells) of organisms. Once laid down in the CaCO3 growth-band, calcein emits a lime-green fluorescent color when exposed to blue light (Wilson, Beckman, & Dean, 1987; Heilmayer et al., 2005; Tada, Fujikura, Oguri, Kitazato, & Tanabe, 2010; Linard et al., 2011), which was shown highly advantageous and appropriate, over other methods, in aiding the determination of growth increments after initial calcein mark incorporation into the growing- edge in certain bivalves (Kaehler & McQuaid, 1999; Fujikura et al., 2003; Heilmayer et al., 2005; Riascos, Guzman, Laudien, Heilmayer, & Oliva, 2007; Riascos, Heilmayer, Oliva, Laudien, & Arntz, 2008; Herrmann et al., 2009; Cáceres-Puig, Huato-Soberanis, Melo-Barrera, & Saucedo, 2011).
Natural growth marks can be observed on both the outer and inner parts of shells. How- ever, external marks are lost in older organisms because of shell erosion, thus leading to the use of internal marks. Internal mark use may require the preparation of thin sections using optical microscopy. Microscopic growth increases in some calcareous structures are sometimes difficult to detect after thin section preparation (MacDonald & Thomas, 1980), thus staining might be required. To the best of our knowledge, the use of fluorescent chemical calcein as an initial marker of the growing-edge, combined with the colorimetric protein gel stainer, Coomassie Brilliant Blue R-250, as a dye of micro growth-bands in mother-of-pearl shells (Pinctada mazatlanica, Class: Bivalvia, Order: Pterioida, Hanley 1856) has not been previously investigated.
The objectives of the present study were to assess, in mother-of-pearl bivalve juvenile shells the: a) efficacy of fluorescent calcein incorporation to mark the growing-edge by injection and by submersion in two concentrations, b) survivorship of individuals and differences in shell growth submersed under two calcein concentrations, c) efficacy of Coomassie Blue dye to stain the organic protein matrix between micro growth-bands, and d) validation of ages of juvenile oysters by combined use of both dyeing techniques to establish temporal periodicity of micro growth-band deposition.
Materials and Methods
Study area: The research was carried out at The Perlas del Cortez S. de R. L. MI. pearl-farming operation, in Pichilingue (24°16’ N-110°19’ W), on the South-Eastern coast of La Paz Bay, in the state of Baja California Sur, Mexico. The median minimal sea surface temperature (SST) is 16.9°C from January to April, and the maximum SST is of 28°C from August to October. The shoreline climate is arid, with semidiurnal tides, annual precipitation of 250mm (IG-UNAM, 1992) and a median salinity of 35 to 37% (Monteforte, Kappelman-Piña, & López-Espinosa, 1995). The geological formation is of igneous granitic and andesitic rock (Castro-Aguirre, Balart, & Arvizu-Martínez, 1995), with depths going from 10m to 450m to the North, where the Alfonso Cuenca and the ocean bottom have numerous depressions and trenches (Obeso-Nieblas et al., 2008).
Oyster source: We used 86 oysters that had colonized the outer surface of commercial rearing cages. They were collected a week before the experiments (March 2008 and June 2010) and placed in 1L-sized mesh bags inside the rearing cages for further growth until extracted for use in the study.
We initially used 36 oysters for the growing-edge marking experiment with injected cal- cein in March 2008. Shell heights varied from 11.5 to 36.4mm (ventro-dorsal). Another 50 oysters were provided for the calcein submersion experiment in June 2010. Shell heights of 2010 oysters varied from 14.8 to 42.7mm.
Calcein marking of shell growing-edge by injection: We injected 36 oysters with a solution of 0.125g/L calcein (C30H26N2O13, Sigma, Chem. Abs. No. 1461-15-0) dissolved in local marine water, into the mantle cavity thru the byssus opening until it overflow (Kaehler & McQuaid, 1999; Cáceres-Puig et al., 2011). Oysters were then placed immediately inside commercial triangular rearing cages attached to an underwater, suspended long-line inside La Paz Bay at an approximate 3m depth for 16d, with a SST at 21.7±1.2°C in March 2008.
Calcein marking of shell growing-edge by submersion: In June 2010, 24 oysters were submerged in a 0.4g/L solution of calcein, using local marine water as a diluent (Fujikura et al., 2003). The remaining 26 oysters were submerged in a 0.7g/L solution of calcein (same diluent). All 50 oysters remained sub- merged for 20.30h, in dark plastic 20L capacity containers, covered with aluminum paper (to prevent degradation of the fluorescent chemicals during immersion period), and aerated by standard aquarium air pumps and air stones. The next day the 50 oysters were placed in the same commercial rearing cages at the same location and depth as injected oysters (2008) for 15d at a SST of 24.9±1.4°C, initiating at 12:30h on 22 June 2010 and finalizing at 10:00h on 8 July 2010.
All oysters were processed at the Laboratory of Fisheries Ecology at CIBNOR. Each of the 86 calcein-marked oysters were dorsal-ventral measured (height) before and after the cal- cein marking experiment, with an electronic digital vernier (Traceable Carbon Fiber Caliper 0.1mm, Ted Pella, Ultra-Cal Iv, USA).
Shell preparation: After extraction from rearing cages, each pair of shells was placed by individual on sticky plastic strips (3M Post-it Tape Flags 43x25mm, 3MTM, USA) that were labeled with a permanent marker for later individual identification. Each right shell valve was cleaned of internal tissues and prepared for examination; it was sliced and glued with cyanoacrylate ester (Instant Krazy Glue®, USA) to the surface of a piece of wood (8x3cm of length) that was attached to a slow-speed saw (Buehler Isomet Low Speed Saw with Diamond Wafering Blade - Series 20 HC Diamond, No 11-4215, Buehler®, USA).
All the shells were aligned to be sliced in dorsal-ventral (umbo-apex) sections of 76mm x 0.15mm x 1.25mm with the diamond wafering blade (UKAM Industrial Superhard Tools, USA). Each thin section was approximately 20µm thick, and was individually glued to labeled glass slides. To remove residual blade marks and expose a flat surface, thin sections were subsequently polished using three different grit size lapping films (3M Lapping Film, 3MTM, USA); grain sizes used were 30, 12 and 3µm (Kennish, Lutz, Rhoads, 1980; Cerrato, 2000). Only one thin section was prepared for each individual oyster.
Because shell composition proportions affect micro growth-band coloration (Lutz & Rhoads, 1980), all sections were observed under an optical microscope (Olympus Bx41, Olympus America Inc., Melville, NY, USA) to count micro growth-bands, differentiating horizontal clear organic matrix lines from dark aragonite lines at 20x magnification (Taylor, 1973; Blank et al., 2003; Dauphin, 2003; Nudelman, Gotliv, Addadi, & Weiner, 2006).
Additionally, fluorescent imaging was performed with the same microscope, but with a blue light filter, excited from 460 to 490nm. Calcein marks were detected at 20x magnification. Micro-photographs were captured of selected areas with a digitally- integrated camera (Cool Snap, Media Cybernetics, San Diego, CA, USA) with the Image-Pro Plus program, v.5 (Media Cybernetics, Silver Spring, MD, USA) connected to a micro-computer. Image analysis was done with Sigma Scan Pro (ver. 5.0) calibrated at 10x and 20x magnification. Image exposure times and aperture settings were constant for all micro-photographs, after preliminary testing for best images.
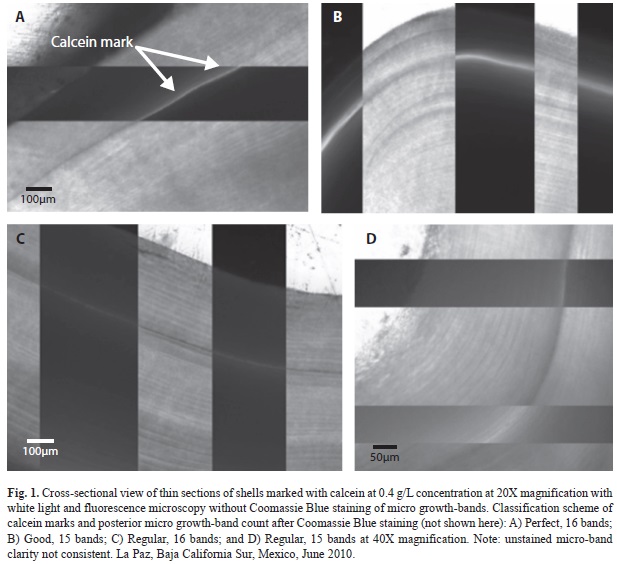
Classification of calcein marks: Calcein marks were defined as: a) “Perfect”: marking was distinct and concentrated within one micro growth-band of the growing-edge; b) “Good”: marking was distinct, but stained into successive micro-growth bands; c) “Regular”: the growing-edge was marked sometimes distinctly, other times not, with more blurring into nearby micro growth-bands; and d) “None”: no mark at all was produced or the whole image was a faint green color.
Coomassie Blue dye: Finally, all individual shell slices of calcein-marked oysters were submerged in a solution of Coomassie Blue R-250 (0.05% Coomassie Brilliant Blue R-250, 40% methanol and 7% acetic acid; the standard used for electrophoresis) for 15min. This dye binds to shell matrix proteins between successive calcium carbonate depositions. Excess dye was eliminated from shell slices with a cleanser solution (40% methanol and 10% ace- tic acid) for 5s.
Counting micro growth-bands: Sections were microscopically observed, photographed and analyzed with the same equipment and software at the same magnifications as described above. Only one slice preparation per shell was observed. For each shell slice, a random field of view with clearly-stained micro growth-bands was chosen for counting. One count was made for each shell section on each of three successive days. Random, acceptable fields of view were chosen for each count. This gave three random counts for each individual shell slice section. During each count, fine focus adjustments were needed on the microscope, especially near the outer shell margin because of differential refraction.
The dependence on type of calcein-stained mark produced by each of the two calcein concentrations used in submersion was estimated by contingency table analysis. Difference in mean 15-d growth increments between both calcein submersion concentrations was estimated with a one-way, parametric ANOvA. Differences in mean number of micro growth-bands deposited after calcein marking were estimated between both calcein submersion concentrations and between three daily counts with a two-way, parametric ANOvA (Sokal & Rohlf, 1995). Normality and homogeneity of variance assumptions were tested. A posteriori means comparisons were estimated with least significant difference, Tukey and Scheffe tests. Statistical tests were carried out with the program Statgraphics Centurion xvI (Statpoint Technologies 2007, www.statgraphics.com/statpoint.htm, 20-set-2013).
Results
Calcein-marked growing-edge by injection: None of the 36 calcein-injected oysters in 2008 presented any indication of an initially visible fluorescently-marked band. A dim green fluorescent light was emitted from the whole shell width. No mortality was observed.
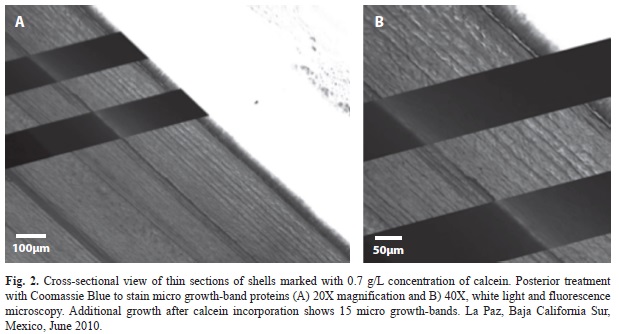
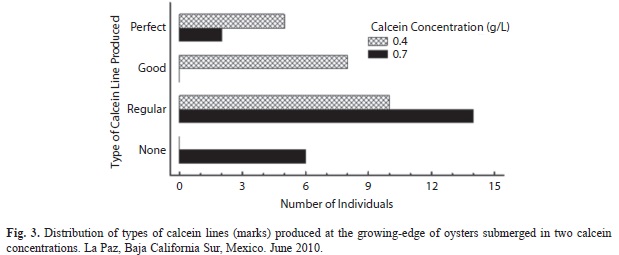
Calcein-marked growing-edge by submersion: Both submersion treatments were successful with one visible bright-green band on most growing-edges, but with different fluorescent characteristics per treatment (Fig. 1). Fluorescent bands were sometimes brighter and distinct at the greater calcein concentration (0.7g/L) (Fig. 2), but generally, results were found better at the lower calcein concentration (0.4g/L) with more “perfect” and ‘good” marks (Fig. 1a, Fig. 1b) on the growing-edge (x2=16.0, df=3, p=0.0012) (Fig. 3). Additionally, calcein-stained growing edges were vis- ible with the naked eye as dark brown narrow bands, without the blue light that produced the fluorescent green band.
Survival rate after treatments was four times higher at the lesser concentration (0.4g/L) (with only one death), when compared to the four deaths at higher concentration (0.7g/L).
Mean 15-day increment of shell height growth was slightly greater at the lower calcein concentration (
=0.735mm) than at the higher concentration (=0.577mm), but not significantly (F=1.71; df=1, 43; p=0.19).Coomassie Blue staining: Observation of thin slices not stained by Coomassie Blue R-250 usually did not show distinct micro growth-bands. visible micro growth-band col- oration or distinction was not produced, consistently, with polishing, special filters to enhance any shell auto-fluorecences, or differences in shell composition proportion affects for this oyster species. Only staining by Coomassie Blue R-250 consistently produced distinctly visible micro growth-bands (Fig. 2). It was effective for staining the organic protein matrix between micro growth-bands, allowing for easy recognition and count. However, prolonged exposure (more than 15min) with Coomassie degraded thin and younger thin slices, as well as calcein marks. Calcium carbonate layers were degraded over short time periods (hours).
Micro growth-band periodicity validation: Mean number of additional micro growth- bands, after calcein marking, was almost equal to number of days in rearing cages (15d). However, the mean number of additional micro growth-bands was slightly greater (
=14.9, SE=0.20) for the 0.4g/L calcein concentration, when compared to the 0.7g/L calcein concentration (=14.5, SE=0.23), but not significantly (F=1.61; df=1, 102; p=0.21) for the 15-d growth period. Additionally, the mean number of micro growth-bands did not vary between the three successive daily counts, when combining both calcein concentrations (=14.56, 14.53, 14.89; F=0.52; df=2, 102; p=0.60).Since the number of micro growth-bands produced by oysters was almost equal to the number of days in the rearing cages, we can safely assume that each micro growth-band was produced daily.
Discussion
Calcein used as a CaCO3-stainer was successful by immersion as a method for age validation producing a concise bright lime-green florescent band along the growing-edge with clear boundaries for both concentrations. Similar results were found with calcein marking in other bivalve species: Adamussium colbecki (Heilmayer et al., 2005; Lartaud et al., 2010), Comptopallium radula (Thébault, Chauvaud, Clavier, Fichez, & Morize, 2006), Mesodesma donacium (Riascos et al., 2007), Donax hanleyanus (Herrmann et al., 2009), Cerastoderma edule (Mahé, Bellamy, Lartaud, & de Rafelis, 2010), Pinctada margaritifera (Linard et al., 2011), Loripes lacteus (van der Geest, van Gils, van der Meer, Olff, & Piersma, 2011) and other bivalves (Rowley & Mackinnon, 1995).
However, Fujikura et al. (2003) with Ruditapes philippinarum obtained unclear calcein boundaries and preferred strontium chloride (SrCl2) staining for age validation in this species. Herrmann et al. (2009) compared calcein and SrCl2 marking efficacy with D. hanleyanus and only marking with calcein was obtained.
Regarding the calcein concentration impact on marking, our individuals produced better marking (100%) at the lower (0.4g/L) than higher concentration (73% for 0.7g/L), as well as, a better quality mark at the lesser concentration (more perfect and good marks). The 27% of oysters at the greater concentration that showed no marking, actually showed green fluorescence over the whole shell thickness, as if the greater concentration affected the complete aragonite layer. This could be an indication of the presence of porphyrins producing natural autofluorescence in the shell, also found in Pteria sterna (Cáceres-Puig, Huato-Soberanis, Melo-Barrera, & Saucedo, 2011).
Linard et al. (2011) also detected clear marks in all tested individuals (100%) at 0.150g/L calcein concentration, but observed less efficacy (65%) at 0.05g/L. However, Her- rmann (2009) got clear marks at both 0.05 and 0.1g/L calcein concentration (86% effective- ness combined of 155 organisms).
Calcein was lightly toxic in our study (4% mortality) at 0.4g/L, and not toxic at all at 0.125g/L in the injection experiment. We did incur 15% mortality at 0.7g/L.
Fujikura et al. (2003) observed 33% (one out of three individuals) bivalve mortality after 24h exposure to calcein at 0.3g/L concentration, however, no mortality at 0.4 nor 0.7g/L. This greater mortality may be a result of the small sample size, of greater sensitivity of that species or the slightly longer exposure time to calcein. Linard et al. (2011) reported no mortality for P. margaritifera at 0.15g/L. Other studies revealed that lower than 0.40g/L calcein concentration were not lethal for Nucella ostrina (Moran, 2000) and Mesodesma donacium (Riascos et al., 2007). Herrmann (2009) found exposure time (3h vs 6h) to calcein to produce slightly more mortality for D. hanleyanus than the actual calcein concentration used (from 4 to 6% mortality), and thus recommended calcein staining as a non-lethal method. Mahé et al. (2010) reported no mortality at 0.05 or 0.15g/L calcein concentration for (Cerastoderma edule). They observed clear marks at all concentrations and exposure times (submersion).
Regarding age-dependency and calcein marking, as a general observation, smaller oys- ters (<30mm shell height) in our study tended to have more perfect marks at the lower calcein concentration. In addition, staining efficiency was found better for younger individuals possi- bly because of growth by accretion (Thébault et al., 2006, Riascos et al., 2007). Calcein marking may not be the most effective method used for larger oyster, especially after sexual maturity at 45mm shell height, because it is most likely that energy will be invested in reproduction at the expense of shell growth (Solano, Cabrera, Palacios, & Cruz, 1997, Thébault et al., 2006).
The calcein injection method was unsuccessful, but was a successful method for other bivalves for which reasons are unknown (Kaehler & McQuaid, 1999; Tada et al., 2010; Linard et al., 2011). These authors believed this may have been a result of the use of a low concentration of calcein. Some authors mentioned calcein mark degradation over time as a reason why no marks were detected. We discarded this theory because Herrmann (2009) determined clear long-lasting calcein marks, produced with short immersion times at low concentrations (0.05 and 0.1g/L during 3 to 6h immersions) in D. hanleyanus, two years after staining. Also Riascos et al. (2007) found long-lasting calcein stains for C. concholepas and M. donacium.
Regarding calcein marking and micro growth-band periodicity, we observed calcein validation marks without aid of blue light from fluorescence microscopy. These marks were narrow dark brown lines. The continuous brown mark was detected at the exact place where calcein stained the shell growing-edge. This brown line may have been produced by the relatively greater calcein concentrations of our study compared to most. Our greater calcein concentrations (submersion) may have caused a significant accumulation of calcein in the growing-edge. Also our submerged oysters were unfed and remained under dark conditions, which may have provoked strong ingestion. We used greater calcein concentrations to assure calcein binding with shell CaCO3, because of our poor results during the injection experiment. This dark, brown calcein band has not been reported elsewhere.
Sub-littoral species are influenced by circadian rhythms, which regulate activities by external cues, like daylight exposure. Morton (1973, 1983) studied, adductor muscle movement and quiescence bounded to filtering activities during rhythmic periods. During quiescence, oxygen consumption and filtration rate was negligible, and carbon dioxide enrichment occurred. Oxygen consumption was greater during nighttime for fresh water clams Ligumia subrostrata (McCorkle, Shirley, & Dietz, 1979).
Shell deposition was shown to take place during night periods in marine environments (House & Farrow, 1968). This process could be related to night feeding behaviors found in some bivalves (McCorkle et al., 1979). Food availability and temperature changes were shown to affect growth and reproduction rate in bivalves (Delaporte et al., 2006; Pouvreau, Bourles, Lefebvre, Gangnery, & Alunno-Bruscia, 2006; Le Moullac et al., 2013) for which poor concentration of food, high density of individuals and no light, could have changed oyster behavior, and this could have caused in increment in adductor activity given the conditions.
For other species of mollusks feeding and digestion is constant and simultaneous if food availability is also constant (Owen, 1974). Other bivalves present a double-phase feeding activity in a 24h period with intermediate digestion periods. In other studies these rates depend on food availability (Robinson & Langton, 1980). Micro growth-bands are deposited dependent on day-night cycles (Pannella & MacClintock, 1968; Rhoads & Pannella, 1970; Farrow, 1972; Whyte, 1975). Our results support evidence of filtering activities during dark conditions (during submersion in dark contain- ers), allowing the formation of a calcein mark and the reason why different types of calcein marks where found during shell analysis.
Growth was faster at lower calcein concentration but not significantly and this may be caused by a reaction to the more toxic conditions at the greater calcein concentration during the submersion period. In addition, Dick, Philipp, Kriews, & Abele (2007) detected a faster growing and respiratory rate in younger individuals than older ones of other bivalves, with higher accumulation of heavy metals in their shells during polymerization. This shows a less discrimination between wanted and unwanted material in younger individuals. At greater concentrations of calcein, individual growth rates were similar within individuals; calcein exposure could have affected aragonite deposition, producing thinner growth bands.
The major problem for ageing is the specific distinction of micro growth-bands on unstained thin sections (MacDonald & Thomas, 1980). The use of Coomassie Blue was crucial for growth-band counts for this species; it facilitated clear band boundaries and helped discriminate from blurred areas in the shell of the thin section. Checa, Rodríguez-Navarro, & Esteban-Delgado (2005) found that shell protein membranes could originate in the absences of the mineral infilling, observing empty cavities during the organic phase before polymerization. We found that in presence of Coomassie Blue the organic matrix persists and is stained while the mineral CaCO3 part of the band starts to degrade or dissolve because of the presence of acetic acid in the solution. Exposure time of thin sections with Coomassie Blue should be less than 15min to prevent excessive shell consumption. However, the partial dissolution of the CaCO3 layer presents an uneven relief on the surface of the thin section and aids in counting the micro growth-bands.
Additionally, some shells became too fragile after bleaching and lost their organic external layer during slicing. Also no slices could be cut at <20µm thickness. The best shell locations for counting internal micro growth-bands were in the middle and umbo areas.
Concerning management implications, now that age of each micro growth-band is validated as pertaining to one 24-hr period, oyster spat collected at different dates, depths and regions can now be aged by preparing thin sections, staining with Coomassie Blue and counting all micro-growth bands to determine age in days. This will allow back-aging to determine approximate dates of colonization of spat collectors. This will aid in the determination of temporal and spatial peaks of colonization in La Paz Bay. In addition, natural oyster banks could be identified. It is important to determine the regressional relationship of number of growth-bands (age) vs shell height or other shell dimensions that would allow for a more economical and less time-consuming method for age estimation of juvenile pearl oysters.
In conclusion, calcein is recommended as a non-lethal marking method for age validation for P. mazatlanica for the following reasons: 1) is a simple method that enables the analysis of large samples; 2) it produced a bright fluorescent mark at low and high concentrations of calcein and a distinct brown mark without fluorescence at higher concentrations and longer immersion periods (approximate 20h); 3) long lasting clear mark at higher concentrations; 4) low mortality rate at excessive calcein concentrations, for which concentrations lower than 0.4g/L are sufficient for staining. Coomassie Blue is recommended as a dye for organic shell layers, facilitating micro growth-band counts. For P. mazatlanica each internal micro growth-band is validated for a 24h growth formation.
Acknowledgments
This study was possible thanks to the Center for Biological Investigations of the North- west (Centro de Investigaciones Biológicas del Noroeste, CIBNOR) for providing laboratory facilities and equipment. We specially thank J. Cortes from the commercial pearl farm Perlas del Cortez (Ref. No. CG07-245-PCO). We also thank M. B. McCoy for his editorial services and insight, as well as C. Rivera. The National Council of Science and Technology of Mexico (Conacyt) also provided essential scholarship and research funding.
References
Ainsworth, C. H., Morzaria-Luna, H., Kaplan, I. C., Levin, P. S., Fulton, E. A., Cudney-Bueno, R., Pfister, T. (2012). Effective ecosystem-based management must encourage regulatory compliance: A Gulf of California case study. Marine Policy, 36(6), 1275-1283. [ Links ]
Blank, S., Arnoldi, M., Khoshnavaz, S., Treccani, L., Kuntz, M., Mann, K,.Fritz, M. (2003). The nacre protein perlucin nucleates growth of calcium carbonate crystals. Journal of Microscopy, 212(3), 280-291. [ Links ]
Cáceres-Puig, J. I., Huato-Soberanis, L., Melo-Barrera, F. N., & Saucedo, P. E. (2011). Use of calcein to estimate and validate age in juveniles of the winged pearl oyster Pteria sterna. Aquatic Living Resources, 24(3), 329-335. [ Links ]
Campana, S. E. (2001). Accuracy, precision and quality control in age determination, including a review of the use and abuse of age validation methods. Journal of Fish Biology, 59, 197-242. [ Links ]
Castro-Aguirre, J. L., Balart, E. F., & Arvizu-Martínez, J. (1995). Contribución al conocimiento del origen y distribución de la ictiofauna del Golfo de California, México. Hidrobiológica, 5(001-002), 57-78. [ Links ]
Cerrato, R. M. (2000). What fish biologists should know about bivalve shells. Fisheries Research, 46(1), 39-49. [ Links ]
Checa, A. G., Rodríguez-Navarro, A. B., & Esteban-Delgado, F. J. (2005). The nature and formation of calcitic columnar prismatic shell layers in pteriomorphian bivalves. Biomaterials, 26(32), 6404-14. [ Links ]
Cudney-Bueno, R. L., Bourillón, L., Sáenz-Arroyo, A., Torre-Cosío, J., Turk-Boyer, P., & Shaw, W. W. (2008). Governance and effects of marine reserves in the Gulf of California, Mexico. Ocean and Coastal Management, 52, 207-218. [ Links ]
Dauphin, Y. (2003). Soluble organic matrices of the calcitic prismatic shell layers of two pteriomorphid bivalves, Pinna nobilis and Pinctada margaritifera. The Journal of Biological Chemistry, 278(17), 15168-15177. [ Links ]
Day, R. W., Williams, M. C., & Hawkes, G. P. (1995). A comparison of fluorochromes for marking abalone shells. Marine and Freshwater Research, 46, 599-605. [ Links ]
Delaporte, M., Soudant, P., Lambert, C., Moal, J., Pou vreau, S., & Samain, J. F. (2006). Impact of food availability on energy storage and defense related hemocyte parameters of the Pacific oyster Crassostrea gigas during an experimental reproductive cycle. Aquaculture, 254, 571-582. [ Links ]
Dick, D., Philipp, E., Kriews, M., & Abele, D. (2007). Is the umbo matrix of bivalve shells (Laternula elliptica) a climate archive? Aquatic Toxicology, 84(4), 450-456. [ Links ]
Erisman, B. E., Paredes, G. A., Plomozo-Lugo, T., Cota-Nieto, J. J., Hastings, P. A., & Aburto-Oropeza, O. (2011). Spatial structure of commercial marine fisheries in northwest Mexico. ICES Journal of Marine Science, 68(3), 564-571. [ Links ]
Farrow, G. E. (1972). Periodicity structures in the bivalve shell: Analysis of stunting in Cerastoderma edule from the Burry Inlet (South Wales). Palaeontology, 15, 61-72. [ Links ]
Fujikura, K., Okoshi, K., & Naganuma, T. (2003). Strontium as a marker for estimation of microscopic growth rates in a bivalve. Marine Ecology Progress Series, 257, 295-301. [ Links ]
Heilmayer, O., Honnen, C., Jacob, U., Chiantore, M., Cattaneovietti, R., & Brey, T. (2005). Temperature effects on summer growth rates in the Antarctic scallop, Adamussium colbecki. Polar Biology, 28(7), 523-527. [ Links ]
Herrmann, M., Mauro, L., Lepore, B., Laudien, J., Arntz, W. E., & Penchaszadeh, P. E. (2009). Growth estimations of the Argentinean wedge clam, Donax hanleyanus: A comparison between length-frequency distribution and size-increment analysis. Journal of Experimental Marine Biology and Ecology, 379, 8-15. [ Links ]
Hidu, H. & Hanks, J. E. (1968). vital staining of bivalve mollusk shells with alizarin sodium monosulfonate. Proceedings of the National Shellfish Association, 58, 37-41. [ Links ]
House, M. R. & Farrow, G. E. (1968). Daily growth banding in the shell of the cockle, Cardium edule. Nature, 219, 1384-1386. [ Links ]
IG-UNAM (Instituto de Geografía de la Universidad Nacional Autónoma de México). (1992). Atlas Nacional de México. Ciudad de México, D.F., México: Sistema de Información, S. A. [ Links ]
Jing, G., Li, Y., xie, L., & Zhang, R. (2006). Metal accumulation and enzyme activities in gills and digestive gland of pearl oyster (Pinctada fucata) exposed to copper. Comparative Biochemistry and Physiology. Toxicology & Pharmacology: CBP, 144(2), 184-190. [ Links ]
Jones, D. S., Thompson, I., & Ambrose, W. (1978). Age and growth rate determinations for the Atlantic surf clam, Spisula solidissima (Bivalvia: Mactracea), based on internal growth lines in shell cross-sections. Marine Biology, 47, 63-70. [ Links ]
Kaehler, S. & McQuaid, C. D. (1999). Use of the fluoro-chrome calcein as an in situ growth marker in the brown mussel, Perna perna. Marine Biology, 133, 455-460. [ Links ]
Kennish, M. J., Lutz, R. A., & Rhoads, D. C. (1980). Preparation of acetate peels and fractured sections for observation of growth patterns within the bivalve shell. In D. C. Rhoads & R. A. Lutz (Eds.), Skeletal growth of aquatic organisms (pp. 597-601). New York, NY, USA: Plenum. [ Links ]
Lartaud, F., Chauvaud, L., Richard, J., Toulot, A., Bollinger, C., Testut, L., & Paulet, Y. M. (2010). Experimental growth pattern calibration of Antarctic scallop shells (Adamussium colbecki, Smith 1902) to provide a biogenic archive of high-resolution records of envi ronmental and climatic changes. Journal of Experimental Marine Biology and Ecology, 393, 158-167. [ Links ]
Le Moullac, G., Soyez, C., Sham-Koua, M., Levy, P., Moriceau, J., vonau, v., Maihota, M., & Cochard, J. C. (2013). Feeding the pearl oyster, Pinctada margaritifera, during reproductive conditioning. Aquaculture Research, 44(3), 404-411. [ Links ]
Leslie, H. M. & McLeod, K. L. (2007). Confronting the challenges of implementing marine ecosystem-based management. Frontiers in Ecology and the Environment, 5, 540-548. [ Links ]
Leslie, H. M., Schluter, M., Cudney-Bueno, R., & Levin, S. A. (2009). Modeling responses of social-ecological systems of the Gulf of California to anthropogenic and natural perturbations. Ecological Research, 24, 505-519. [ Links ]
Linard, C., Gueguen, Y., Moriceau, J., Soyez, C., Hui, B., Raoux, A., Le Moullac, G. (2011). Calcein staining of calcified structures in pearl oyster Pinctada margari- tifera and the effect of food resource level on shell growth. Aquaculture, 313, 149-155. [ Links ]
Lutz, R. A. & Rhoads, D. C. (1980). Growth patterns within the molluscan shell: An overview. In D. C. Rhoads & R. A. Lutz (Eds.), Skeletal growth of aquatic organisms (pp. 203-248). New York, NY, USA: Plenum. [ Links ]
MacDonald, B. A. & Thomas, M. L. H. (1980). Age determination of the soft-shell clam Mya arenaria using shell internal growth lines. Marine Biology, 58(2), 105-109. [ Links ]
Mahé, K., Bellamy, E., Lartaud, F., & de Rafelis, M. (2010). Calcein and manganese experiments for mar- king the shell of the common cockle (Cerastoderma edule): Tidal rhythm validation of increments formation. Aquatic Living Resources, 23, 239-245. [ Links ]
McCorkle, S., Shirley, T. C., & Dietz, T. H. (1979). Rhythms of activity and oxygen consumption in the common pond clam, Ligumia subrostrata (Say). Canadian Journal of Zoology, 57(10), 1960-1964. [ Links ]
Mohler, J. W. (1997). Immersion of larval Atlantic salmon in calcein solutions to induce a non-lethally detectable mark. North American Journal of Fisheries Management, 17, 751-756. [ Links ]
Monaghan, J. P., Jr. (1993). Comparison of calcein and tetracycline as chemical markers in summer flounder. Transactions of the American Fisheries Society, 122, 298-301. [ Links ]
Monteforte, M., Kappelman-Piña, E., & López-Espinosa, B. (1995). Spatfall of pearl oyster, Pteria sterna (Gould) on experimental collectors at Bahia de La Paz, South Baja California, México. Aquaculture Research, 26(7), 497-511. [ Links ]
Moran, A. L. (2000). Calcein as a marker in experimental studies of newly-hatched gastropods. Marine Biology, 137, 893-898. [ Links ]
Morton, B. (1973). Some aspects of the biology, population dynamics and functional morphology of Musculista senhausia Benson (Bivalvia: Mytilacea). Pacific Science, 28, 19-33. [ Links ]
Morton, B. (1983). Feeding and digestion in Bivalvia. In A. S. M. Saleuddin & K. M. Wilbur (Eds.), The Mollusca, vol. 5, No. Part 2 (pp. 65-147). New York, NY, USA: Academic. [ Links ]
Nakahara, H. (1961). Determination of growth rates of nacreous layer by the administration of tetracycline. Bulletin of the National Pearl Research Laboratory, 6, 607-614. [ Links ]
Nudelman, F., Gotliv, B. A., Addadi, L., & Weiner, S. (2006). Mollusk shell formation: Mapping the distribution of organic matrix components underlying a single aragonitic tablet in nacre. Journal of Structural Biology, 153, 176-187. [ Links ]
Obeso-Nieblas, M., Shirasago-Germán, B., Gaviño-Rodrí- guez, J., Perez-Lezama, E., Obeso-Huerta, H., & Jiménez-Illescas, A. (2008). variabilidad hidrográfica en Bahía de La Paz, Golfo de California, México (1995-2005). Revista de Biología Marina y Oceanografía, 43(3), 559-567. [ Links ]
Owen, G. (1974). Feeding and digestion in the bivalvia. Advances in Comparative Physiology and Biochemistry, 5, 1-35. [ Links ]
Pannella, G. & MacClintock, C. (1968). Biological and environmental rhythms reflected in molluscan shell growth. Journal of Paleontology, 42, 64-80. [ Links ]
Peck, L. S., Baker, A. C., & Conway, L. Z. (1996). Strontium labelling of the shell of the Antarctic limpet Nacella concinna (Strebe 1908). Journal of Molluscan Studies, 62, 315-325. [ Links ]
Pouvreau, S., Bourles, Y., Lefebvre, S., Gangnery, A., & Alunno-Bruscia, M. (2006). Application of a dynamic energy budget model to the Pacific oyster, Crassostrea gigas, reared under various environmental conditions. Journal of Sea Research, 56, 156-167. [ Links ]
Pricker, J. G. & Schiel, D. R. (1993). Tetracycline as a fluorescent shell-marker in the abalone, Haliotis iris. Marine Biology, 116, 81-86. [ Links ]
Rhoads, D. C. & Pannella, G. (1970). The use of molluscan shell growth patterns in ecology and paleoecology. Lethaia, 3, 143-161. [ Links ]
Riascos, J. M., Guzman, N., Laudien, J., Heilmayer, O., & Oliva, M. (2007). Suitability of three stains to mark shells of Concholepas concholepas (Gastropoda) and Mesodesma donacium (Bivalvia). Journal of Shellfish Research, 26, 43-49. [ Links ]
Riascos, J. M., Heilmayer, O., Oliva, M. E., Laudien, J., & Arntz, W. E. (2008). Infestation of the surf clam Mesodesma donacium by the spionid polychaete Polydora bioccipitalis. Journal of Sea Research, 59, 217-227. [ Links ]
Robinson, W. E. & Langton, R. W. (1980). Digestion in a subtidal population of Mercenaria mercenaria (Bivalvia). Marine Biology, 58(3), 173-179. [ Links ]
Rowley, R. J. & Mackinnon, D. I. (1995). Use of the fluorescent marker calcein in biomineralisation studies of brachiopods and other marine organisms. Bulletin of the Institute of Oceanography (Monaco) Special Issue, 14(2), 111-120. [ Links ]
Sokal, R., & Rohlf, F. J. (1995). Biometry: The principles and practice of statistics in biological research. New York, NY, USA: W. H. Freeman. [ Links ]
Solano, Y., Cabrera, J., Palacios, J. A., & Cruz, R. A. (1997). Madurez sexual, índice de condición y rendimiento de Pinctada mazatlanica (Pterioida: Pteriidae), Golfo de Nicoya, Costa Rica. Revista de Biología Tropical, 45(3), 1049-1054. [ Links ]
Tada, Y., Fujikura, K., Oguri, K., Kitazato, H., & Tanabe, K. (2010). In situ fluorochrome calcein marking of deep-sea mollusks using a new growth chamber. Aquatic Ecology, 44(1), 217-222. [ Links ]
Taylor, J. (1973). The structural evolution of the bivalve shell. Palaeontology, 16(3), 519-534. [ Links ]
Thébault, J., Chauvaud, L., Clavier, J., Fichez, R., & Morize, E. (2006). Evidence of a 2-day periodicity of striae formation in the tropical scallop, Comptopallium radula, using calcein marking. Marine Biology, 149, 257-267. [ Links ]
Tynan, S., Eggins, S., Kinsley, L., Welch, S. A., & Kirste, D. (2005). Mussel shells as environmental tracers: An example from the Loveday Basin. In I. C. Roach (Ed.), Regolith 2005 – Ten Years of CRC LEME (pp. 314-317). Canberra, ACT: Australian National University, Cooperative Research Centre for Lands- cape Environments and Mineral Exploration (CRC LEME). [ Links ]
van der Geest, M., van Gils, J. A., van der Meer, J., Olff, H., & Piersma, T. (2011). Suitability of calcein as an in situ growth marker in burrowing bivalves. Journal of Experimental Marine Biology and Ecology, 399, 1-7. [ Links ]
Whyte, M. A. (1975). Time, tide and the cockle. In G. D. Rosenberg & S. K. Runcorn (Eds.), Growth rhythms and the history of the earth’s rotation (pp. 177-189). London, UK: John Wiley & Sons. [ Links ]
Wilson, C. A., Beckman, D. W., & Dean, J. M. (1987). Calcein as a fluorescent marker of otoliths of larval and juvenile fish. Transactions of the American Fisheries Society, 116, 668-670. [ Links ]
Wilson, J. A. (2006). Matching social and ecological systems in complex ocean fisheries. Ecology and Society, 11, 9-30. [ Links ]
1. Escuela de Ciencias Biológicas, Universidad Nacional (UNA), Campus Omar Dengo Avenida 1 Calle 9, Apartado Postal: 86-3000, Heredia, Costa Rica; pleemccoy@gmail.com
2. Centro de Investigaciones Biológicas del Noroeste (CIBNOR), Mar Bermejo 195, Col. Playa Palo de Santa Rita, La Paz, B.C.S. 23096, México; lhuato@cibnor.mx
Received 02-xII-2013. Corrected 20-III-2014. Accepted 19-Iv-2014.

