


Services on Demand
Journal
Article
 English (pdf)
 Article in xml format
 Article references
 Send this article by e-mail
Indicators
-
 Cited by SciELO
 -
 Access statistics
Related links
-
 Similars in
SciELO
Similars in
SciELO  uBio
uBio
Share

 Permalink
Revista de Biología Tropical
On-line version ISSN 0034-7744Print version ISSN 0034-7744
Rev. biol. trop vol.61 n.4 San José Oct./Dec. 2013
Assessment of genetic diversity in Brassica juncea (Brassicaceae) genotypes using phenotypic differences and SSR markers
Evaluación de la diversidad genética en genotipos de Brassica juncea (Brassicaceae) utilizando diferencias fenótipicas y marcadores SSR
Evaluación de la diversidad genética en genotipos de Brassica juncea (Brassicaceae) utilizando diferencias fenótipicas y marcadores SSR
Vinu V.1*, Naveen Singh1, Sujata Vasudev1, Devendra Kumar Yadava1, Sushil Kumar2*, Sugandh Naresh1, Sripad Ramachandra Bhat2 & Kumble Vinod Prabhu1
*Dirección de correspondencia:
Abstract
Brassica mustard species represent one of the most important oilseed crops in India, nevertheless, their genetic diversity is barely known. A better understanding on this topic is essential for the proper utilization of genotypes in breeding programmes. We evaluated the genetic diversity among 44 Indian mustard (Brassica juncea) genotypes including varieties/purelines from different agro-climatic zones of India and few exotic genotypes (Australia, Poland and China). For this, we used A and B genome specific SSR markers and phenotypic data on 12 yield and yield contributing traits. Out of the 143 primers tested, 134 reported polymorphism and a total of 355 alleles were amplified. Dendrograms based on Jaccard’s similarity coefficients and Manhattan dissimilarity coefficients were generated based on an average linkage algorithm (UPGMA) using marker data and phenotypic data. Genotypes were grouped into four clusters based on genetic distances. Both the clustering patterns based on Jaccard’s similarity and Manhattan dissimilarity coefficients, independently, discriminated the genotypes effectively as per their pedigree and origin. PCoA revealed that, the grouping of genotypes based on SSR marker data is more convincing than phenotypic data, however, the correlation between phenotypic and genetic distance matrices was observed to be very low (r=0.11). Hence, for diversity studies reliability on molecular markers is worth proving and SSR markers are the stronger tools than quantitative traits in discriminating B. juncea genotypes.
Key words: Brassica juncea, genetic diversity, quantitative traits, SSR markers.
Resumen
Las especies de mostaza del género Brassica representan uno de los cultivos de semillas oleaginosas más importantes en India, sin embargo, su diversidad genética es poco conocida. Para la utilización de genotipos en programas de cultivos resulta esencial un mayor conocimiento sobre este tema. Debido a ello, se evaluó la diversidad genética entre 44 genotipos de mostaza de la India (Brassica juncea) incluyendo variedades y líneas puras de diferentes zonas agro-climáticas de la India y algunos genotipos exóticos (Australia, Polonia y China). Para ello, se utilizaron marcadores SSR específicos del genoma A y B y datos fenotípicos del rendimiento de 12 cosechas y sus características. De los 143 ‘primers’ evaluados, 134 reportaron polimorfismo y un total de 355 alelos fueron amplificados. Se generaron dendrogramas a partir de los coeficientes de similitud de Jaccard y de disimilitud Manhattan, basados en un algoritmo de vinculación promedio (UPGMA). Se utilizaron datos de marcadores genéticos y datos fenotípicos. Los genotipos se agruparon en cuatro grupos basados en las distancias genéticas. Ambos patrones de agrupamiento, tanto los basados en los coeficientes de similitud de Jaccard como los basados en los de disimilitud Manhattan, separaron independientemente los genotipos por su genealogía y origen, de una manera efectiva. El PCoA reveló que la agrupación de genotipos basada en datos de marcadores SSR, es más convincente que los datos fenotípicos, sin embargo, se observó que la correlación entre las matrices de distancia fenotípica y genética resultó muy baja (r=0.11). Por lo tanto, para estudios de diversidad basados en marcadores moleculares es necesario realizar más pruebas. Los marcadores SSR constituyen herramientas más eficientes para discriminar entre genotipos de B. juncea, que las características cuantitativas.
Palabras clave: Brassica juncea, diversidad genética, características cuantitativas, marcadores SSR.
Brassica species, commonly called as rapeseed-mustard, are the third most important oilseed crops of the world after soybean and palm. China, India, Canada, Japan and Germany are the major rapeseed-mustard growing countries. These are the second most important oilseed crops of India, next to soybean. India is one of the largest rapeseed-mustard growing country occupying first position with 20.23% area and second position with 11.7% share to the global production (USDA, 2012). Four oleiferous Brassica species viz. Brassica juncea, B. napus, B. rapa and B. carinata are cultivated in about 6.39 million hectares area and produce 7.41 million tons in India (Kumar, Kumar & Kandpal, 2012). B. juncea (2n=36, AABB genome), an allopolyploid commonly called as Indian mustard, contributes more than 80% to the total rapeseed-mustard production in the country and is an important component in the oilseed sector. It is known to be more drought tolerant and shattering resistant than B. napus and B. rapa, therefore, has an enormous cultivation potential in semi-arid areas. With the increasing population and improving life standards, per capita oil consumption has increased tremendously. To meet out the present oil requirements, there is an urgent need to increase the yield potential of B. juncea through genetic interventions.
The maximum utilization of any species for breeding and its adaptation to different environments depend on the level of genetic diversity it holds. Genetic distance among parents may be attributed to their differences for number of genes and their functional relations in a given environment (Nei, 1976). Evaluation of genetic divergence and relatedness among breeding materials has significant implications for the improvement of crop plants. Knowledge on genetic diversity in B. juncea could help breeders and geneticists to understand the structure of germplasm, predict which combinations would produce the best offsprings (Hu et al., 2007), and facilitate to widen the genetic basis of breeding material for selection (Qi, Yang & Zhang, 2008).
Genetic diversity among individuals or populations can be determined using morphological, biochemical and molecular approaches (Mohammadi & Prasanna, 2003). Assessment of genetic diversity in B. juncea using phenotypic characters has previously been done by many researchers (Gupta, Sekhon & Satija, 1991; Vaishnava, Sachan & Tewari, 2006; Alie, Singh, Tariq & Sharma, 2009; Singh, Arya, Chandra, Niwas & Salisbury, 2010). Isozyme loci have been used as markers in a number of genetic studies including genetic diversity in B. juncea (Kumar & Gupta, 1985; Arunachalam, Prabhu & Sujata, 1996). However, these parameters are influenced by environmental factors and the developmental stage of the plant. In B. juncea various marker systems have been used for assessing the genetic diversity. There is increasing number of reports where molecular markers like Restriction Fragment Length Polymorphism, (RFLP; Song, Osborn & Williams, 1988; Diers & Osborn, 1994; Hallden, Nilsson, Rading & Sall, 1994; Das Santos, Nienhuis, Skroch, Tivang & Slocum, 1994), Random Amplified Polymorphic DNAs, (RAPDs; Ghosh, Haque, Parvin, Akhter & Rahim, 2009; Yildirim, Yildirim, Ercisli, Agar & Karlidag, 2010; Khan et al., 2011), Amplified Fragment Length Polymorphism, (AFLP; Sun, Zhao, Song & Chen, 2001; Guo, Zhou, Ma & Cao, 2002; Zhao et al., 2005) and microsatellites or Simple Sequence Repeats (SSRs; Abbas, Farhatullah, Marwat, Khan & Munir, 2009; Wang et al., 2009; Redden, Vardy, Edwards, Raman & Batley, 2009) have been used to study genome organization, varietal differences and diversity analysis in Brassicas. SSRs are co-dominant, highly polymorphic PCR-based markers and are expected to be very powerful in cultivar discrimination. The fairly saturated linkage map for this class of marker is available in public domains (Panjabi et al., 2008).
Among various markers available for genetic analysis in plants, molecular markers are more efficient, precise and reliable in discriminating closely related species and cultivars (Mishra et al., 2011), even then, many breeding groups emphasize in morphological traits than molecular markers (Hu et al., 2007). Therefore, the present study was undertaken to estimate the genetic diversity of 44 B. juncea genotypes of diverse geographic origin and explore potential to evaluate the relationship of these genotypes based on quantitative trait data and microsatellite markers. It would be interesting to see relative efficiency of these two approaches in discriminating genotypes of B. juncea. Genetic distances will further help in identifying genetically diverse genotypes, which then can be utilized in creating valuable selectable variation.
Materials and Methods
Plant material: Forty four B. juncea genotypes, including varieties/purelines from different agro-climatic zones of India and four genotypes of exotic origin (Australia, Poland and China) were taken for this study (Appendix 1).
Phenotypic evaluation: The present study was carried out at the Division of Genetics, Indian Agricultural Research Institute, New Delhi under normal field condition during winter 2010-11. Geographically, the experimental farm of IARI, New Delhi is situated at the altitude of 228.61m above mean sea level (28°38’23” N - 77°09’27” E). The area has a semi-arid, sub-tropical climate having mean precipitation of about 700mm most of which is received in rainy season spreading from July to September. Alluvial soils (Typic Ustochrept) which are slightly alkaline (8.25pH) with clay loam texture and low organic matter was supplemented with 60kg of nitrogen (in two splits), 40kg of phosphorus, 20kg of potash and 40kg of sulphur per hectare to raise a healthy crop. In the pre-irrigated well cultivated field with pulverised soil, sowing was done with the help of hand plough and the depth of sowing was kept at 1.5-2cm. All the 44 genotypes were grown in the field in randomized block design with three replications. Each genotype was planted in a four-row plot of three meter length with a spacing of 30x10cm (Row x Plant). The crop was given three irrigations, first at vegetative stage, second at flower initiation, and third at seed development. The observations were recorded on 12 morphological traits viz., plant height (cm), days to maturity, point to first branch (cm), number of siliquae on main shoot, number of primary branches, number of secondary branches, main shoot length (cm), point to first siliqua (cm), siliqua length (cm), number of seeds per siliqua, seed yield per plant (g) and 1 000 seed weight (g) using standard methods. The data were recorded on five random but competitive plants except for days to maturity, where it was taken on plot basis.
Molecular marker evaluation: DNA from 44 genotypes was isolated from young leaves using CTAB (Cetyl Trimethyl Ammonium Bromide) method as described by Murray & Thompson (1980), later modified by Doyle & Doyle (1990). After purification, DNA was quantified by analysing on 0.8% agarose gel with Hind III-cut λ DNA as standard. The concentration of DNA in individual sample was determined based on the intensity of the bands in the λ DNA ladder. Finally it was diluted to 20ng/µL for PCR analysis. Microsatellite markers (SSR), 143 in number, spanning A and B genome were used to study DNA polymorphism (Appendix 2). These primers are known to express polymorphism among B. juncea genotypes. The amplification reaction was carried out in 10µL reaction volume containing 10X Taq buffer, 1mM MgCl2, 10mM dNTPs, 200pmole primers, one unit Taq DNA polymerase and 20ng template DNA. PCR amplification was programmed for 35 cycles after an initial denaturation cycle for five minutes at 94°C. Each cycle consisted of a denaturation step at 94°C for one minute, an annealing step at 58°C for one minute, and an extension step at 72°C for two minutes, following by extension cycle for seven minutes at 72°C in the final cycle. The amplified fragments were resolved on 2% agarose gel. Bands were scored as zero for absence and one for presence in each genotype.
Genetic distances based on phenotypic data: The phenotypic data recorded on 12 yield and yield related traits were subjected to analysis of variance (ANOVA). Using same phenotypic data, Manhattan dissimilarity coefficients (MD; Sokal & Michener, 1958) were calculated by pair-wise comparisons of varieties by using NTSYS-pc 2.02 programme (Rohlf, 1998). Based on an average linkage algorithm (UPGMA, unweighted pair group method with an arithmetic average), clustering of genotypes was done. To depict the similarity or dissimilarity among groups or individual genotypes Principal Coordinate Analysis (PCoA; Gower, 1966) was done using DARwin 6.0 programme.
Genetic distances based on SSR analysis: Utilizing binary data generated by SSR primers Jaccard’s similarity coefficients (Jaccard, 1908) were calculated between genotypic pairs using NTSYS-pc 2.02 programme (Rohlf, 1998). From the similarity coefficients matrix, thus generated, the dissimilarity coefficients (JD; Genetic distances=1-similarity coefficient) were calculated. The dissimilarity coefficient matrices were again subjected to PCoA to explore and establish similarity or dissimilarity among groups or individual genotypes.
Correlation between phenotypic and molecular genetic distance matrices: Simple correlation was calculated between the Jaccard’s and Manhattan genetic distances matrices.
Results
Phenotypic analysis: In the field evaluation trial during winter 2010-11, a total of 44 genotypes were evaluated in RBD. The analysis of variance for 12 yield and yield contributing traits revealed that, the genotypes taken for this investigation had significant genetic variation (Table 1). Plant height, point to first branch, number of secondary branches, point to first siliqua and number of siliquae on main shoot showed wider range for trait values. The most important agronomic trait, seed yield per plant showed a range from 5.90g to 15.59g.
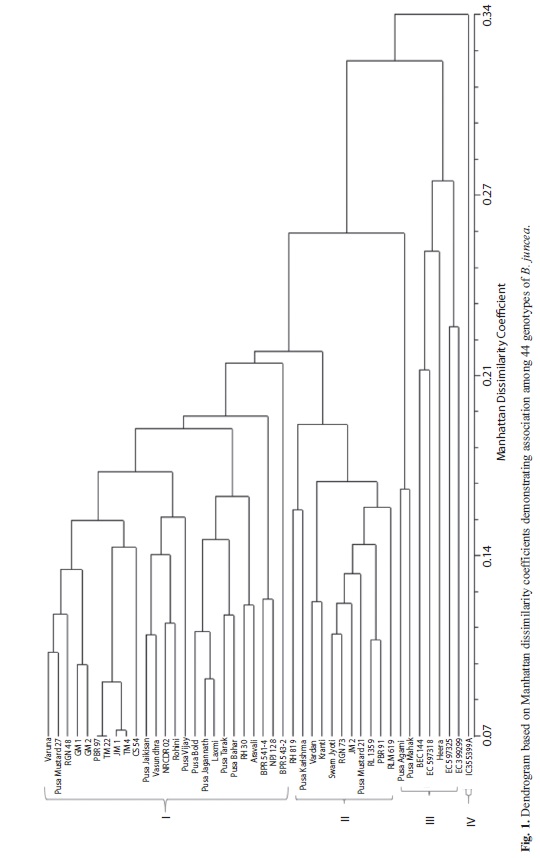
Using the mean values of the 12 quantitative traits, Manhattan dissimilarity coefficients (MD) were calculated by pair-wise comparisons of varieties by using NTSYS-pc 2.02 programme. Manhattan dissimilarity coefficients ranged from 0.07-0.47 with an average of 0.23. The UPGMA based dendrogram scattered the genotypes in four different clusters (Fig. 1). The first cluster comprised of 25 genotypes from seven states of India. Pedigree analysis of these 25 genotypes revealed that Varuna and Pusa Bold, two most popular and widely adapted cultivars, or their derivatives are involved in development of these genotypes. The genotypes of this cluster are characterised by good seed yield, tall plant height and medium maturity ranging from 120 to 145 days.
The second cluster had 11 genotypes developed from HAU Hisar (Haryana), IARI New Delhi, CSAUA&T Kanpur (Uttar Pradesh), ZARS Morena (Madhya Pradesh), RAU Sriganganar (Rajasthan) and PAU Ludhiana (Punjab). These genotypes are good seed yielders, late maturing (>140 days), possessing small seed size and tall to very tall plant stature. Seven genotypes fell in cluster III of which four are having exotic origin, one is a resynthesized B. juncea and another was developed using one of the B. juncea mutant. These genotypes are characterized by small to very small seed size and low to medium seed yields. The fourth cluster included only one genotype viz., IC 355399A which has a peculiar siliqua orientation in bunches that puts it into a separate category.
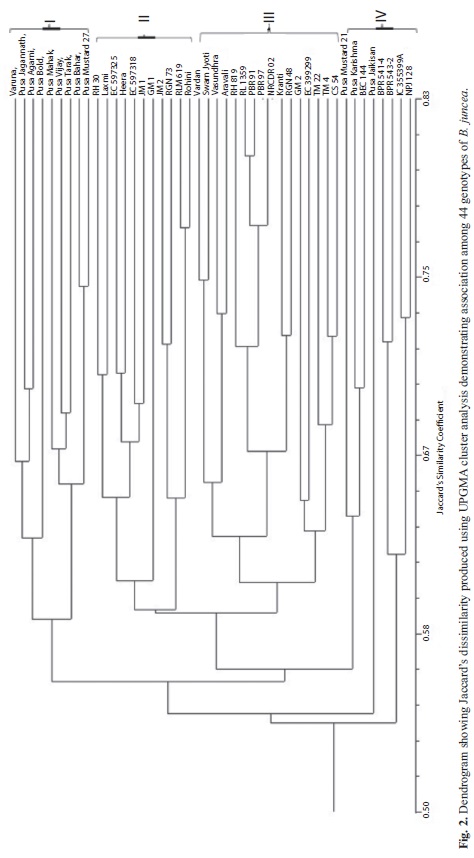
SSR marker analysis: Among the 143 SSR primers used for polymorphism study, a total of 134 SSR were detected polymorphic with 355 amplified alleles. The average number of alleles per primer varied from one to six, while the size of the fragments ranged from 200bp to 400bp. The average percentage of polymorphism for each primer ranged from 4.34 to 37.5 per cent. Jaccard’s similarity coefficients based on SSR data ranged from 0.38 to 0.83 with an average of 0.58.
The UPGMA based dendrogram representing genetic similarity among different accessions grouped the 44 genotypes into four clusters at 40% genetic distance (Fig. 2). First cluster comprised of nine varieties of which eight were developed at IARI, New Delhi. In six of these varieties, except two early maturing varieties Pusa Agrani and Pusa Tarak, Varuna is involved as one of the parents directly or through the ancestry. The ninth one, Varuna, is a very old selection from Varanasi (Uttar Pradesh) during seventies.
The cluster II had 11 genotypes which included two varieties viz., RH30 and Laxmi are from Haryana state and related by ancestry. Three double zero genotypes viz., EC 597325, EC 597318 and Heera falls adjacent to each other in this cluster. Genotypes viz., Rohini, GM 1, RGN 73 and JM 1 have Varuna as their immediate or distant ancestor, whereas, RLM 619 and JM 2 are mutants.
Sixteen genotypes fall in cluster III in which four are from Haryana, three each from Punjab and Rajasthan, two each from U.P. and Maharashtra, one from Gujarat state. The remaining genotype EC 399299 is of exotic origin, having good adaptation to the Indian conditions.
Cluster IV comprised of eight genotypes, which include bunchy type, appressed type, exotic material, somaclone and heat tolerant genotypes. These eight genotypes belong to four breeding programmes. The quality varieties viz., Pusa Karishma and Pusa Mustard 21, developed from IARI, New Delhi fall in cluster IV as these have been bred by using the exotic quality zero erucic acid lines ZEM-1 and ZEM-2. Another IARI bred variety Pusa Jaikisan, a somaclone variant from Varuna developed through tissue culture, also falls in the cluster IV, far away from majority of other IARI bred varieties as expected.
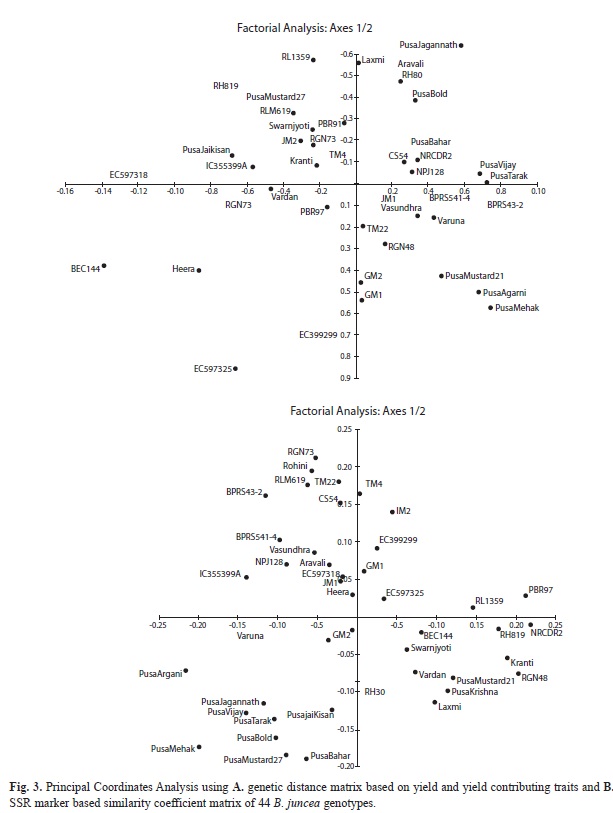
Principal Coordinate Analysis: To visualize the similarity or dissimilarity among groups or individual genotypes Principal Coordinate Analysis (PCoA) was done using DARwin 6.0 programme (Fig. 3). The PCoA analysis further confirmed the positions and grouping of genotypes. PCoA based on genetic distance matrix of phenotypic data (Fig. 3A) showed scattering of ‘Pusa’ varieties in two right hand side quadrants. The single zero cultivars viz., Pusa Mustard 21 and Pusa Karishma were placed in one quarter. In comparison to the grouping done by phenotypic data, the grouping of genotypes based on SSR marker data is observed to be more informative and convincing (Fig. 3B). All the IARI developed ‘Pusa’ varieties were clustered in one quadrant. The varieties viz., Pusa Karishma and Pusa Mustard 21, specifically developed for better oil quality (low erucic acid) were grouped together in other quadrant. Double zero genotypes viz., EC 597318, EC 597325 and Heera though are placed in different quadrants, in this case, but their position is much closer to each other. The PCoA based on molecular data is better in differentiating related genotypes of common origin and parentage.
Correlation between phenotypic and molecular genetic distance matrices: Simple correlation between phenotypic variation, estimated by Manhattan distances using all morphological characters and SSR marker based distance matrices was low (r=0.11) and non significant. Thus, indicating that the two methods were independent in assessing genetic diversity.
Discussion
The assessment of genetic diversity is not only important for crop improvement efforts but also for efficient management and protection of germplasm resources. But these estimates of genetic diversity can be biased by the choice of data (Phenotypic and molecular marker). Therefore, in present study both types of data have been used to measure unbiased diversity estimation.
The material taken for this study exhibit significant genetic variation for all the 12 yield and yield contributing traits. Inclusion of four exotic collections from Poland, Australia and China along with Indian genotypes, developed from different national breeding programmes located in different regions of the country, contributed significantly to this variation. Such significant genetic variation has also been reported by Vaishnava et al. (2006), Alie et al. (2009), Singh et al. (2010) and Yadava, Sapra, Sujata, Dass & Prabhu (2009) on metric traits in B. juncea.
Manhattan dissimilarity coefficients delineated 44 genotypes into four clusters in this study and differentiated these genotypes predominantly based on their maturity, seed yield, seed size and plant height. This method was also used by Sheikh, Banga, Banga and Najeeb (2011) to estimate genetic diversity among 24 stable introgressed progenies of B. carinata developed through interspecific hybridization between B. napus x B. carinata and B. juncea x B. carinata.
The genetic diversity study in B. juncea has been previously carried out using isozyme markers (Kumar & Gupta, 1985), morphological traits (Gupta et al., 1991; Pradhan, Sodhi, Mukhopadhyay & Pental, 1993) and molecular markers (Huangfu, Song & Qiang, 2009). SSRs, being a potential marker system not much used in research and breeding of B. juncea. Limited work considering SSR markers has been reported in B. juncea (Hopkins et al., 2006).
The molecular marker analysis by using 143 SSR markers successfully differentiated 44 B. juncea genotypes into four different groups. Out of the nine genotypes falling in cluster I, six were having Varuna or its derivatives as one of the parent. Similar results were reported by Jain, Bhatia, Banga, Prakash & Lakshmikumaran (1994) and Srivastava, Gupta, Pental & Pradhan (2001). All the three double zero genotypes viz., EC 597325, EC 597318 and Heera falls in cluster II. Mutants and somaclonal variants were delineated into cluster IV. This shows the effectiveness of SSR markers in identifying the close pedigree relationship in breeding material. A similar result regarding effectiveness of SSR markers in monitoring genetic diversity for yield component traits as well as quality traits have also been reported by Plieske & Struss (2001) and Charters, Robertson, Wilkinson & Ramsay (1996), respectively. Similar types of studies using SSR markers have also been done in B. napus (Uzunova & Ecke, 1999; Batley et al., 2003; Hopkins et al., 2006). In addition to microsatellite markers, other marker systems were also used by various researchers for genetic diversity studies in Brassica spp. Malode, Shingnapure, Waghmare & Sutar (2010) analyzed 20 genotypes of Brassica spp. including exotic, Indian and mutants using RAPD primers and grouped the genotypes into four clusters. Similar findings have also been observed in our study with SSR markers. In the present study, a good proportion of polymorphic markers was detected that would be useful in identification of inter-specific hybrids as well as monitoring of genes introgression to desirable genetic backgrounds.
In comparison to PCoA based grouping done by phenotypic data, the grouping of genotypes based on SSR marker data is more informative and convincing. All the IARI developed ‘Pusa’ varieties were clustered in one quadrant. The varieties specifically developed for better oil quality (low erucic acid) were grouped together in other quadrant because one of the parents of these single zero varieties has exotic origin. The genetic information based on molecular data enables the accurate grouping of genotypes sharing common lineage or genotypes developed for specific objectives. Wang et al. (2009) also used PCoA to delineate and visualise 405 individuals and 48 varieties of B. napus into four cluster.
The low correlation between genetic distances calculated from the two approaches could be due to the fact that DNA markers reports genetic variation also in non coding regions which hardly have an effect on phenotype. On the other hand, quantitative traits are influenced by environmental factors and their phenotype is a product of genotype x environment interaction. Plants may be morphologically similar, but this does not necessarily imply genetic similarity, since different genetic bases can result in similar phenotypic expression (Khan, von Witzke-Ehbrecht, Maass & Becker, 2009). A large portion of variation detected by molecular markers is non-adaptive and is, therefore, not subject to either natural or artificial selection as compared with phenotypic characters, which in addition to selection pressure are influenced by the environment (Vieira et al., 2007). It can be concluded that SSR markers, which are free from environmental influences, are the stronger tools than quantitative trait data in discriminating B. juncea genotypes based on pedigree and origin. Information on genetic distances based on microsatellite markers shall be preferred in creating selectable genetic variation using genotypes which are genetically apart.
Acknowledgments
Senior author is thankful to Indian Agricultural Research Institute, New Delhi for providing her financial assistance in the form of fellowship and for giving best of knowledge and resources for conducting this research required for partial fulfilment of M.Sc. in Genetics.
References
Abbas, S. J., Farhatullah, Marwat, K. B., Khan, I. A. & Munir, I. (2009). Molecular analysis of genetic diversity in Brassica species. Pakistan Journal of Botany, 41, 167-176. [ Links ]
Alie, F. A., Singh, T., Tariq & Sharma, P. K. (2009). Genetic diversity analysis in Indian mustard (Brassica juncea (l.) czern & coss). Progressive Agriculture-An International Journal, 9, 50-53. [ Links ]
Arunachalam, V., Prabhu, K. V. & Sujata, V. (1996). Efficiency of isozyme markers in genetic differentiation of Brassica. In 2nd International Rapeseed Congress. New Delhi, India. [ Links ]
Batley, A. J., Vecchies, A. A., Mogg, B. R., Bond, B. J., Cogan, N. A., Hopkins, C. A., Gororo, N. C., Marcroft, C. S., Forster, A. J., Spangenberg, A. G. & Edwards, A. D. (2003). A study of genetic diversity among Brassica napus and Brassica juncea germplasm collections using Simple Sequence Repeat (SSR) Molecular Markers. 13th Australian Research Assembly on Brassicas-Conference Proceedings. [ Links ]
Charters, Y. M., Robertson, A., Wilkinson, M. J. & Ramsay, G. (1996). PCR analysis of oilseed rape cultivars (Brassica napus L. Oleifera) using 5-anchored Simple Sequence Repeat (SSR) primers. Theoretical and Applied Genetics, 92, 442-447. [ Links ]
Das Santos, J. B., Nienhuis, J., Skroch, P., Tivang, J. & Slocum, M. K. (1994). Comparison of RAPD and RFLP genetic markers in determining genetic similarity among Brassica oleracea L. genotype. Theoretical and Applied Genetics, 87, 909-915. [ Links ]
Diers, B. W. & Osborn, T. C. (1994). Genetic diversity of oilseed Brassica napus germplasm based on Restriction Fragment Length Polymorphisms. Theoretical and Applied Genetics, 88, 662-668. [ Links ]
Doyle, J. J. & Doyle, J. L. (1990). Isolation of Plant DNA from fresh tissue. Focus, 12, 13-15. [ Links ]
Ghosh, K. K., Haque, M. E., Parvin, S., Akhter, F. & Rahim, M. M. (2009). Genetic diversity analysis in Brassica varieties through RAPD Markers. Bangladesh Journal of Agriculture Research, 34, 493-503. [ Links ]
Gower, J. C. (1966). Some distance properties of latent root and vector methods used in multivariate analysis. Biometrika, 63, 315-28. [ Links ]
Gupta, V. P., Sekhon, M. S. & Satija, D. R. (1991). Studies on genetic diversity, heterosis and combining ability in Indian mustard Brassica juncea L. (Czern and Coss). Indian Journal of Genetics, 51, 448-453. [ Links ]
Guo, J. X., Zhou, N. Y., Ma, R. & Cao, M. Q. (2002). Genetic diversity in Brassica rapa revealed by AFLP molecular marker. Journal of Agricultural Biotechnology, 10, 138-143. [ Links ]
Hallden, C., Nilsson, N. O., Rading, I. M. & Sall, T. (1994). Evaluation of RFLP and RAPD markers in a comparison of Brassica napus breeding lines. Theoretical and Applied Genetics, 88, 123-128. [ Links ]
Hopkins, C., Mogg, R., Gororo, N., Salisbury, P., Burton, W., Love, C., Spangenberg, G., Edwards, D. & Batley, J. (2006). An assessment of genetic diversity within and between Brassica napus and Brassica juncea lines from International Germplasm Collections. Proc. Joint Meeting 14th Crucifer Genetics Workshop 115 & 4th ISHS Symposium on Brassicas. Acta Horticulture, 706, 115-119. [ Links ]
Hu, S., Yu, C., Zhao, H., Sun, G., Zhao, S., Vyvadilova, M. & Kucera, V. (2007) Genetic diversity of Brassica napus L. Germplasm from China and Europe assessed by some agronomically important characters. Euphytica, 154, 9-16. [ Links ]
Huangfu, C., Song, X. & Qiang, S. G. (2009). ISSR variation within and among wild Brassica juncea populations: implication forherbicide resistance evolution. Genetic Resources and Crop Evolution, 56, 913-24. [ Links ]
Jain, A., Bhatia, S., Banga, S. S., Prakash, S. & Lakshmikumaran, M. (1994). Potential use of random amplified polymorphic DNA (RAPD) technique to study the genetic diversity in Indian mustard (Brassica juncea) and its relationship to heterosis. Theoritical and Applied Genetetics, 88, 116-122. [ Links ]
Jaccard, P. (1908). Nouvelles researches sur la distribution florale. Bulletin de la Societe Vaudoise des Sciences Naturelles, 44, 223-270. [ Links ]
Khan, M. A., von Witzke-Ehbrecht, S., Maass, B. L. & Becker, H. C. (2009). Relationships among different geographical groups, agromorphology, fatty acid composition and RAPD marker diversity in safflower (Carthamus tinctorius). Genetic Resources and Crop Evolution, 56, 19-30. [ Links ]
Khan, W. M., Munir, I., Farhatullah, Arif, M., Iqbal, A., Ali, I., Ahmad, D., Ahmad, M., Mian, A., Bakht, J., Inamullah & Swati, Z. A. (2011). Assessment of genetic diversity of Brassica juncea germplasm using Randomly Amplified Polymorphic DNA (RAPD) markers. African Journal of Biotechnology, 10, 3654-3658. [ Links ]
Kumar, R. & Gupta, V. P. (1985). Isozyme studies in Indian mustard (Brassica juncea L.). Theoretical and Applied Genetics, 69, 1-4. [ Links ]
Kumar, A., Kumar, V. & Kandpal, B. K. (2012). Production barriers and technological options for sustainable production of rapeseed mustard in India. Souviner 1st National Brassica Conference on Production barriers and technological options in oilseed Brassica organized by Society for Rapeseed Mustard Research, Bharatpur, India. [ Links ]
Malode, S. N., Shingnapure, S. M., Waghmare, V. N. & Sutar, S. (2010). Genetic diversity analysis of some exotic, Indian and mutant Brassica sp. through RAPD markers. African Journal of Biotechnology, 9, 3981-3987. [ Links ]
Mishra, M. K., Suresh, N., Bhat, A. M., Suryaprakash, N., Kumar, S. S., Kumar, A. & Jayarama. (2011). Genetic molecular analysis of Coffea arabica (Rubiaceae) hybrids using SRAP markers. Revista de Biología Tropical, 59, 607-617. [ Links ]
Mohammadi, S. A. & Prasanna, B. M. (2003). Analysis of genetic diversity in crop plants salient statistical tools and considerations. Review & Interpretation. Crop Science, 43, 1235-1248. [ Links ]
Murray, M. G. & Thompson, W. F. (1980). Rapid isolation of high molecular weight plant DNA. Nucleic Acids Research, 8, 4321-4326. [ Links ]
Nei, M. (1976). Analysis of gene diversity in subdivided populations. Proceedings of the National Academy of Sciences USA, 70, 3321-3323. [ Links ]
Panjabi, P., Jagannath, A., Bisht, N. C., Padmaja, K. L., Sharma, S., Gupta, V., Pradhan, A. K. & Pental, D. (2008). Comparative mapping of Brassica juncea and Arabidopsis thaliana using Intron Polymorphism (IP) markers: Homoeologous relationships, diversification and evolution of the A, B and C Brassica genomes. BMC Genomics, 9, 113-118. [ Links ]
Plieske, J. & Struss, D. (2001). Microsatellite markers for genome analysis in Brassica. I. Development in Brassica napus and abundance in Brassicaceae species. Theoretical and Applied Genetics, 102, 689-694. [ Links ]
Pradhan, A. K., Sodhi, Y. S., Mukhopadhyay, A. & Pental, D. (1993). Heterosis breeding in Indian mustard. Analysis of component characters contributing to heterosis for yield. Euphytica, 69, 219-229. [ Links ]
Qi, X., Yang, J. & Zhang, M. (2008) AFLP-based genetic diversity assessment among Chinese vegetable mustards (Brassica juncea (L.) Czern.) Genetic Resources and Crop Evoluation, 55, 705-711. [ Links ]
Redden, R., Vardy, M., Edwards, D., Raman, H. & Batley, J. (2009). Genetic and morphological diversity in the Brassicas and wild relatives. In 16th Australian Research Assembly on Brassicas. Ballarat, Victoria. [ Links ]
Rohlf, F. J. (1998). NTSYS-pc Numerical taxonomy and multivariate analysis system, version 2.02. New York: Exeter Publication. [ Links ]
Sheikh, F. A., Banga, S., Banga, S. S. & Najeeb, S. (2011). Development of Ethiopian mustard (Brassica carinata) with broad genetic base through interspecific hybridization with elite lines of Brassica napus and Brassica juncea. Journal of Agricultural Biotechnology and Sustantainable Development, 3, 77-84. [ Links ]
Singh, D., Arya, R. K., Chandra, N., Niwas, R. & Salisbury, P. (2010). Genetic diversity studies in relation to seed yield and its component traits in Indian mustard (Brassica juncea L. Czern & Coss.). Journal of Oilseeds Brassica, 1, 19-22. [ Links ]
Sokal, R. R. & Michener, C. D. (1958). A statistical method for evaluating systematic relationships. The University of Kansas Science Bulletin, 38, 1409-1438. [ Links ]
Song, K. M., Osborn, T. C. & Williams, P. H. (1988). Brassica taxonomy based on nuclear Restriction Fragment Length Polymorphisms (RFLPs). Theoretical and Applied Genetics, 76, 593-600. [ Links ]
Srivastava, A., Gupta, V., Pental, D. & Pradhan, A. K. (2001) AFLP-based genetic diversity assessment amongst agronomically important natural and some newly synthesized lines of Brassica juncea. Theoretical and Applied Genetics, 102, 193-199. [ Links ]
Sun, D. L., Zhao, Q. C., Song, W. Q. & Chen, R. Y. (2001). Relationships analysis of Chinese cabbage species by AFLP. Acta Horticulture Sinica, 28, 331-335. [ Links ]
USDA. (2012). United States Department of Agriculture. Retrieved from www.usda.gov/oce/forum/. [ Links ]
Uzunova, M. I. & Ecke, W. (1999). Abundance, polymorphism and genetic mapping of microsatellites in oilseed rape (B. napus L.). Plant Breeding, 118, 323-326. [ Links ]
Vaishnava, A., Sachan, J. N. & Tewari, S. K. (2006). Genetic divergence for important quantitative traits in Indian mustard (Brassica juncea (L.) Czern and Coss). Agricultural Science Digest, 26, 269-272. [ Links ]
Vieira, E., Carvalho, F., Bertan, I., Kopp, M., Zimmer, P., Benin, G., da Silva, J., Hartwig, I., Malone, G. & de Oliviera, A. (2007). Association between genetic distances in wheat (Triticum aestivum L.) as estimated by AFLP and morphological markers. Genetics and Molecular Biology, 30, 392-399. [ Links ]
Wang, J., Kaur, S., Cogan, N. O. I., Dobrowolski, M. P., Salisbury, P. A., Burton, W. A., Baillie, R., Hand, M., Hopkins, C., Forster, J. W., Smith, K. F. & Spangenberg, G. (2009). Assessment of genetic diversity in Australian canola (Brassica napus L.) cultivars using SSR markers. Crop and Pasture Science, 60, 1193-1201. [ Links ]
Yadava, D. K., Sapra, R. L., Sujata, V., Dass, B. & Prabhu, K. V. (2009). Selection of high diversity with a minimal set of accessions from Indian mustard Brassica juncea (L.) Czern & Coss. germplasm collection. Indian Journal of Agricultural Sciences, 79, 552-554. [ Links ]
Yildirim, E., Yildirim, N., Ercisli, S., Agar, G. & Karlidag, H. (2010). Genetic relationships among turnip (Brassica rapa var. rapa) genotypes. Genetics and Molecular Research, 9, 987-993. [ Links ]
Zhao, J. J., Wang, X. W., Deng, B., Lou, P., Wu, L., Sun, R. F., Xu, Z. Y., Vromans, J., Koornneef, M. & Bonnema, G. (2005). Genetic relationships within Brassica rapa as inferred from AFLP fingerprints. Theoretical and Applied Genetics, 110, 1301-1314. [ Links ]
*Correspondencia a:
Vinu V.: Division of Genetics, Indian Agricultural Research Institute, New Delhi-110 012; vinu.kathu@gmail.com
Naveen Singh: Division of Genetics, Indian Agricultural Research Institute, New Delhi-110 012; n.singhk@rediffmail.com
Sujata Vasudev: Division of Genetics, Indian Agricultural Research Institute, New Delhi-110 012; sujatavasudev@gmail.com
Devendra Kumar Yadava: Division of Genetics, Indian Agricultural Research Institute, New Delhi-110 012; dkygenet@gmail.com
Sushil Kumar: NRC on Plant Biotechnology, IARI Campus, New Delhi-110 012; sushil254386@yahoo.com
Sugandh Naresh: Division of Genetics, Indian Agricultural Research Institute, New Delhi-110 012; khusboo.mehak@gmail.com
Sripad Ramachandra Bhat: NRC on Plant Biotechnology, IARI Campus, New Delhi-110 012; srbhat22@rediffmail.com
Kumble Vinod Prabhu: Division of Genetics, Indian Agricultural Research Institute, New Delhi-110 012; kvinodprabhu@rediffmail.com
1.Division of Genetics, Indian Agricultural Research Institute, New Delhi-110 012; vinu.kathu@gmail.com, n.singhk@rediffmail.com, sujatavasudev@gmail.com, dkygenet@gmail.com, khusboo.mehak@gmail.com, kvinodprabhu@rediffmail.com
2.NRC on Plant Biotechnology, IARI Campus, New Delhi-110 012; sushil254386@yahoo.com, srbhat22@rediffmail.com
Received 12-XI-2012. Corrected 20-VI-2013. Accepted 22-VII-2013.

