


Services on Demand
Journal
Article
 English (pdf)
 Article in xml format
 Article references
 Send this article by e-mail
Indicators
-
 Cited by SciELO
 -
 Access statistics
Related links
-
 Similars in
SciELO
Similars in
SciELO  uBio
uBio
Share

 Permalink
Revista de Biología Tropical
On-line version ISSN 0034-7744Print version ISSN 0034-7744
Rev. biol. trop vol.60 suppl.2 San José Apr. 2012
Atmospheric forcing of cool subsurface water events in Bahía Culebra, Gulf of Papagayo, Costa Rica
*Dirección para correspondencia
Abstract
Bahía Culebra, at Gulf of Papagayo on the north Pacific coast of Costa Rica, is an area of seasonal upwelling where more intense cooling events may occur during some boreal winter weeks mainly. To study these extreme cool events, records of nine sea subsurface temperature stations from 1998 to 2010 were analyzed. Five events associated with extremely cool temperatures in this region were identified from these records and taken as study cases. Sea temperatures decreased about 8-9ºC during these events and occurred while cold fronts were present in the Caribbean, with strong trade wind conditions over Central America. These strong wind conditions may have favored the offshore displacement of the sea surface water. The axis of Bahía Culebra runs northeastsouthwest, a condition that favors and triggers cool water events, mainly because the displaced water is replaced by water from deeper levels.
Key words: Bahía Culebra, Gulf of Papagayo, Costa Rica, sea subsurface temperature, upwelling, cold frontsoutbreaks, Central America.
Resumen
Bahía Culebra, localizada en el Golfo de Papagayo, al norte de la costa del Pacífico de Costa Rica, es un área de afloramiento estacional, en donde pueden ocurrir eventos de enfriamiento más intensos, principalmente durante algunas semanas del invierno boreal. Para estudiar estos eventos de enfriamiento extremo, se analizaron datos de nueve estaciones con registros de la temperatura subsuperficial del mar, desde 1998 hasta el 2010. A partir de estos registros, se identificaron cinco casos de estudio asociados a enfriamientos del mar en la región. Los descensos de la temperatura de estos eventos fueron de aproximadamente 8-9ºC y se asociaron al paso de empujes fríos en la región del Caribe y una fuerte magnitud del viento alisio sobre América Central. Este reforzamiento del flujo alisio favorece el desplazamiento del agua superficial hacia afuera de Bahía Culebra, cuyo eje principal se ubica en la dirección noreste-suroeste. Lo anterior favorece y provoca un enfriamiento de la temperatura del mar en la bahía, ya que el agua desplazada es reemplazada por aguas más frías provenientes de profundidades mayores.
Palabras clave: Bahía Culebra, Golfo de Papagayo, Costa Rica, temperatura sub-superficial del mar, afloramiento-surgencia, frentes-empujes fríos, América Central.
During the boreal winter, Central America experiences an intensification of the trade winds as well as a southwardly intrusion of cold air masses, known as cold fronts or “cold outbreaks” (Amador et al. 2006). The concept of “cold outbreaks” includes a synoptic configuration wherever they are present, be it a cold front or a shear line, followed by an advection of cold air, whose main characteristic is a migratory anticyclone in the lower troposphere (Zárate 2005). The cold fronts, and the accompanying winds from the north, arrive most frequently to Central America between December and March (González 1999, Brenes et al. 2003), but reach their maximum intensity in January (Zárate 2005). These cold winds are locally known as “nortes” (Magaña et al. 1999, Magaña & Vázquez 2000). The cold air masses associated with the fronts come from northern Canada and the polar region. They may reach tropical latitudes in the Caribbean, and affect even the northern parts of South America producing strong winds and rain events on the Caribbean Sea basin (Amador et al. 2006).
The intrusion of cold fronts in the Caribbean Sea, specifically their arrival to the Honduras Gulf is one of the conditions that originate the Caribbean “temporales” in Costa Rica (Fallas & Oviedo 2003). A “temporal” is defined as “a condition of several days of cloudy skies, with at least 24 hours of persistent rains of variable intensity, with outbreaks of rain at any time of the day” (Fallas & Oviedo 2003). As a consequence of the Foehn or Föhn effect (Oliver 2005), whenever such conditions are present in Costa Ricas’s Caribbean watershed, the Pacific coast usually remains drier, windier and warmer (Alvarado 2001).
The southward movement of these polar air masses creates strong pressure gradients between the Caribbean and the tropical eastern Pacific regions (Amador et al. 2006). Winds are funneled through topographic depressions in Central America, such as the one located in the lowlands of southern Nicaragua and northern Costa Rica, where windspeeds reach up to 50 ms-1 at 10 m. These wind jets (locally known as “papagayos”) may blow as far as 500 km off the Pacific coast, and have a time scale in the order of weeks (Fiedler & Talley 2006, Kessler 2006).
Strong-wind conditions are associated with the upwelling off the coast of southern Nicaragua and northern Costa Rica, the Gulf of Papagayo, largely due to the pumping Ekman Effect (Kessler 2006). According to Alfaro and Lizano (2001), the El Niño-Southern Oscillation (ENSO) signal dominates the inter-annual variability in the Golfo de Papagayo upwelling region. Alfaro et al. (2011), describes also the possible sources of variability for monthly or seasonal warm and cold events in the sea temperature of Bahía Culebra.
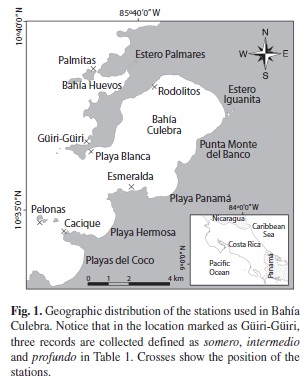
It has been documented that the funneling of these strong northeasterly winds through passages in the mountains produces upwelling in the semi-enclosed bodies in the Pacific coast of Costa Rica (Jiménez 2001a, Brenes et al. 2003). The winds drive the surface water off a gulf or a bay thus causing this water to be replaced by cooler water from the depths. In Bahía Culebra (Fig. 1, more specifically at Güiri-Güiri reef) Jiménez (2001a) recorded sea subsurface temperatures ranging from 9.9 to 31.6°C. During the upwelling period (defined by the authors as December – April associated with the dry season) sea subsurface temperatures are significantly lower than in the non-upwelling period (rainy season, May to November).
The objective of this work is both to study the cold events that could be inferred by studying the registered sea subsurface temperatures (SSbT) in Bahía Culebra, and also to analyze the synoptic conditions of the historical sources in which they occurred in order to identify the atmospheric mechanisms that favored their appearance.
Materials and Methods
Sea subsurface temperature data (Hobotemp ® loggers, Onset Computer Corp. ) from 9 stations located in Culebra Bay, Costa Rica, were analyzed (Table 1, Fig. 1). Table 1 includes features such as depth of station, period of analysis and percentage of missing data. Data loggers recorded temperatures every 30 minutes, and were replaced every month for 12 years, from 1998 to 2010. In Güiri somero, Rodolitos and Playa Blanca data recording started in 1999, 2003 and 2004, respectively.
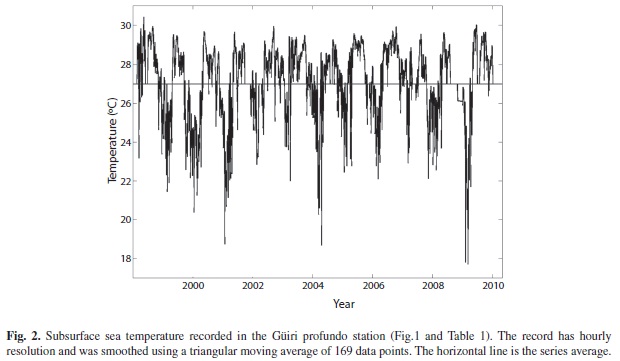
As a first step, time-series with a timeresolution of 1 hour were produced for each station. The missing data from the hourly registers were completed with the historical average for the corresponding series. In order to filter the daily cycle in the time-series, the high-frequency signals were filtered with a triangular moving average of 169 data points (approximately 7 days), according to Soley (1994). To illustrate this, the filtered time series for Güiri profundo station is shown in Figure 2. In this station, the main cool peaks in SSbT were of approximately 8-9ºC below the average. Once filtered, the time-series were visually and simultaneously examined in order to select the five cases with the lowest SSbTs. The selected time-periods were then normalized by subtracting the monthly values from the series historical monthly average and by dividing it by the historical monthly standard deviation values (i.e. from all the hourly data of the corresponding month presented in the time series, see Alfaro et al. 2011 for these monthly values). This allowed for comparison between events, removing the influence of the annual cycle, as well as for comparison between sampling sites, removing the spatial variability. For each station, the onset of the event was defined as the time at which the normalized series started to decrease; the end of the event was defined as the moment at which the normalized series ceased to increase. The magnitude of the cool water events was defined as the value localized in the minimum of the valley of the event.
Mean hourly data (November 1998 to November 2007) from the National Meteorological Institute (IMN in Spanish) Liberia meteorological station was examined in order to compare SSbT anomalies with the magnitude of the surface wind. Located at 10º35’N, 85º32’W and 80 meters above sea level (http://www.imn.ac.cr, last visit 25/02/2011) Liberia station is the closest meteorological station (13.5 km approximately) to Culebra Bay. Hourly data was examined in the same fashion as data for the identified cooling events. Liberia station daily wind mean magnitudes from the record at the NOAA National Climatic Data Center (http://www7.ncdc.noaa.gov/CDO/cdo, last visit 25/02/2011) between January 1977 and June 2009 was also examined and analyzed similarly to the hourly data, but since this is a daily record, data were smoothed with a triangular moving average of 7 data points (Soley 1994). This record helped in analyzing the wind for events identified after 2007. Wind magnitudes at the Liberia station are plotted multiplied by -1, which means that negative (positive) values correspond to positive (negative) normalized wind anomalies. This method of plotting the wind magnitude in Liberia was applied to all figures that include this variable, in order to facilitate their comparison with the SSbT.
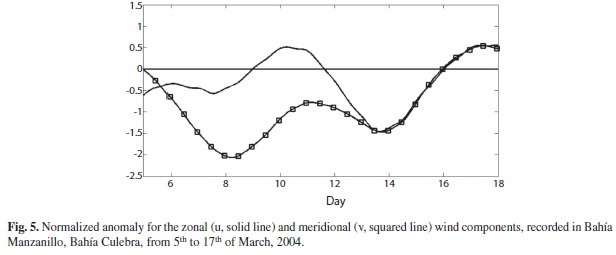
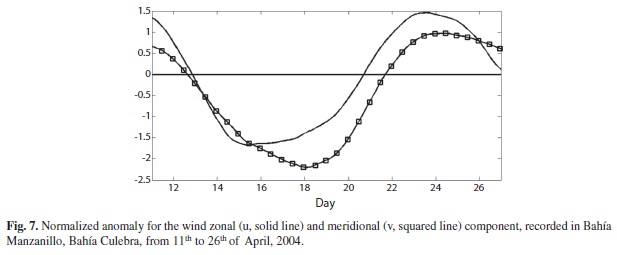
Wind vectors described by Wesson-Acuña (2005) for Bahía Manzanillo, within Bahía Culebra, between December 2003 and June 2005 were also examined. Data was collected with a 5-minute temporal resolution using an anemometer located 5.5 m above the surface, at 10º38’35’’N and 85º39’08’’W (see Fig. 2, from Wesson-Vizcaíno 2006). Based on that information, the zonal (u) and meridional (v) wind components were estimated, as well as the hourly values, and subsequently filtered with a triangular moving average of 169 data points. The normalization of the wind components, u and v, was completed with the average and standard deviation values for the month corresponding to the cooling event under analysis.
Finally, the synoptic information corresponding to the cooling events was obtained from the IMN of Costa Rica Monthly Bulletin and complemented with sea surface temperature (SST) data from Reynolds and Smith (1994), centered at 10.5ºN 85.7ºW, from a 2º x 2º grid. Zárate (2005) provided data for the annual occurrence of “cold fronts or outbreaks” in the Caribbean. Climate variability indexes associated to ENSO, the Tropical North Atlantic region (TNA, Alfaro 2000) and the North Atlantic Oscillation (NAO, Hurrell 2005) were accessed consulting the NOAA climate index base (http://www.cpc.ncep.noaa.gov/data/indices/, last visit 02/03/2011).
Results
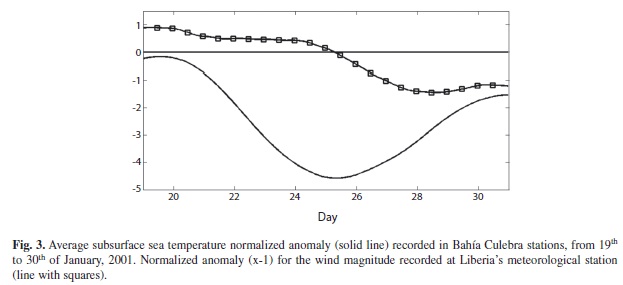
January 2001: Figure 3 shows the mean hourly values for six of the SSbT recorded this month (no data were available for Esmeralda, Playa Blanca and Rodolitos stations).
From the SSbT normalized anomalies obtained by averaging of all stations, it was found that the event started in the afternoon of the 19th and ended the night of the 30th. Consequently the event lasted an average of 11.4 days. The maximum magnitude of the cooling reached -4.6 the morning of the 25th. SSbT readings were below average for January at the onset and also at the end of the event, which coincided with an increase in the wind magnitude in Liberia. Winds reached its maximum value the 29th, and maintained strong conditions throughout the event.
Table 2 shows a characterization of the event at the different stations. In Güiri somero the event began earlier and lasted longer than in any other station. The onset of the event was delayed at Cacique, where SSbT showed the weakest anomaly. The strongest anomaly was registered at Pelonas, where the event finished earlier than those of the rest of the stations.
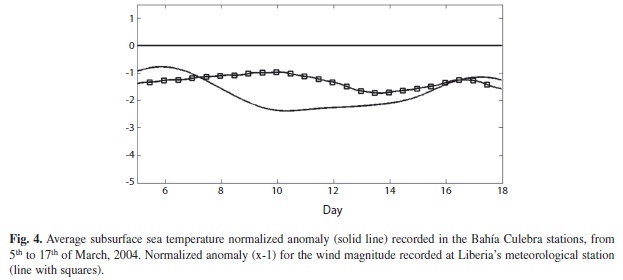
March 2004: For this and for the following event, there are data available for all the stations. The event started the night of March 5th, amongst temperatures below average for the month, and concluded at dawn of the 17th. It lasted on average 11.3 days (Fig. 4) with colder than average temperatures. Maximum magnitude was measured in the early morning hours of the 10th, with a value of -2.4. Throughout the event, strong winds prevailed at Liberia station, where anomalies, mainly associated to NE winds, reached a maximum on the 13th, while northerly winds reached their maximum magnitude on the 8th (Fig. 5).
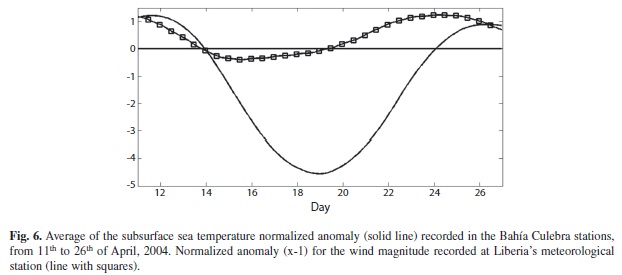
April 2004: This event, as did the January 2001 event, recorded a very strong anomaly. From the average of all stations, the anomaly reached a minimum of -4.6 on the 18th at night. The event started in the afternoon of the 11th and ended in the morning of the 26th, having a duration of 14.7 days. During this event, weather conditions for April were warmer than average. The onset of the event was accompanied by a strengthening of the wind magnitude at the IMN Liberia station, where maximum magnitude was reached on April 15th (Fig. 6). NE wind anomalies remained in Bahía Manzanillo from April 13th to April 21st (Fig. 7).
The event started and finished first in Pelonas. The event started last in Playa Blanca (Table 4). Rodolitos exhibited both the strongest anomaly and longest duration of the event. Esmeralda recorded the weakest anomaly (Table 4).
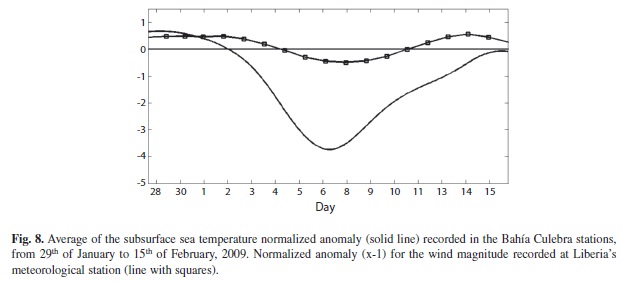
February 2009: The cooling event developed in conditions warmer than average for the month, but ended in conditions slightly cooler (Fig. 8). No data were available for the Cacique and Pelona stations. No records of the beginning of the event were available for Güiri somero and neither for Playa Blanca (Table 5). On average, the cooling started on the afternoon of January 29th and ended on February 15th, also in the afternoon, and reached its highest peak in the morning hours of February 7th. The event lasted on average 17 days, and had a mean magnitude of -3.7. Winds at the Liberia station started to blow stronger on February 2nd, reaching their maximum on the 8th, and remained strong until the 10th of February.
The event first developed at Güiri intermedio, and started last at Rodolitos. The strongest anomaly was recorded in Playa Blanca, the weakest, in Esmeralda. The event appears to have ended first in Güiri profundo, then last in Playa Blanca (Table 5).
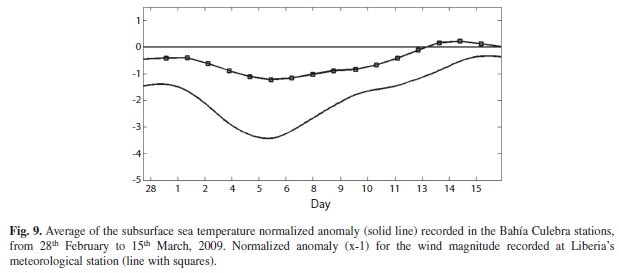
March 2009: This event developed during cooler than average conditions for the month of March. The event started in the afternoon on February 28th, and ended in the morning on March 16th in cooler than average conditions. It remained in place for an average of 15.6 days, and it reached a maximum of -3.4 at night on March 5th (Fig. 9). As in the previous case (February 2009), no records were available for Cacique or Güiri somero. Also, no data were available to determine the beginning of the event at Pelonas (Table 6). The preexistent cold conditions coincided with the strong wind conditions at Liberia, where the intensity of the winds reached a peak on March 5th, and remained so until the 12th.
The event both started and finished first in Güiri profundo. It started last in Esmeralda, where the weakest anomaly was recorded. The strongest anomaly was observed in Palmitas. The latest finishing of this event was observed in Playa Blanca (Table 6).
Discussion
In January 2001 three cold fronts reached Costa Rica (Alvarado 2001). One of the most intense of these arrived on the 25th of the month. Average wind velocity analysis showed trade winds blowing at higher than normal magnitudes, particularly over the Pacific coast of El Salvador, Nicaragua and northeastern Costa Rica. According to Alvarado (2001), from the 23rd to the 27th of January, a “temporal” impacted both the northern and eastern parts of Costa Rica generating a drop in temperatures that lasted from January 24th to January 27th. These synoptic conditions match the features shown on Fig. 3. SST measurements observed in the North Pacific coast of Costa Rica in January 2001 were classified as normal, although negative anomalies in the equatorial Pacific region were observed and associated to the ENSO. The North Atlantic Oscillation index showed positive SST anomalies for the month of January. On the contrary, they were negative for the Tropical North Atlantic region.
High-pressure systems persisted during March 2004 at different atmospheric levels. Trade winds intensity ranged from moderate to strong, with occasional gusts of wind, and several cold fronts intrusions into the Caribbean (Pereira 2004). In Costa Rica, the winds did not weaken until the end of the month, which coincided with the strong wind conditions that characterized the March event (Fig. 4).
Alvarado (2004) informed that from the 15th to the 20th of April 2004, there was a sudden descent in temperature as a result of the trade winds and the passage of a cold front on April 15th. The cold front unleashed a “temporal” of small magnitude in the Caribbean watershed of Costa Rica. Halfway through the month, and again, as a consequence of the cold front, temperatures dropped around the country, with the trades picking up speed. The effect of the cold front was felt in the country from the 15th to the 18th of April 2004. A weak “temporal” impacted the Caribbean watershed including the North Costa Rican region. The event was preceded by both a heat wave and a collapse of the trade winds. The data presented by Alvarado (2004) matches the behavior of the wind at Liberia station at the time, as well as the SSbT measurements in Bahía Culebra (Fig. 6). During the 2004 cold events, the ENSO phase was considered normal, as well as the sea surface temperature in the North Pacific coast of Costa Rica. The North Atlantic Oscillation showed positive anomalies in March and April of 2004, and in the Tropical North Atlantic region, the sea surface temperature showed positive anomalies.
Quirós (2009) documented extensively the synoptic conditions associated to the February 2009 cold event. She described a cold front positioned over Costa Rica from the 3rd to the 8th of February causing a “temporal” in the Caribbean zone of the country. On February 3rd, she added that the cold front stationed over Belize projected a shear line towards Nicaragua, and caused an increase in cloud coverage over the Caribbean Sea. Several days of windy conditions ensued. Gusts of wind of up to 46 km hr-1 were recorded at Liberia. Quirós (2009) states that, on February 5th the cold front positioned over Costa Rica intensifying the winds. Wind velocity reached 85 km hr-1 in Liberia. Windy conditions were associated with high-pressure atmospheric systems dominating the region from southern United States to Costa Rica. February 6th recorded the sharpest descent in temperatures as a consequence of the cold front effect. The “temporal” lasted until February 8th. Streamlines showed that on February 3rd a “trough” or low atmospheric pressure axis developed in the Caribbean sector between Costa Rica and Panamá, while the cold front was stationed in Belize, and the shear line to the north of Nicaragua. Between February 5th and 6th the shear line moved to Panamá and a new cold event impacted the country. The incoming winds from the north caused a descent in temperatures that lasted until February 8th. The intensity of that system was reflected in the intensity of the anomalies reported by SSbT in Bahía Culebra (Fig. 8). There were no reports of precipitation at the Liberia weather station for the month of February, which represented a -1.9 mm anomaly. The average maximum and minimum temperature anomalies in Liberia were 0.3 and 0.6ºC, respectively; that is, slightly warm but still close to their climatic value.
Alfaro (2009) pointed out that windy conditions prevailed in Costa Rica during the first half of March 2009 causing heavy rains in the Caribbean zone. According to Alfaro (2009), another variable that was affected by the rainy and windy conditions was the air temperature. A cold front that arrived at the country at the time increased the cloud coverage on the Caribbean region and in general affected the mean temperatures of the entire country. This matched the negative SSbT anomalies measured during the March 2009 event (Fig. 9). Precipitation, along with mean maximum and minimum temperature anomalies measured -4.5 mm, -0.4 y -1.1ºC, respectively, at the Liberia weather station, meaning that conditions were drier and slightly cooler as compared to their climatic value. The ENSO phase during the events of 2009 were classified as a weak La Niña. Measurements of sea surface temperature in the North Pacific of Costa Rica were considered below normal. NAO showed positive anomalies during March 2009, while the anomalies were negative for the TNA index.
As previous paragraphs described, all the identified study-cases associated with cold anomalies in SSbT in Bahía Culebra are coincident with the intrusion of cold fronts into the Caribbean Sea. As trade winds gain intensity, they favor an offshore displacement of the surface water in Bahía Culebra. The displacement of surface water and its replacement by cooler water from deeper layers is responsible for the colder SSbT measured at the stations under analysis. Fiedler and Talley (2006) pointed out that jet-like flows that form in Papagayo during the boreal winter produce the upwelling of waters located close to the thermocline. This mixing of waters takes place at the surface.
Tables 2-4 describe the main features of the cold events. The events tended to appear and finish first at Güiri profundo, where minimum temperature was also reached at an earlier stage than in the rest of the stations. This observation is consistent with the hypothesis that during NE wind burst, there is a displacement of surface water off the Bay and it is replaced with colder water from deeper layers. The deepest station therefore, responds more rapidly to the atmospheric forcing, e.g. the presence of intense NE winds similar to those associated with the arrival of a cold front to Central America. The opposite was observed at Playa Blanca. In this station events tended to begin and finish later than in the other locations. Minimum temperature was also reached later with the events tending to last longer. This could partially be due to the topographical protection the site exhibits in regard to the NE flow (Fig. 1), which would make it respond more slowly to the atmospheric forcing. This station however, exhibited one of the lowest temperatures recorded. In Pelonas, located outside the bay, events tended to be shorter compared to sites inside the bay, which could have been related to entrainment processes in this semienclosed body of water. The magnitude of the cold-water events was weaker at Esmeralda station, at the southwest of the bay, perhaps due to a local circulation. This hypothesis however needs further examination. It is worth noting that Jimenez (2001b) reported from this station a reef-building coral not found in any of the other sites examined in the bay.
No correlation was found between the occurrence of study-cases and a specific ENSO phase; however, all the studied events took place under positive NAO index values. This index is a comparison between the centers of high sea level pressure of the North Atlantic and the polar low (Hurrell 2005). The positive anomalies of the index therefore indicate a strengthening of the subtropical high and at the same time a strengthening of the trade winds in low latitudes, particularly in the Atlantic, with normally negative anomalies for the sea surface temperature in the Tropical North Atlantic region.
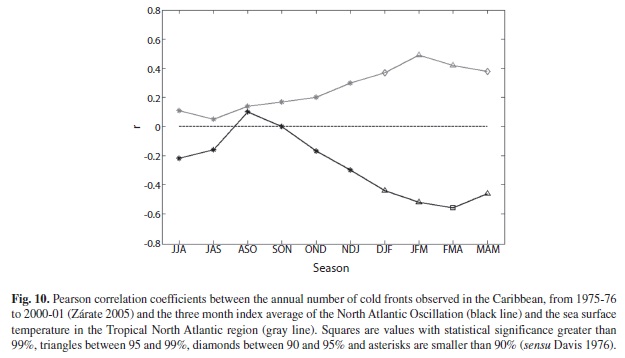
Zárate (2005) suggests that one source for the climatic variability of these “cold fronts” is the NAO. This correlates positively with the Arctic Oscillation, being that the NAO is one of its components. Also, the NAO presents a negative correlation with the sea surface temperature in the Tropical North Atlantic region. In order to examine in more detail the possible correlation between the North Atlantic Oscillation and the sea surface temperature in the Tropical North Atlantic region, as probable sources of climate variability, together with the cool subsurface water events observed in Bahía Culebra, the correlation coefficients between the annual number of cold fronts observed in the Caribbean from 1975-76 to 2000-01 (Zárate 2005) and the three month index average of the NAO and the sea surface temperature in the Tropical North Atlantic region are plotted in Figure 10. Cold fronts time series elaborated by Zárate (2005) didn’t show any statistical significance in its trend from 1975-76 to 2000-01, in which 426 events were identified. Although the time series for the occurrence of cold fronts in the Caribbean is relatively short, it is possible to observe that during the boreal winter, the NAO positive (negative) values tend to be coupled with boreal winter periods of low (high) occurrences of cold fronts in the Caribbean, and also with negative (positive) anomalies in the Tropical North Atlantic region (Fig. 10), as stated by Hurrell (2005) and Zárate (2005). “Cold fronts”, as we suggested above, are the atmospheric forcing for the cold events observed at Bahía Culebra.
Acknowledgments
This work was partially supported by the following projects of the Vicerrectoría de Investigación (Vice-rectory for Research), University of Costa Rica: 808-98-013, 808-B0-092, 805-B0-065, 805-A9-532, 808-A9-180, 808-A9-070, 805-A8-606, 805-A7-002 and 808-B2-400, and CRN2050-IAI. The support given by Ecodesarrollo Papagayo has been decisive for the monitoring work carried out throughout these years. We also thank all the assistants that have cooperated with the program since it was set in motion. The Centro de Investigación en Ciencias del Mar y Limnología (CIMAR) of the University of Costa Rica has granted invaluable logistic support. Equally important has been the support of the Instituto Costarricense de Turismo, institution that has generously allowed the use of its facilities at Playa Panamá, Bahía Culebra. To Laura Zúñiga and Natalie Mora for their support in the original data base processing.
References
Alfaro, E. 2000. Eventos cálidos y fríos en el Atlántico Tropical Norte. Atmósfera 13: 109-119. [ Links ]
Alfaro, E.J. & O.G. Lizano. 2001. Algunas relaciones entre las zonas de surgencia del Pacífico Centroamericano y los océanos Pacífico y Atlántico tropicales. Rev. Biol. Trop. 49 (Suppl. 2): 185-193. [ Links ]
Alfaro, E., J. Cortés, J. Alvarado, C. Jiménez, C. Sánchez, J. Nivia, A. León y E. Ruiz, 2011. Clima y variabilidad climática de la temperatura subsuperfical del mar en Bahía Culebra, Golfo de Papagayo, Costa Rica. Sometido a la Revista de Biología Tropical, este volumen. [ Links ]
Alfaro, R. 2009. Resumen meteorológico: Marzo de 2009. Boletín Meteorológico Mensual. Instituto Meteorológico Nacional, Ministerio de Ambiente, Energía y Telecomunicaciones, San José, Costa Rica. Marzo, 2009: 2-6. [ Links ]
Alvarado, L. 2001. Resumen sinóptico de enero. Boletín Meteorológico Mensual. Instituto Meteorológico Nacional, Ministerio de Ambiente y Energía, San José, Costa Rica. Enero, 2001: 5-8. [ Links ]
Alvarado, L. 2004. Comentario meteorológico, abril 2004. Boletín Meteorológico Mensual. Instituto Meteorológico Nacional, Ministerio de Ambiente y Energía, San José, Costa Rica. Abril, 2004: 4-7. [ Links ]
Amador, J.A., E.J. Alfaro, O.G. Lizano & V.O. Magaña. 2006. Atmospheric forcing in the Eastern Tropical Pacific: A review. Prog. Oceanogr. 69: 101-142. [ Links ]
Brenes, C.L., J.E. Coen, D.B. Chelton, D.B. Enfield, S. León & D. Ballestero. 2003. Wind driven upwelling in the Gulf of Nicoya, Costa Rica. Int. J. Rem. Sens. 24: 1127-1133. [ Links ]
Davis, R.E. 1976. Predictability of sea surface temperature and sea level pressure anomalies over the North Pacific Ocean. J. Phys. Oceanogr. 6: 249-266. [ Links ]
Fallas, J.C. & R. Oviedo. 2003. Temporales. Cap. III. In: Fenómenos atmosféricos y cambio climático, visión centroamericana. Instituto Meteorológico Nacional, San José, Costa Rica. 38 p. [ Links ]
Fiedler, P.C. & L.D. Talley. 2006. Hydrography of the eastern tropical Pacific: A review. Prog. Oceanogr. 69: 143-180. [ Links ]
González, C. 1999. Climatología de frentes fríos que han afectado Cuba desde 1916-1917 hasta 1996-1997. Rev. Cub. Met. 66: 15-19. [ Links ]
Hurrell, J.W. 2005. North Atlantic Oscillation, 536-539. In: J.E. Oliver (ed.). The Encyclopedia of World Climatology. Springer, Netherlands. [ Links ]
Jiménez, C. 2001a. Seawater temperature measured at the surface and at two depths (7 and 12 m) in one coral reef at Culebra Bay, Gulf of Papagayo, Costa Rica. Rev. Biol. Trop. 49 (Suppl. 2): 153-161. [ Links ]
Jiménez, C. 2001b. Arrecifes y ambientes coralinos de Bahía Culebra, Pacífico de Costa Rica: aspectos biológicos, económico-recreativos y de manejo. Rev. Biol. Trop. 49 (Suppl. 2): 215-231. [ Links ]
Kessler, W.S. 2006. The circulation of the eastern tropical Pacific: A review. Prog. Oceanogr. 69: 181-217. [ Links ]
Magaña, V., J. Pérez, J. Vázquez, E. Carrisoza & J. Pérez. 1999. Los Nortes. Cap. 2. El Niño y el clima, 34-41. In: V.O. Magaña (ed.). Los Impactos de El Niño en México. UNAM, México D.F., México. [ Links ]
Magaña, V.O. & J. Vázquez. 2000. Interannual variability of northern activity over the Americas, 116-117. 24th Conference on Hurricanes and Tropical Meteorology. 29 May 2 June, 2000. Fort Lauderdale, Florida, USA. [ Links ]
Oliver, J.E. 2005. Local winds, 467-475. In: J.E. Oliver (ed.). The Encyclopedia of World Climatology. Springer, Netherlands. [ Links ]
Pereira, M. 2004. Resumen sinóptico, marzo 2004. Boletín Meteorológico Mensual. Instituto Meteorológico Nacional, Ministerio de Ambiente y Energía, San José, Costa Rica. Marzo, 2004: 4-6. [ Links ]
Quirós, E. 2009. Resumen meteorológico: Febrero de 2009. Boletín Meteorológico Mensual. Instituto Meteorológico Nacional, Ministerio de Ambiente, Energía y Telecomunicaciones, San José, Costa Rica. Febrero, 2009: 2-4. [ Links ]
Reynolds, R. & T. Smith. 1994. Improved global sea surface temperature analyses using optimum interpolation. J. Clim. 7: 929-948. [ Links ]
Soley, F.J. 1994. Suavizamiento de series cronológicas geofísicas con ruido blanco y rojo aditivo. Rev. Geofís. 41: 33-58. [ Links ]
Wesson-Acuña, A. 2005. Wind Study for Bahía Manzanillo, Marina Papagayo, Golfo de Papagayo, Costa Rica. Informe Técnico. WATERMARK S.A., San José, Costa Rica. 157 p. [ Links ]
Wesson-Vizcaíno, M. 2006. Local Wind Wave Design Conditions at Marina Papagayo, Golfo de Papagayo, Costa Rica. Informe Técnico. WATERMARK S.A., San José, Costa Rica. 67 p. [ Links ]
Zárate, E. 2005. Comportamiento de los Empujes Fríos que alcanzan Centroamérica y el Caribe. Informe Técnico, Proyecto “Assessment of Impacts and Adaptation Measures for the Water Resources Sector due to Extreme Events under Climate Change Conditions in Central America (LA06)”. AIACC-UCR-CRRH, San José, Costa Rica. 24 p. [ Links ]
*Correspondencia a:
Eric J. Alfaro. Centro de Investigación en Ciencias del Mar y Limnología. Centro de Investigaciones Geofísicas. Escuela de Física, Universidad de Costa Rica, 11501-2060 San José, Costa Rica; erick.alfaro@ucr.ac.cr.
Jorge Cortés. Centro de Investigación en Ciencias del Mar y Limnología. Escuela de Biología, Universidad de Costa Rica, 11501-2060 San José, Costa Rica
1. Centro de Investigación en Ciencias del Mar y Limnología.
2. Centro de Investigaciones Geofísicas.
3. Escuela de Física, Universidad de Costa Rica, 11501-2060 San José, Costa Rica; erick.alfaro@ucr.ac.cr.
4. Escuela de Biología, Universidad de Costa Rica, 11501-2060 San José, Costa Rica
Received 03-V-2011. Corrected 02-IX-2011.Accepted 15-II-2012.

