


Services on Demand
Journal
Article
 Spanish (pdf)
 Article in xml format
 Article references
 Send this article by e-mail
Indicators
-
 Cited by SciELO
 -
 Access statistics
Related links
-
 Similars in
SciELO
Similars in
SciELO  uBio
uBio
Share

 Permalink
Revista de Biología Tropical
On-line version ISSN 0034-7744Print version ISSN 0034-7744
Rev. biol. trop vol.58 n.2 San José Jun. 2010
Spatial and temporal land cover changes in Terminos Lagoon Reserve, Mexico
Ernesto Soto-Galera1,3, Jaume Piera2 & Pilar López3
1. Instituto Mexicano del Petróleo. Eje Central Lázaro Cárdenas Norte 152, Col. San Bartolo Atepehucán. C.P. 07730, D.F., México; esoto@imp.mx
2. Unidad de Tecnología Marina, CMIMA-CSIC, Passeig Marítim de la Barceloneta, 37-49, Barcelona, España; jpiera@cmima.csic.es
3. Departamento de Ecología, Universitat de Barcelona. Av. Diagonal, 645, Barcelona, España; marilopez@ub.edu
Abstract
Terminos Lagoon ecosystem is the largest fluvial-lagoon estuarine system in the country and one of the most important reserves of coastal flora and fauna in Mexico. Since the seventies, part of the main infrastructure for country’s oil extraction is located in this area. Its high biodiversity has motivated different type of studies including deforestation processes and land use planning. In this work we used satellite image analysis to determine land cover changes in the area from 1974 to 2001. Our results indicate that tropical forest and mangroves presented the most extensive losses in its coverage. In contrast, urban areas and induced grassland increased considerably. In 2001 more than half of the ecosystem area showed changes from its original land cover, and a third part of it was deteriorated. The main causes of deforestation were both the increase in grassland and the growth of urban areas. However, deforestation was attenuated by natural reforestation and plant canopy recovery. We conclude that the introduction of cattle and urban development were the main causes for the land cover changes; however, the oil industry activity located in the ecosystem, has promoted indirectly to urban growth and rancher boom. Rev. Biol. Trop. 58 (2): 565-575. Epub 2010 June 02.
Keywords: land cover, coastal ecosystems, deforestation, remote sensing, oil industry.
Resumen
El ecosistema de Laguna de Términos es el más grande sistema fluvio lagunar estuarino del país y una de las reservas más importantes de flora y fauna costera en México. Desde la década de los setentas, parte de la infraestructura necesaria para la explotación del petróleo en el país se encuentra localizada en esta área. Su importante biodiversidad ha motivado diferentes estudios en el área que incluyen procesos de deforestación y ordenamiento del territorio. Se realizó un análisis de imágenes de satélite para determinar los cambios de uso del suelo y vegetación en el área entre 1974 y 2001. Los resultados indican que la selva tropical y el mangle presentan las mayores pérdidas de cobertura. En contraste, las áreas urbanas y los pastos inducidos han incrementado considerablemente su extensión. En el año 2001 más de la mitad del área ocupada por el ecosistema mostró cambios en sus coberturas originales y una tercera parte estaba deteriorada. La deforestación fue causada principalmente por el incremento de los pastizales y el crecimiento de las áreas urbanas. Sin embargo, estas pérdidas fueron atenuadas por la regeneración natural. Se concluye que la introducción de pasto para la ganadería y el desarrollo urbano fueron las principales causas de los cambios de uso de suelo, sin embargo, la industria petrolera asentada en el ecosistema ha fomentado indirectamente el crecimiento urbano y el auge ganadero.
Palabras clave: cobertura de suelo, ecosistemas costeros, deforestación, percepción remota, industria petrolera.The coastal ecosystem of Terminos Lagoon (CETL), located in Campeche, Mexico, is the largest fluvial-lagoon estuarine system in the country. It comprises several ecosystems, including the adjacent continental marine platform, Carmen Island, fresh and saltwater bodies, seagrass, wetlands, fluvial-deltaic systems, mangroves and tropical forests (Yañez-Arancibia & Day 1982). This ecosystem variety provides the Terminos Lagoon with a wealth of natural resources and high biodiversity. Consequently, it is considered as a fishery critical habitat of the Gulf of Mexico, and a refuge for several threatened species. In 1994, the Terminos Lagoon was decreed as a Protected Area for flora and fauna (Yañez-Arancibia et al. 1999, Miranda et al. 2008). The CETL presents a wide mosaic of plants, terrestrial and aquatic associations, with more than 84 families of plants including 374 species. It also presents a great wildlife diversity, with at least 1 468 vertebrate species (terrestrial and aquatic), from which 30 species of amphibians, reptiles, birds and mammals are endemic.
In 1971, the major hydrocarbon deposit in Mexico and one of the largest in the world, Cantarell, was discovered in the marine platform next to Terminos Lagoon. Five years later, activities concerning oil production began in Sonda de Campeche (Sierra 1998). Nowadays, producing 80% of the crude oil and 30% of the natural gas of Mexico, Sonda de Campeche is a crucial place for Mexican oil industry, which is the most important economic activity in the area and has contributed to transform previously rural areas into urban ones. The employment generation attracted people from all over the country, and consequently, urban areas grew rapidly. This development, together with certain economic activities, has increased the exploitation and deterioration of the natural resources of the region (Sanchez- Gil et al. 2004).
The natural and cultural resources of CETL have led to conflicts between the economic sectors that exploit this area. In this regard, the activities of the oil industry are among the most criticized. Given the interest in preserving CETL, several studies have addressed the impact of this industry on the ecosystem. However, the magnitude and complexity of CETL requires new integrated approaches to evaluate and manage this area, with particular emphasis on conservation (Yañez-Arancibia & Day 2004, Rivera-Arriaga & Villalobos 2005, Schifter et al. 2005).
The analysis of land use and land cover allows the temporal and spatial evaluation of the impacts of human activities on ecosystems. This is achieved by measuring the rates of forestation and deforestation, soil degradation, fragmentation, and alterations on community structure. This analysis also provides information about the changes that have occurred, when and where they happened, the rates at which they occurred and the physical and social forces that drove them (Wassenaar et al. 2007).
The studies on land cover changes in the tropics have increased in the last decade, mainly by the contribution of new remote sensors and the information collected by the Geographic Information Systems (GIS). Information from these two sources has allowed more complex analysis (Loughland et al. 2007, Reddy et al. 2007). Besides, data from these sources has been useful to evaluate CETL, allowing the correlation of the information on land cover with socio-economic aspects of the area.
This contribution analyzed the land cover changes in CETL during the three last decades (1974-2001). For this purpose, we determined the deterioration and recovery of main vegetation covers. The temporal changes in land cover were evaluated by analyzing series of classified satellite images, integrated in a GIS.
Materials and methods
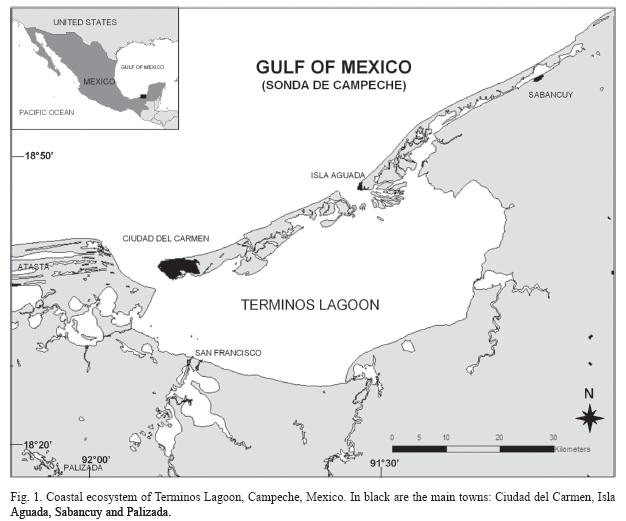
Study site: The study area is located in the Terminos Lagoon in the South-Eastern part of Mexico, between 18o17’-19o06’ N, 91o03’- 92o06’ W, within the Protected Area of Terminos Lagoon (Fig. 1).
The climate includes three main seasons: the winter storm season or "nortes" season from October to January, the dry season from February to May, and the rainy season from June to September. The average annual temperature is 27.2°C, with maximum averages reaching 35.8°C and a minimum annual average of 18.6°C.
In 2000, the study area registered 141 859 inhabitants; the largest towns are Ciudad del Carmen with a population of 126 024 inhabitants, Sabancuy with 5 480 and Isla Aguada with 4 123. Since 1970, population censuses have recorded a large increase and a transformation of rural areas into urban, concentrated in Isla del Carmen and other coastal towns (INEGI 2004).
During the last century, two socio-economical impact periods can be distinguished in the region. Before 1976, the area was characterized by forestry, farming and fishery activities; the population was concentrated in small rural towns with little infrastructure, while Ciudad del Carmen was established as the area socio-political center. The introduction of oil industry in Sonda de Campeche in 1976 transformed rural population to urban and also led to the development of extensive infrastructure (roads, bridges, oil pipelines, among others) to support this industry. Ciudad del Carmen is still the socio-political center of the area and has registered a considerable population and extension increase.
Satellite images: To evaluate the land cover change, we worked with a temporal series of Landsat satellite images which reflect the ecosystem conditions before and after the initiation of the oil activities industry. The first image was obtained with an MSS sensor in February 1974; a second image with a TM sensor in January 1986 and the most recent with an ETM sensor in January 2001.
A post-classification comparison method was used for this study. Thus, the image classification was based on the determination of the main plant communities and land use.
The detection of changes in land cover using multi-temporal images demands high georeference precision. Thus, the 2001 Landsat ETM image was rectified, with an RMS error of less than 1.0 pixel. The other two images, Landsat MSS and TM, were georeferenced to the 2001 image using approximately 45 well distributed ground control points. Pixel size was 30x30m for the Landsat TM and ETM images; Landsat MSS image was resampled to 60x60m.
Spatio-temporal analysis: To establish a spatio-temporal relationship in the classes obtained, and also to enhance the use of the information collected, first we pre-classified the 2001 image with the maximum likelihood classifier (Song et al. 2001). The training camps were generated from different information sources (INEGI 1987, UNAM 2002) and using spectral signature analysis. In order to corroborate the classes, the pre-classification obtained was verified with field work visiting 27 sites.
With the information obtained previously, a second classification was made by applying the maximum likelihood method, using new training camps supported by field work.
After the analysis of 2001 image, we followed the same procedure to classify the 1986 image, but using training camps and classes obtained from the 2001 image, as well as the spectral signatures and image analyses. The same procedure was followed for the 1974 image, but in this case we used the 1986 image as reference, considering the minor resolution of the MSS satellite.
The accuracy of classifications was measured using the confusion matrices approach (Congalton 1991). The 2001 image analysis was performed with the CONABIO vegetation database (CONABIO 2004), resulting in 78 verification points of the classes.
The testing of the other two dates was performed by location and verification of the different classes in aerial photographs taken in 1985 and 1979, using a 1:40 000 scale. None of the analyses had a Kappa index below 0.893.
After classification, the TM and ETM images were resampled to a pixel size of 60x60m for a pixel-by-pixel comparison with the MSS image. By resampling to 60m the change evaluation error decreases (Harris 2003, Serra et al. 2003).
The land cover change analysis was performed using the Temporal Dynamics Code, which compares pixels from classified satellite images (Soto-Galera et al. 2006).
In order to evaluate the presence of oil industry at different covers, the area occupied by the facilities, pipelines, the right-of-way and the maintenance roads were measured. Their location was verified with maps and inventories of this industry (PEMEX 2001) and corroborated with the interpretation of orthorectified aerial photos from 1999, scale 1: 20 000.
Results
Changes in land cover: The land cover analysis distinguished eight classes: 1) mangrove, 2) aquatic vegetation, 3) submerged aquatic vegetation (seagrasses and sea algae), 4) tropical forest, 5) grassland, 6) water, 7) urban and 8) open spaces with little or no vegetation (Oslnv). These groups are consistent with the classification of plant communities for Mexico proposed by Rzedowski (1981). Other classes were not included in the study because they occupied small areas or were extremely fragmented, such as crop lands and coconut palm cultivation.
The areas occupied by each class in 1974, 1986 and 2001 are summarized in Table 1. Tropical forest was the most extensive vegetation class, followed by aquatic and mangrove vegetations. The classes denominated urban and Oslnv accounted for a small percentage of the total area. These two classes were linked since the Oslnv comprises beaches, spaces without vegetation and also semi-urban zones, which were not paved and in which vegetation had been removed only for the construction of modest houses.
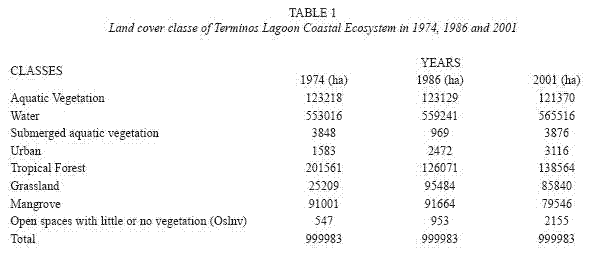
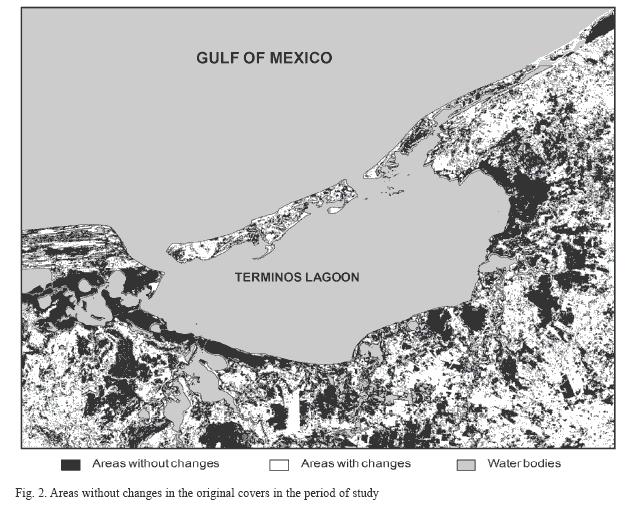
Taking the image from 1974 as a reference, and excluding the class of water bodies (since there was no significant change detected), in 1986 only 55% of the area had the same classification as in 1974. Nevertheless, for 2001 the unchanged areas decreased to 41% (Fig. 2).
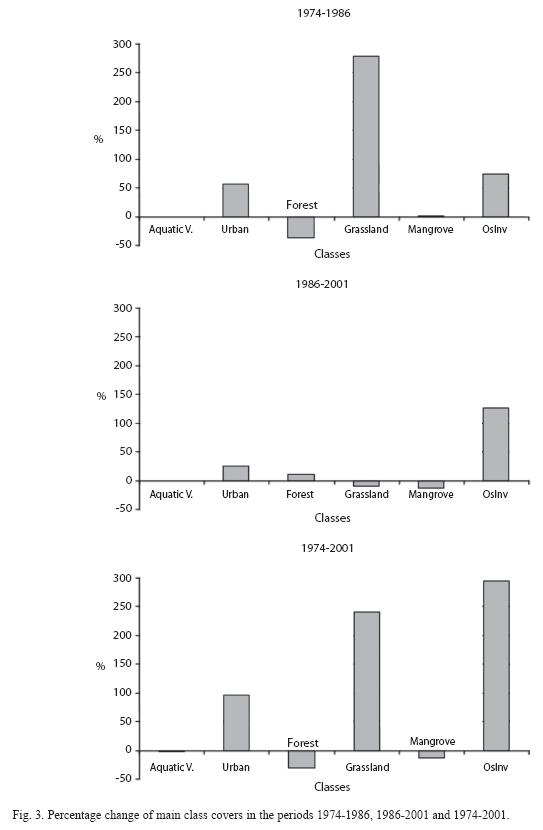
Changes in land cover varied depending on the period and class considered (Fig. 3). Overall, aquatic vegetation showed the least changes (Table 1, Fig. 3).
From 1974 to 2001 aquatic vegetation decreased to 1 850ha, which represents only 1.5% of the original area. In contrast, submerged aquatic vegetation registered great variation when comparing the periods 1974-1986 and 1986-2001; however, the change for the whole period was less than 30ha.
For the terrestrial classes, the most significant changes between 1974 and 2001 were observed in tropical forest (-62 000ha), grassland (+60 000ha), and mangroves (-11 000ha). These values accounted for 31%, 242% and 12% of the area occupied in 1974, respectively (Fig. 3). From 1974 to 1986, tropical forests lost 75 500ha (37% of the area in 1974), while grassland increased about 75 275ha (279% of that in 1974) (Fig. 3). In the same period, mangroves presented a small increase of 600ha (<1%). The period between 1986 and 2001 was characterized by a change in the tendencies described above. Tropical forest recovered about 12 000ha (10% of the area occupied in 1986), and grasslands decreased about 10 000ha (10% of the area occupied in 1986). In addition, deforestation of mangrove led to a loss of 12 000ha (13%).
The urban area showed constant growth (+1 500ha), accounting for 97% of the initial area for the whole period, whereas Oslnv showed the greatest increase, with a rise of almost 300% from 1974 to 2001.
The area directly occupied by the oil industry in CETL accounted for less than 0.1% of the total area, excluding water bodies. The areas, in which facilities like roads and pipelines of this industry are located (in the West and South-West sides of the ecosystem), were formerly covered by mangrove and aquatic vegetation classes in 1974.
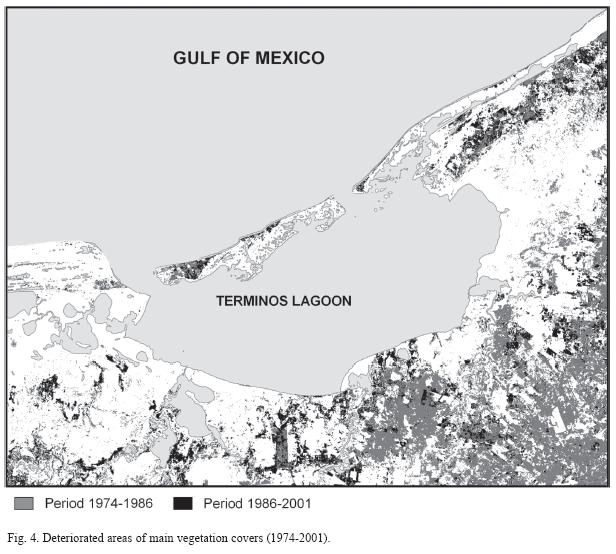
Land cover deterioration and regeneration: The transformation of mangrove, tropical forests and aquatic vegetation into urban areas, induced grassland or Oslnv, represents a deterioration of mature vegetation communities. From 1974 to 1986, 87 281ha were deteriorated, which accounts for 21% of the original cover. From 1986 to 2001, deterioration affected a further 40 339ha. Thus, as a whole, 31% of the area occupied by mature vegetation in 1974 was degraded in 2001 (Fig. 4).
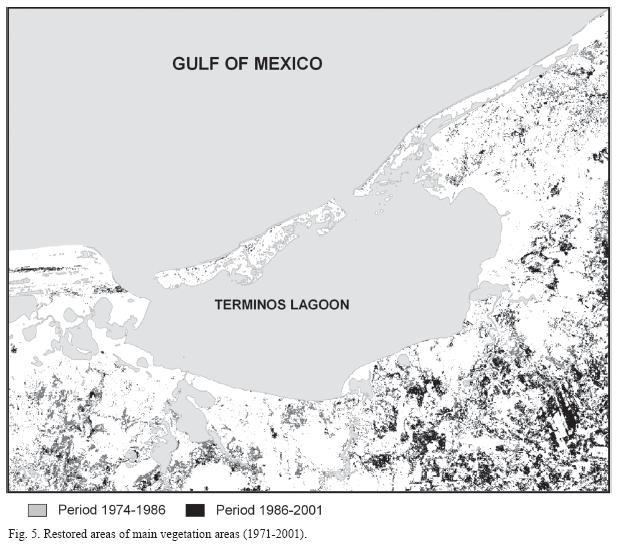
Regeneration in the study area corresponds especially to the transformation of induced grassland into aquatic vegetation, tropical forest or mangrove. According to our data, from 1986 to 2001, 50 829ha were regenerated from the 87 281 that were deteriorated from 1974 to 1986. This represents a regeneration of 58% (Fig. 5). This percentage indicates that the system has a notable recovery capacity. However, data refers only to recovery in terms of occupied area, and not in terms of integrity of plant communities. Regeneration was poor in the northern area of system, where the main human settlements were established. In contrast, in the rural area located in the south-east, regeneration was greater.
Between 1986 and 2001, tropical forest, aquatic vegetation and mangrove recovered 35 000ha, 18 000ha and 800ha from grassland, respectively.
Discussion
The aquatic vegetation and submerged aquatic vegetation classes had the least variation in coverage over the study period. However, the first class is considered a critical habitat in the region, because different species occupy aquatic vegetation for the development of one or more stages of their life cycle (INE 1997). In the case of submerged aquatic vegetation, its extension in the ecosystem had strong variations between the years studied. This dynamic was studied by Ortega (1995), who reported that the spatial distribution of submerged aquatic vegetation in the Terminos Lagoon depends on temperature and salinity, with seasonal and annual variations that directly affect the presence or absence of certain species of phytobenthos.
Globally, the classes that registered the greatest changes are tropical forest, grassland and mangrove. Moreover, the percentage of urban areas and Oslnv increased notably. These findings are consistent with data described by Velásquez et al. (2002) for Mexico. These authors also reported that the land covers with major losses of area were the tropical forests, followed by aquatic vegetation (including mangroves), while farming and induced grassland continue to grow, accounting for 21% of the national territory.
The changes in land cover in CETL can be divided in two periods. The first occurred between 1974 and 1986 and witnessed extensive deforestation, which led to a considerable increase in grassland, urban areas and areas without apparent vegetation. The second period, between 1986 and 2001, showed a recovery in the tropical forest area, with a subsequent loss of pastures; however, mangrove registered the greatest deforestation. Thus, the deterioration of the tropical forest is a consequence of its transformation into grassland and aquatic vegetation, while the causes of mangrove loss are attributed mainly to the development of urban areas and infrastructures and wood exploitation (Soto-Galera et al. 2006).
Our analysis indicates that in 2001 more than a half of CETL had experimented land cover changes from its original area in 1974. A third presented deterioration; however, vegetation, especially tropical forest, showed a good recovery capacity. The area that suffered the most significant degradation was located in the south- east, while the south-west was the best preserved.
In the coastal region, changes in land cover have been caused mainly by the increase of urban areas and the development of infrastructure. In addition, the east and south-east areas showed extensive changes from original covers, and they are characterized by the introduction of grassland for livestock farming.
This pattern is similar to the rain forest deforestation in the Terminos Lagoon reported by Mas et al. (2003). Easier accessibility to the south-east zone may favor livestock activities, which may explain the results observed. In contrast, in the south-west, the main economic activities that may affect the vegetation resources are rice crops and forestry, but these activities are highly localized, and most of this area is submerged and its access is difficult.
The deforestation/forestation process has been documented in different places, for instance on tropical areas of Puerto Rico that have been previously used for agriculture or as cattle-pastures, these tropical areas become dense rain forests after 30 years (Pascarella et al. 2000). In Mexico from 1976 to 2000, it has been estimated that 546 000ha per year suffered deforestation, whereas the recovery of "human-made land cover" to primary vegetation accounted for 156 000ha per year and 127 000ha per year for secondary vegetation (Michalak et al. 2002).
Tropical forest regeneration in the study area is also related to the evolution of livestock activity. Livestock in Mexico started to decline in 1983, decreasing from 37.5 to 30.5 million heads between 1983 and 1984. This decrease was registered yearly until 1994, with the exception of 1986 and 1987.
The new social classes generated in CELT by the oil economy require increased amounts of meat and milk products, thereby promoting local livestock production, with the subsequent deterioration of natural land cover. The oil industry in Mexico is the main source of foreign exchange of economic motor in regions where it is established. However, this industry should be adequately planned and developed in harmony with the ecosystem.
Mexico is facing a severe deterioration of its coastal ecosystems due to economic activities being developed in these areas, including tourism, mining, livestock, urban sprawl, among others (Rivera-Arriaga & Villalobos 2005, Murray 2007). Therefore, it is urgent to pursue sustainable development of Mexican coastal considering a holistic approach in time and space, where the economic value of the resources will be not the only factor to take into account for decision-making.
It can be concluded that CETL presents both deforestation and regeneration processes on its main vegetation communities, all of which are important reserves of flora and fauna. Since 1974 these three covers have registered losses, however, the greatest deforestation has occurred in the tropical forest, which shows 31% loss.
The direct impact of the oil industry on land cover in CETL is insignificant, affecting less than 0.1% of the total area. However, the indirect contribution of this industry is the urban growth and the introduction of grassland for livestock.
The economic development triggered by the oil industry in CETL produced an increased of urban areas and infrastructure. This demand adversely affected natural resources. Moreover, the demand for food by an increased population favored the consumption of the livestock products in the region, which together with the livestock policies of the country were the main causes of the destruction of tropical forest.
Acknowledgments
This research was supported by the Mexican Institute of Petroleum and the Spanish Project VARITEC-SAMPLER (CTM2004-04442-C02-2/MAR).
References
CONABIO. 2004. Sistema Nacional de Información sobre Biodiversidad. México. Comisión Nacional para el Conocimiento y uso de la Biodiversidad, Distrito Federal, México. [ Links ]
Congalton, R.G. 1991. A review of assessing the accuracy of classifications of remotely sensed data. Remote Sens. Environ. 37: 35-46. [ Links ]
Harris, R. 2003. Remote sensing of agriculture change in Oman. Int. J. Remote Sens. 24: 4835-4852. [ Links ]
INE. 1997. Programa de manejo del Área de Protección de Flora y Fauna "Laguna de Términos". Instituto Nacional de Ecología, Secretaria de Medio Ambiente, Recursos Naturales y Pesca, Distrito Federal, México. [ Links ]
Instituto Nacional de Estadística Geografía e Informática (INEGI). 1987. Carta de uso del suelo y vegetación, Ciudad del Carmen esc. 1:250,000 E 15-6. Instituto Nacional de Estadística Geografía e Informática, Aguascalientes, México. [ Links ]
Instituto Nacional de Estadística Geografía e Informática (INEGI). 2004. Archivo histórico de localidades. Aguascalientes, México. [ Links ]
Loughland R.A., P. Saenger, S. Luker, K. Siddiqui , B. Saji, M. Belt & K. Crawford. 2007. Changes in the coastal zone of Abu Dhabi determined using satellite imagery (1972-2003). Aquat. Ecosyst. Health 10: 301-308. [ Links ]
Mas, J.F., H. Puig, J.L. Palacio & A. Sosa. 2003. Un modelo espacial del riesgo de deforestación. In Anais XI SBSR (Belo Horizonte, Brasil). p. 1357-1363. [ Links ]
Michalak, R., S. Kelatwang, A. Velázquez, J.F. Mas, J.L. Palacio-Prieto & G. Bocco. 2002. Forest inventory and assessment: country experiences and needs. Unasylva, FAO, 53: 28- 41. [ Links ]
Miranda, J.R., D. Mouillot, A.S. Lopez, T. Do Chi & D. Hernández. 2008. How much variation can be explained by seasonal, spatial and environmental effects in nekton assemblages of the Terminos Lagoon? Aquat. Conserv. Mar. Freshw. Ecosyst. 18: 508-517. [ Links ]
Murray, G. 2007. Constructing Paradise: The Impacts of Big Tourism in the Mexican Coastal Zone. Coast. Manage. 35: 339-355. [ Links ]
Ortega, M. 1995. Observaciones del fitobentos de la Laguna de Términos, Campeche, México. Anales del Instituto de Biología, Serie Botánica 66: 1-36. [ Links ]
Pascarella, J., T. Aide, M. Serrano & J.K. Zimmerman. 2000. Land-use history and forest regeneration in the Cayey Mountains, Puerto Rico. Ecosystems 3: 217-228. [ Links ]
PEMEX. 2001. Informe 2000. Seguridad, Salud y Medioambiente. Petróleos Mexicanos, México, D.F. [ Links ]
Reddy C., C. Pattanaik & M. Murthy. 2007. Assessment and monitoring of mangroves of Bhitarkanika Wildlife Sanctuary, Orissa, India using remote sensing and GIS. Curr. Sci. India 92: 1409-1415. [ Links ]
Rivera-Arriaga, E. & G. Villalobos. 2005. The coastal zone of Campeche, Mexico: Opportunities for implementing an integrated coastal management framework. J. Coastal Res. 42: 184-190. [ Links ]
Rzedowski, J. 1981. La Vegetación de México. Limusa, Distrito Federal, México. [ Links ]
Sanchez-Gil, P., A. Yañez-Arancibia, J. Ramirez-Gordillo, J. Day & P. Templet. 2004. Some socio-economic indicators in the Mexican states of the Gulf of Mexico. Ocean Coast. Manage. 47: 581-596. [ Links ]
Schifter, I., C. González-Macías, A. Miranda & E. López- Salinas. 2005. Air emissions assessment from offshore oil activities in Sonda de Campeche, Mexico. Environ. Monit. Assess. 109: 135-145. [ Links ]
Serra, P., X. Pons & D. Sauri. 2003. Post-classification change detection with data from different sensors: some, accuracy considerations. Int. J. Remote. Sens. 24: 3311-3340. [ Links ]
Sierra, C.J. 1998. Breve historia de Campeche. México. Fondo de Cultura Económica, Distrito Federal, México. [ Links ]
Song, C., C.E. Woodcock, K.C. Seto, M.P. Lenney & S.A. Macomber. 2001. Classification and change detection using Landsat TM data: When and how to correct atmospheric effects? Remote. Sens. Environ. 75: 230-244. [ Links ]
Soto-Galera, E., J. Piera & P. López. 2006. Temporal dynamics code for land cover and land use analysis. WSEAS Transactions on Environment and Development 5: 483-488. [ Links ]
UNAM. 2002. Uso de Suelo y Vegetación 2000, escala 1:250 000, cobertura preparada para el análisis de cambio de uso del suelo. Instituto de Geografía, Universidad Nacional Autónoma de México, Distrito Federal, México. [ Links ]
Velásquez, A., J.F. Mas, J.R. Díaz-Gallegos, R. Mayorga- Saucedo, P.C. Alcántara, R. Castro, T. Fernández, G. Bocco, E. Ezcurra & J.L. Palacio. 2002. Patrones y tasas de cambio de uso del suelo en México. Gaceta Ecológica 62: 21-37. [ Links ]
Wassenaar, T., P. Gerber, P.H. Verburg, M. Rosales, M. Ibrahim & H. Steinfeld. 2007. Projecting land use changes in the Neotropics: The geography of pasture expansion into forest. Global Environ. Chang. 17: 86-104. [ Links ]
Yáñez-Arancibia, A. & J.W. Day. 1982. Ecological characterization of Terminos Lagoon, a tropical lagoonestuarine system in the Southern Gulf of Mexico. Oceanol. Acta 4: 431-440. [ Links ]
Yañez-Arancibia, A., A.L. Lara-Domínguez , J.L. Rojas- Galaviz, D.J. Zárate-Lomeli, G.J. Villalobos-Zapata & P. Sánchez-Gil. 1999. Integrating science and management on coastal marine protected areas in the Southern Gulf of Mexico. Ocean Coast. Manage. 42: 319-344. [ Links ]
Yañez-Arancibia, A. & J.W. Day. 2004. Environmental sub-regions in the Gulf of Mexico coastal zone: the ecosystem approach as an integrated management tool. Ocean Coast. Manage. 47: 727-757. [ Links ]

