


Services on Demand
Journal
Article
 English (pdf)
 Article in xml format
 Article references
 Send this article by e-mail
Indicators
-
 Cited by SciELO
 -
 Access statistics
Related links
-
 Similars in
SciELO
Similars in
SciELO  uBio
uBio
Share

 Permalink
Revista de Biología Tropical
On-line version ISSN 0034-7744Print version ISSN 0034-7744
Rev. biol. trop vol.56 n.3 San José Sep. 2008
An economical non-destructive method for estimating eelgrass, Zostera marina (Potamogetonaceae) leaf growth rates: formal development and use in northwestern
Elena Solana-Arellano1, Héctor Echavarria-Heras1 & Ernesto Franco-Vizcaíno2
1. Departamento de Ecología Marina, Centro de Investigación Científica y Educación Superior de Ensenada, P.O. Box 434844, San Diego CA. 92143-4844, California, USA; esolana@cicese.mx; hechvar@cicese.mx
2. Departamento de Biología de
Abstract: Seagrass beds provide much of the primary production in estuaries; host many fishes and fish larvae, and abate erosion. The present study presents original analytical methods for estimating mean leaf-growth rates of eelgrass (Zostera marina). The method was calibrated by using data collected in a Z. marina meadow at Punta Banda estuary in
Key words: eelgrass, growth rates, analytical estimations.
Seagrass beds are indicators of the status of the coastal zone and can be used in management strategies that aim to preserve or improve environmental quality. Nutrient cycling represents a large proportion of the environmental services performed by estuaries and seagrass beds (Wharton 1970, Gosselink et al. 1974, Costanza et al. 1997). In particular, eelgrass populations provide substantial amounts of organic material to the shallow-water food web, as well as habitat or shelter for many fishes and fish larvae (McRoy 1966).
Sea-surface temperature exerts a strong influence on the dynamics of marine ecosystems (Tegner and Dayton 1987, Baumgartner et al. 1992, Beer and Koch 1996, Holbrook et al. 1997, Johnson et al. 2003). For eelgrass, water temperature drives the accumulation of above ground biomass (Poumian-Tapia and Ibarra-Obando 1999), and is highly correlated with leaf dynamics (Solana-Arellano et al. 1997, Short and Neckles 1999, Solana-Arellano et al. 2004). Sea-surface temperature has been reported to control the seasonal cycle of eelgrass growth (Rasmmussen 1977, Phillips and Backman 1983). There is also a widespread belief that both the distribution and abundance of seagrasses in temperate littoral waters are tightly linked to light availability (Backman and Barilotti 1976, Dennison and Alberte 1982, 1985, 1986, Bulthuis and Woelkerling 1983, Orth and Moore 1983, 1988, Zimmerman et al. 1991, Cabello-Pasini et al. 2002). Data collected at our study site in Punta Banda corroborate that sea surface temperature, light availability and dissolved nutrients are key environmental factors that control leaf dynamics in eelgrass (Solana-Arellano et al. 2004). A principal-component analysis resulted in a highest correlation coefficient for sea-surface temperature (r=0.86), while light radiation also had a high correlation coefficient (r=0.72). Together these two variables explain 49 % of the variability induced by all abiotic variables.
Changes in the global climate are expected to alter sea-surface temperature, underwater light flux, and the availability of dissolved nutrients, and thus may severely affect both the structure and the dynamics of seagrass beds (Cambridge and McComb 1984, Valiela et al. 1992, Peterson et al. 1993, Short and Neckles 1999). In addition to adverse climatic influences, coastal development represents an additional threat to the health and extent of seagrass beds that could result in irreversible alterations. The ecological importance of seagrasses has driven efforts to conserve and expand existing communities, restore lost ones and create new ones. Indeed, several workers have developed various techniques for transplanting seagrass species (Fredette et al. 1985, Fonseca et al. 1986, Lewis 1987, Fonseca et al. 1996).
The disruptive effects of coastal development are evident in many estuaries and salt marshes throughout adjacent southern
Data on structural and dynamical aspects of vegetation in re-established wetlands are required to provide evidence that restoration efforts have met predefined goals. The rate of change for leaf length in Zostera marina has been considered as a response variable to environmental influences (Jacobs 1979, Phillips and Backman 1983, Short and McRoy 1984). The leaf architecture of Z. marina makes length a determinant of both leaf area and weight (Solana-Arellano et al. 2003). Hence the characterization of the corresponding leaf-growth rates provides valuable ecological information.
Studies on leaf dynamics of seagrasses have generally been descriptive (Sand-Jensen 1975, Jacobs 1979, Ott 1980, Aioi et al. 1981, Umebayashi 1988, Aioi and Pollard 1993). Methods for the analytical assessment of leaf growth are scarce in the literature. The first analytical study on growth rates for sea grasses was developed by Patriquin (1973), who proposed a linear model for the mean growth rate of previously marked shoots of Thalassia testudinum. Solana-Arellano et al. (1997) studied the dynamics of leaf growth rates for Z. marina through a generalization of the monomolecular model.
Due to seasonality effects, the study of representative variables of leaf dynamics in Z. marina demands extensive sampling during the entire yearly cycle. Traditional methods for the assessment of eelgrass leaf-growth rates require tedious leaf-marking techniques and time-consuming laboratory work. These procedures can induce high shoot loss, particularly in restored areas. In the present study we introduce analytical tools for the estimation of mean leaf-growth rates and their associated uncertainties. The results show that these indirect assessments produce consistent outcomes for both natural and transplanted eelgrass populations at our study site.
Materials and methods
Study site: the data used to calibrate the analytical method developed in this paper were collected biweekly from January through December
Field laboratory and statistical methods: following a complete random sample design, we marked 20 shoots during each sampling date, using the technique of Kentula and McIntire (1986). After two weeks, we harvested the previously marked shoots and marked a new set of 20 shoots. The samples were taken to the laboratory where measurements of length (mm), width (mm), and dry weight (g) were made on each leaf. Individual mean leaf-growth rates, expressed as mm d-1, were calculated by dividing leaf elongation by the number of days of growth. We collected a total of 600 shoots and 2 263 complete leaves for the analysis. Curve fittings were made by using non-linear regression in the statistical package STATISTICA (1999).
The analytical mean leaf-growth rate projection method: for the constructs presented throughout this work, the following definitions and notations are required. Let l(t) be the length of a Z. marina leaf at time t. The number of Z. marina leaves contained in a shoot sample taken at time ti with t0 ≤ ti ≤ tF will be denoted by N(ti ). For j = l,
N(ti ) let lj(ti) stand for the length of the jth leaf in the sample. The symbol α l(ti) will denote the expected value of lj(ti) over the distribution of leaf lengths. The corresponding variances will be denoted by means of β2l(ti). Similarly  (ti , ti+1) will stand for the time increment (ti+1 -ti), while the symbol lj (ti , ti+1) will denote the leaf length increment (lj(ti+1) - lj(ti)). Thus, for the jth leaf, the mean leaf growth rate (MLGR) over the interval (ti , ti+1) is defined by,
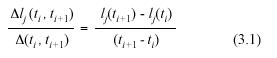
The expected value over the associated variation range of these MLGR will be denoted by the symbol αrl (ti , ti+1). Correspondingly, the variance of these MLGR in equation (3.1) will be represented by means of the symbol β2rl (ti , ti+1).
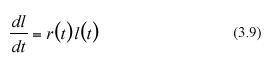
Suppose that a leaf survives the deleterious effects of drag forces or herbivory. Then its growth could take place continuously over a suitable period of time. Therefore, it is reasonable to assume that there exists a longitudinal asymptotic maximum size l∞, which is the maximum length attained in the limit when time approaches infinity. This is a standard assumption in growth models (Von Vertalanffy 1957, Richards 1959, Seber and Wild 1988), and corresponds to a simplification that can be tested by empirical validation. Solana-Arellano et al. (1997) used this framework and demonstrated that leaf dynamics in Z. marina could be modeled through a generalization of the traditional monomolecular model. They demonstrated that the associated asymptotic specific-growth rate can be expressed as an environmental forcing function of temperature, underwater light flux, and dissolved nutrients. In this section, we will also invoke the monomolecular growth assumption, and use it to derive an original analytical method for the projection of the pertinent MLGR values. We assume that l(t) can be modeled by means of the equation
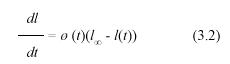
where ø(t) stands for an environmental forcing factor. Separation of variables and integration from ti to ti+1 produces the equivalent equation,
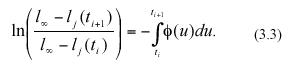
Taking exponentials on both sides and rearranging we have,
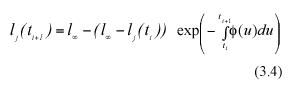
Subtracting lj(ti) from both sides of equation (3.4), we get an analytical representation for the individual MLGR in equation (3.1). It becomes,
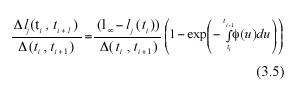
Obtaining the expected value on both sides of the above equation will produce analytically determined values for α rl (ti , ti+1), these will be expressed in terms of α l(ti), the expected value of leaf length at a time ti , the asymptotic length l∞ and the scaling function ø(t). Formally,
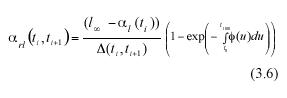
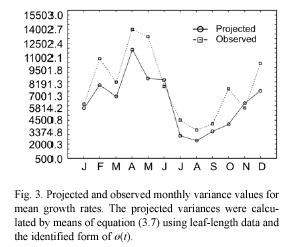
By a direct calculation of the variance on both sides of equation (3.5) we get an expression of β2rl (ti , ti+1), which represents the projected variance for the MLGR over the interval ti < t< ti+1. It becomes,
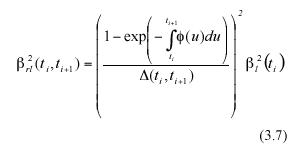
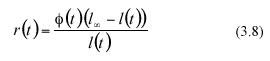
The analytically defined values of equation (3.6) and (3.7) are based on both the α l(ti) data and on the values that the scaling factor (3.13) ø(t) attains at each sampling time ti Directly obtained leaf-length values determine sample values for al(ti). We will propose a method to estimate the factor ø(t) which can be identified by means of standard regression procedures, using leaf length data. To obtain that device, we observe that if we define a continuous function r(t) through the expression
then equation (3.2) can be reparametrized into the form
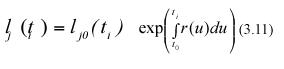
Then separation of variables and integration from t0 to ti+1 yields for the jth leaf in a sample
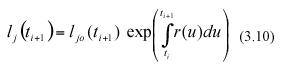
where lj0(ti+1) stands for the length that the jth leaf in the sample taken at time ti+1 had at the initial sampling time t0. Similarly, integration from t0 to ti produces,
Form the above equations, mathematical expectation gives
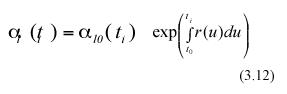
and
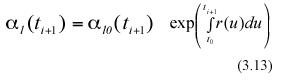
In the above equations α l0(ti) and α l0(ti+1) represent the expected values of the random variables lj0(ti) and lj0(ti+1) respectively. Combining equation (3.12) and (3.13) we get,
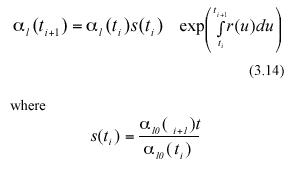
Following Charles-Edwards et al. (1986) and Solana Arellano et al. (1997), we can assume that seasonal influences on leaf growth induce a periodic behavior for the functions s(t) and r(t). These functions can be approximated by means of trigonometric polynomials (cf. equation (5.9.10) in Batschelet (1974)). Formally, r(t) and s(t) can be assumed to have the empirical form,
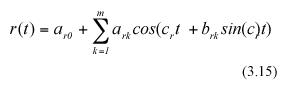
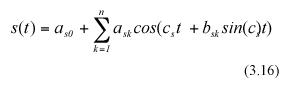
where c and c as well as ark , ask, and bsk for k=0,1,....m or n are parameters, with m, and n being the orders of the trigonometric polynomials under consideration.
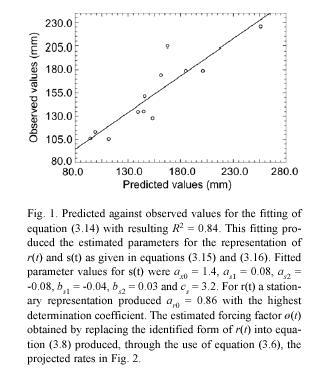
These projection procedures can be summarized in the following steps. We first obtain an estimate for the maximum asymptotic length directly from observations. That is, we assume that l∞ is represented by the maximum value that l(t) has attained over a long period of observations. Then, we assume that r(t) and s(t) are given by trigonometric polynomials (cf. equations (3.15) and (3.16)), and perform the fitting of the resulting equation (3.14) by using values for al(ti) determined from samples. This will provide an identified form for r(t) and through the use of equation (3.8) we can obtain an estimate of ø(t). We then use these estimations, along with the values for α l(ti) determined from samples to produce, by means of equation (3.6), the corresponding projected average MLGR values. The associated projected variances β2rl (ti , ti+1) are given by the pertinent procedures defined by equation (3.7).
Results
Projected mean leaf growth rate values: for the projection of MLGR we used a maximum leaf length of
Application to an independent data set: Cabello-Pasini et al. (2002) evaluated the effects of storms on photosynthesis, carbohydrate content and survival of seagrass at Punta Banda estuary and estimated a value of 4.8±0.8% d-1 as the average specific leaf-growth rate. Using their leaf-length data and the estimated form of the environmental factor ø(t) determined from our data, we projected the corresponding MLGR through equation (3.6) and obtained a specific growth rate of 4.2±
Application to transplanted plot data: the projection method was also used to estimate MLGR for an experimental transplant at our study site. Removal of shoots was necessary four months after planting due to an infestation of the bryozoan Zoobotrion verticillatum which dramatically reduced light availability in the water column (Solana-Arellano et al. 2002). Using the fitted form of ø(t) and the corresponding average leaf length, we projected a mean leaf growth rate of
Discussion
Most of the methods used to study growth and production in marine phanerogams are expensive, time consuming, and require destructive techniques such as leaf marking (Sand-Jensen 1975, Jacobs 1979). Excessive manipulation of raw material also increases the error introduced into the data (Mandel 1964). Our indirect estimations, which we call analytical projections, are based on measurements of leaf length and a scaling factor associated with environmental forcing. This factor can be obtained directly from observed leaf-length data using regression procedures. Hence, the resulting characterizations can reduce research expenses by simplifying assessment techniques.
The analytical assessment method introduced here was adapted from the model of equation (3.2), which has the advantage of linearity (i.e, the individual leaf growth rates depend linearly on leaf length). This property assures that the asymptotic growth assumption is maintained for the corresponding averages. Another feature of the linearity in equation (3.2) is its implied structural stability. That is, small perturbations in either the forcing function ø(t) or the parameter l∞ will produce small deviations in the projected MLGR values.
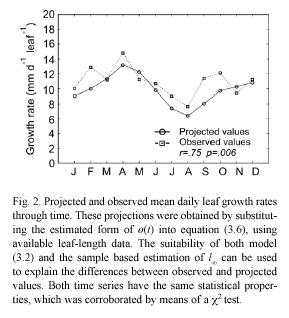
The deviations between projected and observed values in Fig. 2 can be explained in terms of both the determination coefficient of the fitting and also on the suitability of the estimated value for l∞. Whenever the fitting of equation (3.13) fails to be robust, and the estimation of l∞ is not representative of its true value, equation (3.8) will fail to produce realistic values for the forcing factor ø(t). In those cases, the projection is not expected to represent the general properties of the observed time series. Our analytical method is thus highly sensitive to the adequacy of the asymptotic growth assumption of model (3.2). Moreover, the sampling design must provide a representative stream of leaf-length data, which is crucial for a sound identification of the asymptotic length. Thus, the time-scale of observation is an important issue for the identification task and for the reduction of degrees of freedom. These provisions should afford a sound basis for the identification of both l∞ and the environmental scaling factor ø(t).
Because Z. marina shoots are renewed about once a year (Olesen and Sand-Jensen 1994), this time span of observations provides for the proper estimation of the asymptotic length, as well as sufficient data for the fitting of equation (3.14). To achieve this step, we relied on data for whole leaves as required by the asymptotic growth assumption. Although incomplete leaves could be used to measure elongation between sampling dates, and therefore provide an accurate statistic of mean leaf-growth rate, this will fail to identify the size of the leaf relative to the asymptotic length in an unambiguous way. This is a fundamental entry in all asymptotic growth models, since the closer the leaf is to the asymptotic length, the smaller its growth rate is expected to be. Further, Ibarra-Obando and Boudouresque (1994) and Ibarra-Obando et al. (1997) have stated that the use of whole leaves should allow a better identification of seasonal trends, which affect leaf growth and shoot morphometrics in eelgrass. Hence, it was assumed that the use of whole leaves permitted a more realistic characterization of the environmental forcing factor r(t).
The observed time series of mean leaf-growth rates is a sample path of an underlying causal stochastic process (Hoel et al. 1972). In that sense, the projected time series must have the same statistical properties, including the same expected value, over the whole sample space. To test this we performed a X2 test, which indicated no significant differences between observed and projected values. We also found a remarkable consistency in the projected value for the annual average rate of leaf growth, which was virtually the same as the one
we calculated from field data. Moreover, using leaf-length data in Cabello-Pasini et al. (2002), we projected the corresponding specific growth rates and found a good correspondence with the mean reported by those workers. The application of our projection method to the transplant experiment data in Solana Arellano et al. (2002) permitted us to obtain a non-destructive characterization of the associated MLGR and to infer about differences in growth parameters between the transplanted and the natural populations. This provides another example of the advantages of the method for indirect estimation methods presented here.
Hence, we conclude that our indirect estimation method is expected to be particularly useful for protected or transplanted areas where the effects of sampling could be deleterious. For natural populations where the effect of sampling may not be an issue, our constructs could simplify the traditional estimation procedures based on leaf marking techniques. Moreover, our method could be successfully applied to other seagrass species which have leaf growth dynamics similar to eelgrass, where leaf width can be considered as roughly constant after an initial growth stage.
Since Z. marina is a temperate-climate species, it is reasonable to expect that values of standing-stock variables will be higher during
For leaf turnover, Ibarra-Obando et al. (1997) reported a value of 9.7 yr-1. Other authors have found similar values in other eelgrass populations (
Global climate change is expected to result in reduced productivity of seagrasses because of higher sea-surface temperatures. Moreover, accelerating economic development along the coastline of the US-Mexico border region assures continued human impacts on seagrass communities. The importance of these ecosystems will certainly promote restoration efforts, and the monitoring of such projects will require the design of cost-effective and non-destructive procedures (Phinn et al. 1999). This paper is aimed at contributing towards that objective.
Acknowledgments
This paper is part of the research on eelgrass production partially funded by the Mexican National Council on Science and Technology (CONACYT) through grant 26665 B. We thank Olga Flores-Uzeta and Cecilia Leal- Ramirez for their technical assistance and José Ma. Dominguez and Francisco Ponce for the fine art work.
Resumen
Las praderas de pastos marinos abaten la erosión y aportan gran parte de la productividad primaria de los esteros y son refugio de muchos peces y sus larvas. El presente trabajo introduce métodos analíticos para estimar las tasas medias de crecimiento foliar de Zostera marina L. y sus varianzas. La calibración del método se llevó a cabo utilizando datos de una pradera de esta fanerógama en el Estero de Punta Banda Baja California, México. Las referidas estimaciones analíticas, se basan en medias de longitud foliar y en procedimientos estandarizados de regresión. Dichas determinaciones son por ende no-destructivas. Se proporciona una explicación detallada de los aspectos formales de la derivación del método. El valor promedio observado de la tasa media diaria de crecimiento foliar fue de
Palabras clave: Zostera marina, tasa de crecimiento foliar, estimaciones analíticas.
Received 21-VI-2006. Corrected 30-VI-2008. Accepted 31-VII-2008.
References
Aguilar-Rosas, R. 1980. Algas bentónicas y fanerógamas del estero de Punta Banda Baja California durante verano y otoño. Licentiate thesis, Universidad Autónoma de Baja California, Ensenada, Baja California, Mexico. [ Links ]
Aioi, K., H. Mukai,
Aioi, K. & P.C. Pollard. 1993. Biomass, leaf growth and loss rate of the seagrass Syringodium isoetifolium on
Backman, T.W. & D.C. Barilotti. 1976. Irradiance reduction: effects on standing crop of the eelgrass Zostera marina in a coastal lagoon. Mar. Biol. 34: 33-40. [ Links ]
Baumgartner, T.R., A. Soutar & V. Ferreira-Bartrina. 1992. Reconstruction of the history of Pacific sardine and northern anchovy populations over the past two millennia from sediments of the Santa Barbara Basin, California. CalCOFI Rep. 33: 24-40. [ Links ]
Batschelet, E. 1974. Ordinary differential equations, p. 305-
Beer, S. & E.W. Koch. 1996. Photosynthesis of marine macroalgae and seagrasses in globally changing CO2 environments. Mar. Ecol. Prog. Ser. 41: 199-204. [ Links ]
Bulthuis, D.A. & W.J. Woelkerling. 1983. Seasonal variations in standing crop, density and leaf growth of the seagrass Heterozostera tasmanica, in
Cabello-Pasini, A. 1984. Transplantes de Zostera marina L. en el estero de Punta Banda, Baja California Mexico, durante el verano de 1983 y su comportamiento a través de otoño e invierno. Licentiate thesis, Universidad Autónoma de Baja California, Ensenada, Baja California, Mexico. [ Links ]
Cabello-Pasini, A., C. Lara-Turrent & R.C. Zimmerman. 2002. Effect of the storms on photosynthesis, carbohydrates and survival of eelgrass populations from a coastal lagoon and the adjacent open sea. Aquat. Bot. 74: 149-164. [ Links ]
Charles-Edwars, D.A., D. Doyle & G.M. Rimmington. 1986. Modeling Plant Growth and Development, Academic Press,
Costanza, R., R. dArge, R. de Groot,
Dennison, W.C. & R.S. Alberte. 1982. Photosynthetic response of Zostera marina L. (eelgrass) to in situ manipulations of light intensity. Oecologia 55: 137-144. [ Links ]
Dennison, W.C. & R.S. Alberte. 1985. Role of daily light period in the depth distribution of Zostera marina L. (eelgrass). Mar. Ecol. Prog. Ser. 25: 51-61. [ Links ]
Dennison, W.C. & R.S. Alberte. 1986. Photoadaptation and growth of Zostera marina L. (eelgrass) transplants along a depth gradient. J. Exp. Mar. Biol. Ecol. 98: 265-282. [ Links ]
Fonseca, M.S., W.J. Kenworthy & G.W. Thayer. 1986. Restoration and management of seagrass systems: a review, p 1-
Fonseca, M.S., D.L. Meyer & M.O. Hall. 1996. Development of planted seagrass beds in Tampa Bay, Florida, USA. II. Faunal components. Mar. Ecol. Prog. Ser. 132: 141-156. [ Links ]
Fong, P. & J.B. Zedler. 2000. Sources, sinks, and fluxes of nutrients (N+P) in a small highly urban estuary in southern
Fredette, T.J., M.S. Fonseca, W.J. Kenworthy & G.W. Thayer. 1985. Seagrass transplanting: ten years of U.S. Army Corps research, p. 1-
Gosselink, J.G., E.P. Odum & R.M. Pope. 1974. The value of the tidal marsh. P1-30. Publ. No. LSUSG-4-03. Center for Wetland Resources,
Holbrook, S.J., R.J. Schmitt & J.S. Stephens. 1997. Changes in an assemblage of temperate reed fishes associated with a climate shift. Ecol. Appls. 7: 1299-1310. [ Links ]
Hoel, P.G.,
Ibarra-Obando, S.E. & R. Huerta-Tamayo. 1987. Blade production of Zostera marina L. during the summer-autumn period on the pacific coast of
Ibarra-Obando, S.E. & C.F. Boudouresque. 1994. An improvement of the Zieman leaf marking technique for Zostera marina growth and production assessment. Aquat. Bot. 47: 293-302. [ Links ]
Ibarra-Obando, S.E., C.F. Boudouresque & M. Roux. 1997. Leaf dynamics and production of a Zostera marina bed near its southern limit. Aquat. Bot. 58: 99-112. [ Links ]
Jacobs, R.P.W.M. 1979. Distribution and aspects of the production and biomass of eelgrass, Zostera marina L., at
Johnson, M.R., S.L. Williams, C.H. Lieberman & A. Solbak. 2003. Changes in the abundance of the seagrasses Zostera marina L. (eelgrass) and Ruppia maritima L. (widgeongrass) in
Lewis, R.R. III. 1987. The restoration and creation of sea-grass meadows in the southeastern
Linding-Cisneros, R. & J.B. Zedler. 2000. Restoring urban habitats: A comparative study. Ecol. Rest. 18: 184-192. [ Links ]
Mandel, J. 1964. Some principles of sampling, p. 224-
McRoy, C.P. 1966. The standing stock and ecology of eelgrass (Zostera marina) in Izembek Lagoon
Olesen, B. & K. Sand-Jensen. 1994. Biomass-density patterns in the temperate seagrass Zostera marina. Mar. Ecol. Prog. Ser. 109: 283-294. [ Links ]
Orth, R.J. & K.A. Moore. 1983.
Orth, R.J. & K.A. Moore. 1988. Distribution of Zostera marina L. and Ruppia maritima L. sensu lato along depth gradients in the lower
Ott, J. 1980. Growth and production in Posidonia oceanica (L.) Delile. Mar. Ecol. 1: 47-64. [ Links ]
Patriquin, D.G. 1973. Estimation of growth rate, production and age of the marine angiosperm, Thalassia testudinum. Mar. Biol. 15: 35-46. [ Links ]
Peterson, C.H., R.T. Barber & G.A. Skilleter. 1993. Global warming and coastal ecosystems response: How Northern and Southern hemispheres may differ in the
Phillips, R.C. & T.W. Backman. 1983. Phenology and reproductive biology of eelgrass (Zostera marina L.) at Bahia Kino,
Phinn, S.R., D.A. Stow & D. Van Mouwerik. 1999. Remotely sensed estimates of vegetation structural characteristics in restored wetlands,
Poumian-Tapia, M. & S.E. Ibarra-Obando. 1999. Demography and biomass of the seagrass Zostera marina in a Mexican coastal lagoon. Estuaries. 22: 837-847. [ Links ]
Rasmmussen, E. 1977. The wasting disease of eelgrass (Zostera marina) and its effects on environmental factors and fauna. In C.P. McRoy, C. Helffrich & M. Dekker (eds.). Creation of seagrass beds. Seagrass ecosystems,
Richards, F.J.
Sand-Jensen, K. 1975. Biomass net production and growth dynamics in an eelgrass (Zostera marina) population in
Seber, G.A.F. & C.J. Wild. 1988. Nonlinear regression. John Wiley and Sons,
Short, F.T. & H.A. Neckles. 1999. The effects of global climate change on seagrasses. Aquat. Bot. 63: 169-196. [ Links ]
Short, F.T. & C.P. McRoy. 1984. Nitrogen uptake by leaves and roots of the seagrass Zostera marina L. Bot. Mar. 27: 547-555
Solana-Arellano, E., H. Echavarria-Heras & S.E. Ibarra-Obando. 1997. Leaf size dynamics for Zostera marina L. in San Quintin Bay, Mexico: A theoretical study. Estuar. Coast. Shelf Sci. 44: 351-359. [ Links ]
Solana-Arellano, E., D.J. Borbon-Gonzalez & H. Echavarria-Heras.
Solana-Arellano, E., H. Echavarria-Heras & O. Flores-Uzeta. 2000. An upgraded method to relocate marked shoots of the seagrass Zostera marina. Rev. Biol. Trop. 48: 927-930. [ Links ]
Solana-Arellano, E., H. Echavarria-Heras, O. Flores-Uzeta & E. Nieto-García. 2002. Experimental transplant of Zostera marina shoots in Punta Banda estuary B.C. México: production parameters and associated benthic fauna. Ocean. East. Pac. 2: 99-105. [ Links ]
Solana-Arellano, E., H. Hechavarría-Heras & M.E. Gallegos-Martínez. 2003. Improved leaf area index based biomass estimations for Zostera marina L.J. Math. Med. Biol. 20: 367-375. [ Links ]
Solana-Arellano, E., H. Echavarria-Heras, M.E. Gallegos-Martínez & O. Flores-Uzeta. 2004. The role of biotic and abiotic variables determining demographic processes in an eelgrass meadow. Bull. South.
Tegner, M. & P. Dayton. 1987. El Niño effects on
Umebayashi, O. 1988. Individual growth of vegetative shoots of eelgrass Zostera marina. Bull. Tokai Reg. Fish. abs.
Valiela, I., K. Foreman, M. LaMontagne, D. Hersch, J. Costa, P. Peckol, B. Demeo-Anderson, C. DAvanzo,
M. Babione, C. Cham, J. Brawley & K. Lajtha. 1992. Coupling of watershed and coastal waters: Sources and consequences of nutrient enrichment in
Von Bertalanffy, L. 1957. Quantitative laws in metabolism and growth. Quart. Rev. Biol. 32: 217-231. [ Links ]
Werner, J.K. & J.B. Zedler. 2002. How sedge meadow soils, microtopography, and vegetation responds to sedimentation. Wetlands 22: 451-466. [ Links ]
Wharton, C.H. 1970. Southern
Zimmerman, R.C., J.L. Reguzzoni, S. Wyllie-Echeverria, M. Josselyn & R.S. Alberte. 1991. Assessment of environmental suitability for growth of Zostera marina L. (eelgrass) in

