


Services on Demand
Journal
Article
 English (pdf)
 Article in xml format
 Article references
 Send this article by e-mail
Indicators
-
 Cited by SciELO
 -
 Access statistics
Related links
-
 Similars in
SciELO
Similars in
SciELO  uBio
uBio
Share

 Permalink
Revista de Biología Tropical
On-line version ISSN 0034-7744Print version ISSN 0034-7744
Rev. biol. trop vol.56 n.2 San José Jun. 2008
Mapping tropical dry forest habitats integrating Landsat NDVI, Ikonos imagery, and topographic information in the Caribbean Island of Mona
Sebastián Martinuzzi1,2,3, William A. Gould2, Olga M. Ramos Gonzalez2, Alma Martinez Robles4, Paulina Calle Maldonado4, Néstor Pérez-Buitrago4 & José J. Fumero Caban4
1. Geospatial Laboratory for Environmental Dynamics (GLED), College of Natural Resources, University of Idaho, ID 83844-1135, Moscow, Idaho, United States; smartinuzzi@vandals.uidaho.edu
2. USDA Forest Service International Institute of Tropical Forestry (IITF), Jardín Botánico Sur, 1201 Calle Ceiba, Río Piedras, 00926-1119, Puerto Rico.
3. Universidad Nacional de La Plata–Laboratorio de Investigación de Sistemas Ecológicos y Ambientales (LISEA), Diagonal 113 No 469 2do. Piso (1900), La Plata, Argentina.
4. CREST-Center for Tropical Applied Ecology and Conservation, University of Puerto Rico, San Juan, 00931-3341, Puerto Rico.
Abstract: Assessing the status of tropical dry forest habitats using remote sensing technologies is one of the research priorities for Neotropical forests. We developed a simple method for mapping vegetation and habitats in a tropical dry forest reserve, Mona Island, Puerto Rico, by integrating the Normalized Difference vegetation Index (NDvI) from Landsat, topographic information, and high-resolution Ikonos imagery. The method was practical for identifying vegetation types in areas with a great variety of plant communities and complex relief, and can be adapted to other dry forest habitats of the Caribbean Islands. NDvI was useful for identifying the distribution of forests, woodlands, and shrubland, providing a natural representation of the vegetation patterns on the island. The use of Ikonos imagery allowed increasing the number of land cover classes. As a result, sixteen land-cover types were mapped over the 5 500 ha area, with a kappa coefficient of accuracy equal to 79 %. This map is a central piece for modeling vertebrate species distribution and biodiversity patterns by the Puerto Rico Gap Analysis Project, and it is of great value for assisting research and management actions in the island. Rev. Biol. Trop. 56 (2): 625-639. Epub 2008 June 30.
Key words: tropical dry forests, Landsat, NDvI, Ikonos, vegetation mapping, topography, Puerto Rico, Caribbean.
Tropical dry forests are one of the most threatened ecosystems in the world (Murphy and Lugo 1986, Jansen 1998). With the urgent need for monitoring and conservation strategies, the assessment of tropical dry forests using geospatial technologies has become a research priority (Sánchez-Azofeifa et al. 2005). Current efforts include (1) developing remote sensing techniques for evaluating extent, structure, and composition of forest types and general vegetation (Innes and Koch 1998, Sanchez-Azofeifa et al. 2003, Turner et al. 2003, Southworth 2004, Feeley et al. 2005), and in places such as the Caribbean, (2) mapping land cover and habitats for conservation and management of biodiversity, and (3) assessing biodiversity patterns distribution (e.g. Mesoamerican and Caribbean Geospatial Alliance, Ecoregional Assessment of the Greater Caribbean Basin, Puerto Rico Gap Analysis).
The Caribbean island of Mona, between Puerto Rico and Hispaniola, is an important area for scientific research of tropical dry forests and part of the biodiversity hotspots of the world (Myers et al. 2000). The diversity of plant communities, the absence of human settlements, the governmental protection, and the high concentration of endemic species and subspecies of plants and animals make Mona a valuable study region for the scientific community (Wiewandt 1979, Raffaele 1973, Cintron and Rogers 1991, Trejo Torres and Ackerman 2002, Melendez-Ackerman et al. 2005). The island is a Wildlife Refuge of 5 500 ha managed by the Puerto Rico Department of Natural and Environmental Resources. Although various efforts have mapped vegetation in Puerto Rico (Ramos and Lugo 1998, Helmer et al. 2002), the island of Mona has been typically excluded. As a result, the only available land cover map is one based on visual interpretation of aerial photographs from the 1960s and 70s (Cintron and Rogers 1991).
The primary objective of this paper is to develop a new land cover map of Mona island using recent 30-meter Landsat ETM+ (Enhanced Thematic Mapper Plus) imagery. This product will be included in a major Landsat-based land cover map of Puerto Rico, and will be used for modeling vertebrate species distribution and biodiversity patterns for the Puerto Rico Gap Analysis Project (PR-Gap) (Gould et al. 2007).
Materials and mehods
Study area and land cover classification: the island of Mona (18º0308" N, 67º5157" W), in the subtropical dry forest life zone (Holdridge 1967), is a tectonically uplifted carbonate island of 55 km2 that forms a plateau, which tilts gently to the south and is bounded by near vertical cliffs on all sides. Along the southeastern and western side, a 3 to 6 m high fossil reef abuts the base of the cliff to form a narrow coastal plain (Frank et al. 1998). The mean annual temperature is 25ºC, with small seasonal variation. About 800 to 950 mm of rainfall occurs mostly between August and November. Winds blow strongly from the eastnortheast during most of the year.
The vegetation of Mona is primarily influenced by changes in macro and micro-relief, and by an east-west ocean salt-spray effect (Cintrón and Rogers 1991). Previous research identified a total of ten plant communities, distinguishing the plateau, coastal plain, and cliffs (Cintrón and Rogers 1991) (Table 1). Ninety percent of the island consists of a plateau covered by a semideciduous shrubby association of small trees. This "plateau forest" has its greatest canopy density to the west, but gradually opens, and changes to tall shrubs, low shrubs and cactus to the east (Cintrón and Rogers 1991). Additionally, the plateau is interspersed by small patches of dense forest located in sinks or depressions. The remaining ten percent of the island consists of cliff-side and coastal vegetation (Cintrón and Rogers 1991).
For the purpose of this paper we classified the islands landscape based on the PR-Gap Land Cover Classification schema (Gould et al. 2007). We identified sixteen land cover classes for Mona (Table 2). The main differences with previous Cintrón and Rogerss (1991) vegetation classification reside in (1) separating the original "plateau forest" into two classes: semideciduous forest (for the closed-canopy forest) and woodland (for the open-canopy forest), (2) adding the grasses as a new class, which include part of the previous "disturbed/successional" class, (3) adding three classes of non-vegetated surfaces in order to identify the built-up areas and two types of shorelines (sandy beaches, and rocky coasts and cliffs), (4) combine the "coastal lowland open forest" with the narrow "coastal shrub" (impossible to map at the Landsat resolution of 30 m) into a major class "coastal lowland woodland and shrubland", (5) combine the two forest plantations (mahogany and casuarinas) into the "abandoned dry forest plantations", and (6) separating the single cliffside vegetation into "cliffside forest" and "cliffside woodland and shrubland".
Remote sensing challenges in Mona Island: the biggest challenge for mapping the land cover in Mona resides in capturing the great variability in plant communities and canopy closure that occurs in the island, particularly in the plateau. In previous effort, West-East gradients in canopy closure were described but not mapped, and identification of boundaries separating shrubs from open forest, or shrubs from low shrubs and cactus, was problematic due to its natural difficulty in being established visually (Cintrón and Rogers 1991). The development of vegetation indices from satellite images, on the other hand, have facilitated the process of differentiating and mapping vegetation by providing valuable information about structure and composition. In tropical dry forests, the Normalized Difference Vegetation Index (NDVI) from Landsat has demonstrated to be an indicator of overall green biomass, canopy closure, tree density, and tree species diversity (Oza et al. 1996, Sanches-Aofelia et al. 2003, Krishnawsamy et al. 2004, Feeley et al. 2005), and thus, it seems a promising tool for studying the vegetation of Mona. NDVI capitalizes on the strong energy absorbed by the chlorophyll in the red portion of the electromagnetic spectrum (RED), and on the energy scattered by the internal struc ture of leaves in the near-infrared (NIR), and uses this contrast as an estimate of vegetation greenness, by the formula: NDVI=(NIR–RED)/ (NIR+RED) (Rouse et al. 1974). The result is an image with a continuum of pixel values that range from –1 to 1. In general term, negative values correspond to non-vegetated surfaces, while positive correspond to vegetated ones, although the lower NDVI values for vegetation usually start in 0.2-0.3. In areas where vegetation canopies do not achieve complete cover age, the NDVI is susceptible to the spectral influence of the soil, giving the possibility of uncertainties in interpretation (Peters and Eve 1995). However, this effect can also increase the length of the gradient of NDVI of certain vegetated surfaces, and could potentially improve a promising tool for studying the vegetation of the separation of land cover classes along this gradient. A collection of NDVI samples that reflects the variations in canopy closure and vegetation coverage might help elucidate the implication of those uncertainties.
Another problem for mapping tropical vegetation using satellite data is the spectral confusion, in which more than one vegetation type shows similar spectral responses. Segmenting the image into regions with potentially different vegetation using variables such as topography, temperature, rainfall, substrate, etc, has shown its value for alleviating this problem (Vogelman et al. 1998, Helmer et al. 2002). In the case of Mona, relief is the principal variable explaining the distribution of the plant communities (Cintron and Rogers 1991).
Finally, even though the small size of the island, the complex landscape of Mona makes difficult to acquire abundant field information in order to validate the products derived from remote sensing. Such "ground-truth" information might come from higher-resolution remote sensing data, such as aerial photography, videography, or satellite imagery (Turner et al. 2003). Ikonos is a globally consistent high-resolution available imagery that provides useful information to validate remote sensing products (Morisette 2003), making possible to characterize the landscape at 1- to 4-m spatial resolution, and to discriminate individual trees and broad vegetation types in the field (Wulder et al. 2004).
In this paper we evaluate the use of Landsat NDVI, topographic information, and high-resolution remotely sensed data for mapping land cover and habitats on Mona Island, and we evaluated how this technology can be applied to other regions.
Remote sensing data: we used one 30-meter pixel Landsat ETM+ image from September 2000 (WRS 006/47), which correspond to the wet season when leaves are flushed, geometrically corrected, and with a minimum cover of clouds (approximately 40 ha) (Source: US Forest Service). Auxiliary high-resolution imagery included a multispectral 1-meter pixel Ikonos mosaic from 2001, orthorectified with an error of 4 m, and acquired between July 2001 and January 2002 as part of a Governmental acquisition of Ikonos data for all Puerto Rico. As part of the preprocessing steps, we converted the Landsat ETM+ image from radiance to reflectance values and corrected it for atmospheric effects (Chavez 1996). We calculated the NDVI in the Landsat using band 3 (RED)=630-690 nm, and band 4 (NIR)=760-900 nm, by the formula: NDVI=(Band 4–Band 3)/(Band 4+Band 3). We didnt correct the Ikonos imagery for atmospheric effects because we used it as a surrogate for the identification of sites in the field. We estimated the error between the Landsat and the Ikonos imagery by comparing the geographic coordinates of features/pixels that were identifiable in both images, including the lighthouse, an intersection of two trails, and some open areas and rocks. The maximum error was 18 m. We didnt coregister the images because there were only few locations in the Landsat imagery that could serve as reference points; we maintained the original data but we took into consideration the errors. In other places, coregistering the Landsat to the Ikonos might be facilitated by the presence of reference features such as road intersections and buildings that are easy to distinguish in the imagery; but these are not present in Mona.
The date of acquisition for the Landsat image corresponded to two years after hurricane Georges passed over Mona Island, in 1998. This fact, however, was not a problem for our analysis. A study conducted in a similar dry forest in Puerto Rico revealed that hurricane Georges caused low damage to vegetation, mostly related to defoliation that followed a rapid refoliation and abundant sprouting (Van Bloem et al. 2005).
Additional information included a previous vegetation map by Cintrón and Rogers (1991) made by visual interpretation of blackand-white aerial photos from the 1960s and 1970s, and digitized by Ramos (2004) at a scale 1:35.000. ADD structural parameters. We also used a layer of the depression forests developed from the Ikonos as part of ongoing research of vegetation in Mona (Martinez et al. 2005), but we only considered depressions larger than the Landsat pixel. Although Cintrón and Roger (1991) vegetation map did not overlay well with the rest of the data, it was still functional for visually interpreting the vegetation patterns and the topography of the island. Finally, we used the Sensitivity of Coastal and Inland Resources to Spilled Oil Atlas for Puerto Rico (NOAA et al. 2000) to classify the coastal shorelines. Remote sensing analysis was conducted using ERDAS 8.7 software (Leica Geosystems GIS & Mapping LLC).
Vegetation sampling and remote sensing analysis: the methods used in this study can be summarized in three steps: Image segmentation, NDVI sampling, and NDVI analysis (Fig. 1).
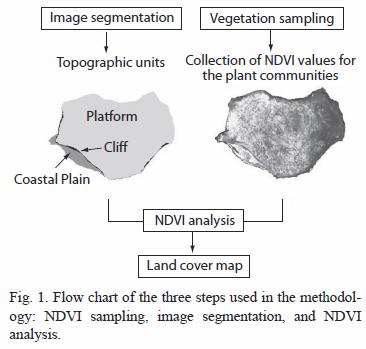
First, we segmented the island into regions with distinctive groups of vegetation. For this, we developed a map of the landforms of Mona, including the plateau, cliffs, and coastal plain by visual interpretation of the Ikonos imagery and assisted by the previous land cover map from Cintrón and Rogers (1991) (we used this map as a general guide for interpreting the landforms, but the final interpretation and digitalization was conducted on the Ikonos imagery). We previously evaluated the 30-meter digital elevation model (DEM) available for Mona (from USGS), but the resolution was no adequate for capturing the strong topographic changes, over shot distances, that occur in Mona.
Simultaneously, we located circular plots of 30 m diameter (706.5 m2) on the Ikonos imagery based on field knowledge, expert opinion, visual interpretation, and previous vegetation map (Cintrón and Rogers 1991), for the different plant communities present in the island. We used these samples to extract the corresponding NDVI values from the Landsat NDVI. A total of 54 NDVI samples were obtained, 35 in the plateau and 19 in the coastal plain, representing 10 of the 13 plant communities, equivalent to 36.728 m2 (Table 2). We tried to locate the vegetation samples in the center of patches that were large enough to ensure that we captured the same feature in the Ikonos and Landsat, even after the 18 m error. We sampled the vegetation in such a way as to reflect the internal variability in canopy closure. Some small vegetation classes allowed for the location of only two or three plots. We couldnt sample the cliff-side vegetation and the patch of mangrove due to its very narrow distribution. We sampled also areas of mixed woodland, shrubland, and exposed lands located in the most eastern "plateau forest" because the classification of these land cover types was unclear (Table 2). We also used the Landsat NDVI to separate vegetated from non-vegetated surfaces: pixels with NDVI > =0.09 were considered vegetated, while pixels with NDVI <0.09 were considered as non-vegetated.
Finally, we analyzed the vegetation-NDVI samples within each topographic unit in order to identify ranges in NDVI that correspond to the specific vegetation classes. In case of NDVI values shared by different plant communities, we resolved to combine the classes into mixed or inclusive units if the Ikonos wouldnt allow us to separate them visually. For separating the plant communities in the cliffs, where no samples were collected, we used the same NDVI ranges as in the plateau, since the vegetation in the cliffs (including the tree density) is more similar to the platform than to the coastal lowland (Table 1). Ultimately, we used the Ikonos imagery to add by visual interpretation the mangrove patch, few built-up pixels (field station facilities and a light house), small patches of grasses, the two types of shorelines, and the areas covered by clouds in the Landsat data.
Accuracy assessment: we conducted an accuracy assessment for all the classes mapped by the NDVI approach. Small land cover classes that resulted from manual mapping (shorelines, built-up, mangrove, and grasses) were evaluated visually, since their occurrence is limited to small and known areas. Cliffside vegetation was considered as a single class for the accuracy assessment; however, further visual assessment was done to ensure the correct separation of forest from woodland and shrubland. The accuracy assessment consisted of 300 9 pixel clusters samples (3 by 3 pixel groups) that were randomly selected, ensuring a minimum of 10 reference data points for each land cover class. For each location, the reference data was obtained by photo-interpretation of the Ikonos imagery. In order to account for the geometric error between the Landsat and Ikonos imagery, we created a 30 m buffer around the reference points and evaluated the most abundant land cover type within that zone. An error matrix was created to compare the reference data with the classification. The error matrix includes the overall percentage of correctly classified observations, the users and producers accuracy, and the Kappa coefficient, which measures accuracy that accounts for chance agreement between classes in an error matrix (Landis and Koch 1977). The producers accuracy is the proportion of correctly classified assessment observations, while users accuracy estimates the proportional assignment of pixels to a correct class.
Our Ikonos data was involved in the original vegetation sampling and in the final accuracy assessment. Although in ideal situations the data used to conduct the accuracy assessment should be independent of the data used to assist in the image classification, other efforts such as the US National Land Cover (by USGS) have demonstrate that using the same data (in this case aerial photographs) is also valid, at least for land cover mapping.
Results
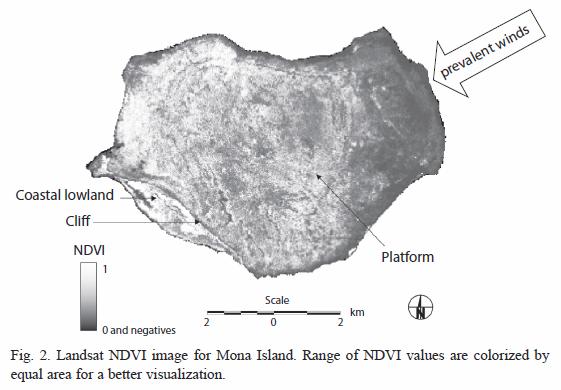
NDVI image interpretation: the image of the NDvI, alone, is a meaningful picture of the vegetation patterns in Mona (Fig. 2). It is easy to distinguish the transition from the more vigorous vegetation in the western plateau (lighter), where semideciduous forest tends to occur, to the less vigorous vegetation in the east (darker), characterized by shrubland vegetation and affected by the prevailing NE winds. In fact, all plateau borders exposed to the sea winds show some decrease of greenness. Depression forests are visible, particularly in the west of the platform, appearing as white spots in a darker color matrix. The coastal lowlands are distinguishable by the greater proportion of high NDvI values, associated with forest plantations and the close-canopy native forests. The airstrip in the lowlands is clearly different from the surroundings. Finally, beaches and rocky cliffs appear dark.
Distribution of NDVI samples: in the platform (Fig. 3A), the three groups sampled within the original "plateau forest" (including semideciduous forests, woodlands, and the small areas with mix of woodland, shrubland, and exposed lands), reported distinctive ranges of NDVI values, decreasing as the canopy opens and mixes with shrubland and exposed lands. Nevertheless, there were instances of shared NDVI values between vegetation types. First, semideciduous and evergreen forests share NDVI >0.7; and second, the group of mix woodland, shrubland, and exposed lands, share 0.56< NDVI >0.61 with some shrubland, and the cactus forest. Below that point, the NDVI decreases with distinctive values for the shrubland and the dwarf vegetation.
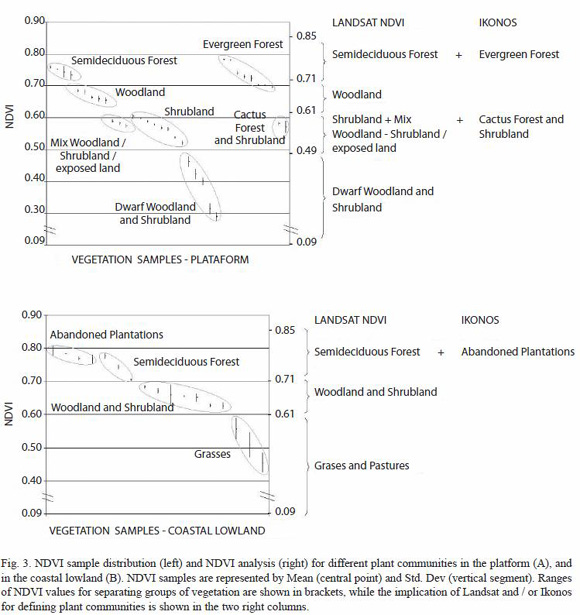
In the coastal lowland (Fig. 3B), NDVI decreased as vegetation changed from closed forest, to woodland and shrubland, and finally to grasses. The only overlap was between the forest plantations and the native forest, with NDVI >0.75.
All the forests in the island reported similar values of NDVI, ranging between 0.7 and 0.8. On the contrary, NDVI values for woodlands and shrubland were different depending upon their location in the platform or in the lowlands. NDVI between 0.6 and 0.7 corresponds to woodlands in the platform, but in the lowlands it includes both woodlands and shrubland. For NDVI <0.6, we found shrubs in the plateau or grasses in the lowlands. The variation in NDVI values (Mean and St. Dev) was higher for plant communities that exhibited low NDVI (grasslands and dwarf shrub vegetation) (Fig. 3).
From NDVI to land cover classes: in the plateau, the NDVI array was divided into four major groups: 1) forest, including semideciduous and evergreen (NDVI = 0.71), 2) woodlands, including some evergreen forests (0.61
 NDVI <0.71), 3) a mixed class that included a) shrubland, b) woodland/shrubland/exposed lands, and c) cactus forest (0.49 NDVI <0.61), and 4) the dwarf woodland and shrubland (NDVI <0.49) (Fig. 3A). The Ikonos imagery was used to manually separate the small patch of cactus forest (5), and the mixed woodland/shrubland/ exposed land was incorporated into the shrubland class, since shrubland is the predominant vegetation. Finally, the layer of the depression forests was added, making it possible to separate the evergreen forest (6) from the semideciduous (Fig. 3A).
In the coastal lowlands, the NDVI was segmented into three major classes: 1) forest, including semideciduous and plantations (NDVI 0.70), 2) woodland and shrubland (0.60 NDVI <0.70), and (3) grasses (NDVI <0.60) (Fig. 3B). Visual interpretation of the Ikonos imagery assisted by previous land cover map was used to separate the plantations (4), now abandoned, from the semideciduous forest.
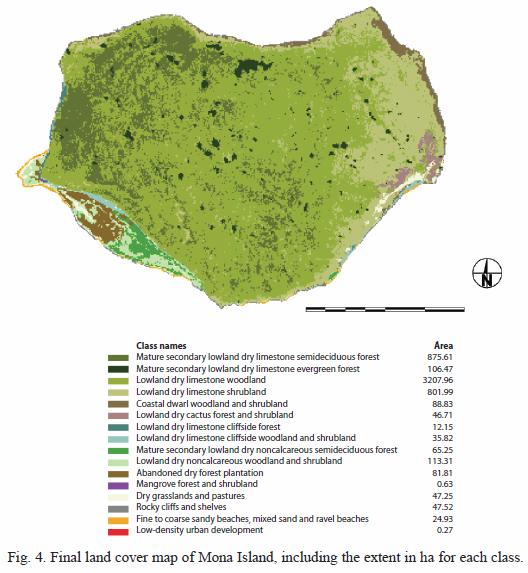
The land cover map of Mona Island: we mapped a total of 16 land cover classes for Mona Island, including vegetated and non vegetated, and estimated that the most abundant type is the dry limestone woodland, with nearly 3 200 ha, equivalent to 58% of the island. The second two most abundant land cover types were the limestone semideciduous forest, with 875 ha (16%), and the limestone shrubland, with 802 ha (14%) (Fig. 4). The remaining 13 land cover classes cover a very small extent (12% of the island), and ranged from 109 ha for the lowland woodlands and shrubland, to less that 1 ha for the mangrove patch and the builtup lands. Accuracy assessment yielded a kappa coefficient of substantial agreement equal to 79%, just below the strongest conformity point, which starts at 80% (Landis and Koch 1977) (Table 3). The overall classification accuracy meets nominally established standards of 85%. We believe that the presence of mixed pixels (i.e. pixels with more than one land cover type in the ground at the sampling scale of Landsat) was the main source of error. This was visible in areas of transition between vegetation types. In the transition from woodlands to shrubland in the plateau, areas with a mix of shrubland/woodland/exposed rocks might end up being classified as shrubland.
Discussion
Combining Landsat NDVI, topographic information, and high-resolution imagery, represented a valuable tool for mapping tropical dry forest habitats. Previous studies have shown the importance of the NDvI for characterizing different structural aspects of tropical dry forests (Oza et al. 1996, Sanches-Aofelia et al. 2003, Krishnawsamy et al. 2004, Feeley et al. 2005, Gillespie et al. 2006); nevertheless, in areas with a great variability in vegetation and a strong influence of relief such as Mona, NDVI alone was not sufficient to separate the entire collection of plant communities. For example, lowland forests and some platform forests showed similar NDVI values, making it impossible to separate them from a spectral basis. As a result, topographic information was needed first in order to segment the island into regions with distinct vegetation, corresponding to the plateau, cliffs, and coastal plain. NDVI was used within each of these units and allowed to separate the major groups of vegetation, including forests, woodlands, shrubland, and some grasses, by capturing their differences in "green" structure and canopy closure. NDVI was practical even if the extent of the plant communities allowed for the identification of just few samples. The different classes of vegetation exhibited a variable range of NDVI values (mean and std. dev.), reflecting internal variations in structure that have been associated with changes in micro-relief or soil depth (Cintrón and Rogers 1991). In the case of low growing vegetation, including grasses and dwarf shrub, the presence of bare rock and soil might enhanced this variability.
We found that the NDVI increased with canopy cover, supporting previous research (Oza et al. 1996, Feeley et al. 2005). The NDVI was particularly important in the platform, where the previous "plateau forest", a single and large class characterized by a gradual change in canopy closure, was split into forests and woodland. We also found a positive relationship between tree density reported by Cintrón and Rogers (1991) (Table 1) and the Landsat NDVI, similar to other studies in short dry-forests from south Florida (Gillespie et al. 2006), although this relationship seems not transferable to all dry forests (Sanches-Aofelia et al. 2003). In the plateau, the evergreen forests ("bajuras"), which have the highest tree densities equal to 0.2 trees/m2 to 0.3 trees/m2, showed the highest values of NDVI, and the semideciduous forests, which have a tree density equal to 0.17 trees/m2, had higher NDVI values than the woodland or eastern plateau forest with a tree density equal to 0.09 trees/m2. However, we found that some evergreen forests had similar NDVI values to the western plateau forest, or even lower. The reasons of this lower than expected value of NDVI for evergreen forests could be explained by several factors. First, we have observed openings in the depression forests as a result of some blown down tress due hurricane Georges, which didnt occur with the trees of other plateau forests. The trees in the depressions are taller than the surroundings and because of this they are more susceptible to hurricanes. Second, ongoing research suggests that the tree density in some depression forests has decreased during the last 30 years as a result of damage caused by introduced goats and pigs (Martinez et al. 2005). In this sense, future research in Mona would benefit from the integration of multitemporal NDVI from Landsat (available since the 1970s) for assessing the status and responses of vegetation. Finally, we also found that forest types with a higher diversity of trees tended to have a higher NDvI values, similar to other studies (Feeley et al. 2005, Gillespie 2005).
The 30 m Landsat pixel is adequate for mapping major woody vegetation formations (Helmer 2002), but the integration of highspatial resolution data allowed for a more detailed characterization of the landscape. The combination of high-resolution imagery with field knowledge represented a useful tool for sampling vegetation as well as for refining the mapping of habitats. The 1 m resolution Ikonos imagery was practical for collecting samples of plant communities that included internal changes in canopy cover, for separating classes that showed similar NDVI values in the Landsat imagery, and for mapping some small or narrow features. Some of the land cover classes for which the use of high-resolution imagery was important, such as depression forests, mangroves, and shorelines, might not be relevant in terms of total cover, but they are critical features for biodiversity and represent important habitats for wildlife species. The use of high-resolution data allowed us to increase the number of land cover classes from ten (as they resulted from the integration of Landsat and landforms) to sixteen.
The methods developed in this study can be applied to other tropical dry-forest regions when mapping of land cover and habitats is desired. Although the need of auxiliary information (topographic and high-resolution imagery) could limit the possibilities, this concern can be addressed in diverse ways depending on the study area, level of mapping desired, and available resources. In Mona, topography is the principal variable explaining the distribution of vegetation (Cintrón and Rogers 1991), but in other places variables such as geology or land use history may be better used. For areas where topography is important for vegetation, information can be derived from digital elevation models (DEMs), using the slope, elevation, aspect, or combination of them (Manis et al. 2001, Martinuzzi el al. 2007a). Unfortunately, we found that the spatial resolution of the 30 m DEM for Mona was not adequate for separating the narrow cliffs of Mona; and because the topographic changes in the island are exceptionally strong, it was easier to interpret the landforms from Ikonos data. On the other hand, high-resolution imagery might be specially needed if a detailed mapping and habitat classification is desired. Although aerial photographs can be used instead of Ikonos, for new acquisitions, Ikonos data has proved to be of greater value due to the lower cost coordination effort required in the collection, and the high temporal resolution that might help finding images with low cloud cover (Morisette et al. 2003). In addition, Ikonos data is available globally, while some areas not covered by aerial survey companies. Finally, while the presence of clouds is a common problem of optical remote sensing in tropical areas, dryforest regions are characterized by a lower presence of clouds, which might facilitate the acquisition of cloud-free scenes (or circa). In addition, new approaches have been developed to produce cloud-free images in tropical landscapes shedding a new light to the cloud problem (Helmer and Ruefenacht 2005, Martinuzzi et al. 2007b).
The map produced by this study represents a key piece for modeling vertebrate species distribution for the PR-Gap Analysis, allowing the future comparison of biodiversity patterns with other regions and forests, and it represent valuable information for assisting research and management activities in the island. Mapping habitats using the methods presented in this study might be of immediate benefit for those areas where the required satellite information is already available, such as Florida, Puerto Rico, and the virgin Islands, as well as for ongoing projects such as the Mesoamerican and Caribbean Geospatial Alliance, which among others integrate Landsat and auxiliary information (including high-resolution imagery) for mapping the land cover and habitats for all the islands of the Caribbean.
Although some plant communities exhibited a variable coverage that can include bare soil, the accuracy assessment demonstrated that this problem was confined to certain transition areas of woodland to shrubland (which were finally classified as shrubland). In the eastern border of the island, where an open shrubland change to a low shrubland and cactus vegetation, the presence of bare rock and soil was not an impediment for separating them. Land cover comparison between the previous land cover map by Cintron and Rogers (1991) and the one presented in this study should be done with caution. Since there are strong differences in image sources (1960s aerial photos vs. 2001 Landsat imagery), mapping methods (manual vectorization vs. semiautomatic classification), and accuracy assessment (absent for the previous map), discrepancies in the extent of plant communities is expected.
In summary, the combination of Landsat NDVI, topographic information, and high-resolution imagery results in a useful tool for mapping tropical dry forests in complex landscapes such as the Caribbean island of Mona. This is of special value under the great need for remote sensing applications and information able to support conservation and monitoring strategies in these ecosystems.
Acknowledgments
This research was funded by the USGSBRD National Gap Program, administrated by the USDA Forest Service International Institute of Tropical Forestry (IITF), and supported by the IITF GIS and Remote Sensing Laboratory. We are most grateful for review and comments on the manuscript by A.E. Lugo at IITF, L.A. vierling at the University of Idahos Geospatial Laboratory for Environmental Dynamics (GLED), and two anonymous reviewers who greatly improved the quality of the manuscript. Special thanks to E. J. Melendez-Ackerman, and the Mona Island Project (Crest-Catec). Thanks to Melanie Johnsin at GLED for assisting with the figures. All research at IITF is done in collaboration with the University of Puerto Rico.
Resumen
El estudio y evaluación de los bosques tropicales secos mediante herramientas de teledetección es una de las prioridades de investigación en los ambientes neotropicales. Desarrollamos una metodología simple para mapear la vegetación de la isla de Mona, Puerto Rico, mediante el uso del índice de vegetación normalizado (NDVI por sus siglas en inglés) de Landsat, información topográfica, e imágenes auxiliares de alta resolución Ikonos. La metodología fue útil para identificar las clases de vegetación en un área de gran variedad de comunidades vegetales y relieve complejo, y puede ser adaptada a otras regiones de bosque seco de las islas del Caribe. El NDVI permitió identificar la distribución de los bosques cerrados, abiertos, y arbustos, proveyendo una representación natural de los patrones de vegetación en la isla. Las imágenes de Ikonos permitieron incrementar el número de clases detectadas. Como resultado, mapeamos 16 clases de cobertura del terreno en las 5 500 hectáreas de la isla de Mona, con un coeficiente de concordancia kappa de un 79%. La información obtenida en este estudio será utilizada para modelar la distribución de los vertebrados terrestres y patrones de biodiversidad en la isla, como parte del proyecto Gap Análisis de Puerto Rico, y es de gran valor para asistir en las actividades de investigación y manejo en la isla.
Palabras clave: bosques secos tropicales, Landsat, NDVI, Ikonos, mapa de vegetación, topografía, Puerto Rico, Caribe.
References
Chavez, P.S. 1996. Image-based atmospheric correctionsrevisited and revised. Photogramm. Eng. Rem. S. 62: 1025-1036. [ Links ]
Cintrón, B. & B. Rogers. 1991. Plant communities of Mona Island. Acta Cient. 5: 10-64. [ Links ]
Feeley, K.J., T.W. Gillespie & J.W. Trborgh. 2005. The utility of spectral indices from Landsat ETM+ for Measuring the Structure and Composition of Tropical Dry Forests. Biotropica 37: 508-519. [ Links ]
Frank, E.F, C. Wicks, J.M. Mylroie, J. Troester, E. Calvin Alexander Jr. & J.L. Carew. 1998. Geology of island de Mona, Puerto Rico. J. Cave Karst Stud. 60: 69-72. [ Links ]
Gillespie, T.W. 2005. Predicting woody plant species richness in tropical dry forests: A case study from south Florida. Ecol. Appl. 15:19-26. [ Links ]
Gillespie, T.W., B.R. Zutta, M.K. Early & S. Saatchi. 2006. Predicting and quantifying the structure of tropical dry forests in Southe Florida and the Neotropics using spaceborn imagery. Global Ecol. Biogeogr. 15: 225-236. [ Links ]
Gould , W.A., C. Alarcón, B. Fevold, M.E. Jiménez, S. Martinuzzi, G. Potts, M. Solórzano & E. Ventosa. 2007. Puerto Rico Gap Analysis Project – Final Report. USGS, Moscow, ID and the USDA Forest Service International Institute of Tropical Forestry, Río Piedras, PR. 159 pp. and 8 appendices. [ Links ]
Helmer, E.H., O.M. Ramos Gonzalez, T. del M. López, M. Quiñonez & W. Díaz. 2002. Mapping the Forest Type and Land Cover of Puerto Rico, a Component of the Caribbean Biodiversity Hotspot. Caribb. J. Sci. 38: 165–183. [ Links ]
Helmer, E.H. & B. Ruefenacht. 2005. Cloud-Free Satellite Image Mosaics with Regression Trees and Histogram Matching. Photogramm. Eng. Rem. S. 71:1079-1089. [ Links ]
Holdridge, L. 1967. Life zone ecology. Tropical Science Center, San Jose, Costa Rica. [ Links ]
Innes, J.L. & B. Koch. 1998. The assessment of forest biodiversity by remote sensing. Global Ecol. Biogeogr. 7: 397-419. [ Links ]
Jansen, D.H. 1998. Tropical dry forests: the most endangered major tropical ecosystem, p 130-137. In E.O. Wilson (ed.). Biodiversity. Natural Academy, Washington DC, USA. [ Links ]
Krishnaswamy, J., M.C. Kiran & K.N. Ganeshaiah. 2004. Tree model based eco-climatic vegetation classificatiom and fuzzy mapping in diverse tropical deciduous ecosystems using multi-season NDVI. Remote Sens. Environ. 25: 1185-1205. [ Links ]
Landis, J.R & G.G. Koch. 1997. The measurement of observer agreement for categorical data. Biometrics 33: 159-174. [ Links ]
Manis, G., J. Lowry & R.D. Ramsey. 2001. Preclassification: An Ecological Predictive Landform Model. Gap Analysis Bulletin 10: 11-13. [ Links ]
Martinez, A., P. Calle, O.M. Ramos González, E. Melendez-Ackerman & P. Leimgruber. 2005. Depression Forest Mapping for Mona Island Reserve using High Resolution Imagery. Proceedings of the 19th Annual Meeting of the Society for Conservation Biology. Universidad de Brasilia, Brasilia, DF, Brazil. [ Links ]
Martinuzzi, S., W.A. Gould, O.M. Ramos Gonzalez & B.E. Edwards. 2007a. Development of a Landforms Model for Puerto Rico and its Application for Land Cover Change Analysis. Caribb. J. Sci. 47: 161-171. [ Links ]
Martinuzzi, S., W.A. Gould & O.M. Ramos Gonzalez. 2007b. Creating Cloud-Free Landsat ETM+ Data Sets in Tropical Landscapes: Cloud and Cloud-Shadow Removal. United States Department of Agriculture Forest Service IITF-GTR-32. Feb. 2007 [ Links ]
Melendez-Ackerman, E.J., S. Aragón, M. Morales-Vargas, J. Sustache, F.S. Axelrod, C. Fuentes, J.D. Ackerman, M. García & D.S. Fernández. 2002. Monitoring Efforts Yield New Plant Records For Mona Island, Puerto Rico, A Tropical Dry Forest Wonderland. Caribb. J. Sci. 41: 150-152. [ Links ]
Morisette, J.T., J.E. Nickeson, P. Davis, Y. Wang, Y. Tian, C.E. Woodcock, N. Shabanov, M. Hansen, W.B. Cohen, D.R. Oetter & R.F. Kennedy. 2003. High spatial resolution observations for validations of MODIS land products: IKONOS observations acquired under the NASA Scientific Data Purchase. Remote Sens. Environ. 88: 100-110. [ Links ]
Murphy, P.G. & A.E. Lugo. 1986. Ecology of tropical dry forest. Annu. Rev. Ecol. Syst. 17: 66-88. [ Links ]
NOAA, U.S. Environmental Protection Agency, U.S. Coast Guard, Puerto Rico Departmento de Recursos Naturales y Ambientales & U.S. Department of Interior. 2000. Sensitivity of Coastal and Inland Resources to Spilled Oil - Puerto Rico Atlas. Seattle, WA by Hazardous Materials Response Division of NOAA, Seattle, Washington, USA. [ Links ]
Oza, M.P., V.K. Srivastava & P.K. Devaiah. 1996. Estimating tree volume in tropical dry deciduous forest from Landsat TM data. Geocarto Int. 11: 33-39. [ Links ]
Peters, A.J. & M.D. Eve. 1995. Satellite monitoring of desert plant community response to moisture availability. Environ. Monit. Assess. 37: 273-287. [ Links ]
Raffaele, H. 1973. Assessment of Mona island avifauna. In Monito and Mona Islands: An assessment of their natural and historical resources. San Juan: Puerto Rico Environmental Quality Board 2: K1-K32. [ Links ]
Ramos, O.M. 2004. Vegetation types for Mona Island, Puerto Rico. Map produced by the USDA Forest Service IITF GIS Lab, Aug 2004, based on map by Barbara Cintrón and Lee Rogers (1974), Puerto Rico Department of Natural Resources, Puerto Rico. [ Links ]
Ramos, O.M. & A.E. Lugo. 1994. Mapa de la vegetacion de Puerto Rico. Acta Cient. 8: 63-66. [ Links ]
Rouse, J.W., R.H. Haas, J.A. Schell & D.W. Deering. 1974. Monitoring vegetation Systems in the Great Plains with ERTS. Proceedings of the Third Earth Resources Technology Satellite-1 Symposium, Greenbelt: NASA SP-351, 3010-317. [ Links ]
Sanchez-Azofeia, G.A., K.L. Castro, B. Rivard, M.R. Kalascka & R.C. Harris. 2003. Remote sensing priorities in tropical dry forest environments. Biotropica 35: 134-142. [ Links ]
Sanchez-Azofeifa, G.A., J.P. Rodriguez & J. Nassar. 2005. Research priorities in tropical dry forests environments. Biotropica 37: 477-485. [ Links ]
Southworth, J. 2004. An assessment of Landsat TM band 6 thermal data for analyzing land cover in tropical dry forests. Int. J. Remote Sens. 25: 689-706. [ Links ]
Trejo-Torres, J.C. & J.D. Ackerman. 2002. Composition patterns of Caribbean limestone forests: are parsimony, classification, and ordination analyses congruent? Biotropica 34: 502-515. [ Links ]
Turner, W., S. Spector, N. Gardiner, M. Flodeland, E. Sterling & M. Steininger. 2003. Remote sensing for biodiversity science and conservation. Trends Ecol. Evol. 18: 306-314. [ Links ]
Van Bloem, S.J., P.G. Murphy, A.E. Lugo, R. Osterlag, M.R. Costa, I. Bernard, S. Colon & M. Mora. 2005. The Influence of Hurricane Winds on Caribbean Dry Forest Structure and Nutrient Pools. Biotropica 37: 571-583. [ Links ]
Vogelman, J.E, T. Sohl & S.M. Howard. 1998. Regional characterization of land cover using multiple source of data. Photogramm. Eng. Rem. S. 64: 45-57. [ Links ]
Wiewandt, T.A. 1979. La gran iguana de Mona. Nat. Hist. 88: 57-65. [ Links ]
Wulder, M.A., R.J. Hall, N.C. Coops & S.E. Franklin. 2004. High Spatial Resolution Remotely Sensed Data for Ecosystem Characterization. Bioscience 54: 511-521. [ Links ]
Internet references
Mesoamerican and Caribbean Geospatial Alliance; http://edcintl.cr.usgs.gov/macga/landcover.php (Downloaded: Nov 2, 2006) [ Links ]
Ecoregional Assessment of the Greater Caribbean Basin;http://edcintl.cr.usgs.gov/macga/tnc.php (Downloaded: Nov 2, 2006) [ Links ]
Huang, C., L. Yang, C. Homer, B. Wylie, J. Vogelman & T. DeFelice. 2002. At-satellite reflectance: A first normalization of Landsat 7 ETM+ Images. U.S. Dept. of Interior, USGS. http//landcover.usgs.gov/pdf/huang2.pdf (Downloaded: Nov 2, 2006) [ Links ]
US National Land Cover Dataset (USGS). http://landcover.usgs.gov/natllandcover.php (Downloaded: Nov 2, 2006) [ Links ]

