


Services on Demand
Journal
Article
 Article in xml format
 Article references
 Send this article by e-mail
Indicators
-
 Cited by SciELO
 -
 Access statistics
Related links
-
 Similars in
SciELO
Similars in
SciELO  uBio
uBio
Share

 Permalink
Revista de Biología Tropical
On-line version ISSN 0034-7744Print version ISSN 0034-7744
Rev. biol. trop vol.47 n.4 San José Dec. 1999
Olman Murillo1 and Oscar Rocha2
Received 16- IX-1998. Corrected 05-IV-1999. Accepted 16-IV-1999.
Abstract
Seventeen natural populations in Costa Rica and Panama were used to asses gene flow and geographic patterns of genetic variation in this tree species. Gene flow analysis was based on the methods of rare alleles and FST (Index of genetic similarity M), using the only four polymorphic gene loci among 22 investigated (PGI-B, PGM-A, MNR-A and IDH-A). The geographic variation analysis was based on Pearson`s correlations between four geographic and 14 genetic variables. Some evidence of isolation by distance and a weak gene flow among geographic regions was found. Patterns of clinal variation in relation to altitude (r = -0.62 for genetic diversity) and latitude (r= -0.77 for PGI-B3) were also observed, supporting the hypothesis of isolation by distance. No private alleles were found at the single population level.
Key words
Alnus acuminata, isozymes, gene flow, cline, geographic variation, Costa Rica, Panama
Pollen and seed movement among subdivided populations in a tree species, counteract the effect of genetic divergence promoted by selection and random genetic drift within small isolated populations (Hartl 1980). Spatial distribution, flowering phenology, incompatibility mechanism, and pollen and seed dispersion patterns, all contribute to genetic structuring of populations. The status of a population at any moment and its rate of change will be the result of the combination of all these factors (Hamrick and Murawski 1991). Alnus acuminata shows a midsuccessional species pattern, subject to repeated colonization, extinction, and recolonization episodes associated to natural catastrophies. In such species, where neighborhood sites may be relatively small, interactions among neighborhoods in space and time may counteract any potential for genetic drift (Hamrick 1992 in Boshier et al. 1995). Similarly as described by Cordia alliodora (Boshier et al. 1995), "from observation during rain on sloping terrain, the formation of temporary rivulets will lead to additional seed dispersal and sometimes to clumped areas of regeneration". Since such temporary water courses carry seed into rivers, dispersal distances in the order of kilometers are feasible. Such long-distance dispersal events are very important in colonization and in breaking down population isolation via gene flow.
Gene flow and its importance in evolution has been debated for a long time under a variety of strong views, as pointed out by Slatkin (1981): "One view states that gene flow is common and that a small amount of gene flow among different parts of a species range effectively unifies the species and affects significantly the genetic changes in each part of the range". The other view is that gene flow is uncommon and that natural selection acts more or less independently in each part of the range of the species. Besides, the estimates of gene flow can be severely affected since there is always a non noticeable amount of gene flow, as well as, a large amount that may have migrated but not breed. Therefore, methods of estimating gene flow among populations have been proposed and discussed by Slatkin (1981, 1985) and found later that FST and rare-alleles methods yield comparable estimates under a wide variety of conditions. However, since there are practical problems in estimating the frequencies of rare alleles in electrophoretic studies, eespecially when sampling diploid genotypes (Gregorius 1980), is therefore Fst likely to be more useful under realistic conditions (Slatkin and Barton 1989, Slatkin 1993).
Gene flow is often analyzed under ecogeographical or clinal patterns of species range distribution. The origin of clinal variation in natural populations has been debated since Mayr (1942 in Yang and Yeh 1995) postulated a differentiation between zones of primary and secondary intergradation. Mayr defined primary intergradation as clinal variation that develops within a continuous series of populations and secondary intergradation as the consequence of junction between populations that have become differentiated in allopatry. Some empirical evidence suggests that current patterns of allele frequency clinal variation reflect secondary contact between populations that were isolated in refugia during the Pleistocene (post-Pleistocene secondary contact) and possessing different prevalent alleles (especially rare alleles) at a gene locus (Gallant et al. 1993, Hattemer et al. 1993, Konnert and Bergmann 1995). Besides, for several european tree species, an important genetic effect has been caused by forest utilization in the last centuries (Hattemer, et al. 1993). However, other research suggest that clinal or ecogeographical variation is mostly the result of spatial adaptations patterns of enzyme phenotypic (genotypic) polymorphisms to gradually varying environmental factors (Bergmann 1978, Bergmann and Gregorius 1993), and thus, reflects primary intergradation. However, it is important to know whether the extent of gene flow between populations depends on their geographic distances, "isolation by distance", as originally proposed by Wright (1943 in Yang and Yeh 1995). Therefore, it is intended to elucidate in this study the possible patterns of gene flow throughout the Alnus acuminata natural occurrence in Costa Rica and Panama, as well as the possibility of isolation by distance among the different geographical regions.
Alnus acuminata is one of the most widely distributed species of the genus. It covers a large discontinuous geographical range throughout the Americas, stretching from central Mexico to northern Argentina (Lamprecht 1990). This tree species was recently subdivided into three subspecies, namely acuminata, arguta and glabrata (Furlow 1979a, 1979b). The species occurs through wide ecological gradients, from around 1400 to 3200 m in elevation (Anonymous 1995, Furlow 1979a, Lamprecht 1990), from 2000 until 5000 mm in annual precipitation (Anonymous 1995, Coen 1983, Vargas 1994) and from deep and rich volcanic soils (andosols) to shallow, heavy-textured, low fertility and poorly drained inceptisols (Anonymous 1995, Vázquez 1983). These highly variable environmental conditions clearly enhance large differences in the ecological conditions over short distances throughout the distribution of this tree species, which may have promoted an important amount of genetic variation among populations, with large potential benefits. The distribution of this species in Costa Rica is discontinuous, as it is found along the Central Volcanic Mountain Range and the Talamanca Mountain Range, where the populations are separated one from another by valleys (Alvarez 1956, Camacho and Murillo 1986).
Materials an Methods
Allozyme data: the 17 sampled populations represent geographically and ecologically the distinct natural regions of Alnus acuminata ssp. arguta in Costa Rica and Panama (Anonymous, 1995, Murillo et al. 1993) as shown in Table 1. The various single populations sampled are distribuited along five natural population regions. Each single population is represented by a random sample of 31 to 63 adult trees (with an average of 52 trees) separated by a minimum of 50 m distance. Different materials from each tree were electrophoretically assayed for variation in 10 enzymes systems. The samples were hand homogenized in a mortar after the addition of two drops of the following extraction buffer (Murillo 1997) adjusted with 1N HCL to pH 7.3: 0.13 M TRIS; 0.4 mM Titriplex II; 0.3 mM dithiothreitol (DTT); 4% polyvinylpyrrolidone (PVP) and 1% -mercaptoethanol. The crude extract was soaked into paper wicks (Whatman chromatography paper No.3) and then inserted into the gels after approximately 10 min.
| Region/Population | | | |
| | |||
| 1. Zarcero | | | |
| 2. Bajos del Toro | | | |
| 3. Vara Blanca | | | |
| 4. Los Cartagos | | | |
| | |||
| 5. Coronado 1400 m.a.s.l. | | | |
| 6. Coronado > 2000 m.a.s.l. | | | |
| 7. Llano Grande | | | |
| 8. Irazú | | | |
| 9. Pacayas | | | |
| 10.Turrialba | | | |
| | |||
| 11. El Empalme | | | |
| 12. Caón | | | |
| 13. Copey | | | |
| 14. San Gerardo | | | |
| 15. Siberia | | | |
| 16. División | | | |
| | |||
| 17. Boquete | | | |
| Range | | | |
Buffers and running conditions routinely performed for starch gel electrophoresis of enzymes
in Alnus acuminata ssp. arguta (Murillo and Hattemer 1997).
| | Electrode buffer | Gel buffer | Running conditions | Enzyme system |
| | TRIS-Citrate system 0.148 M Tris 0.047 M citric acid pH 7.3 | 11-12% concentration. 0.038 M Tris 0.012 M citric acid | approx. 20 V cm-1 for 4 h, max. 180 mA or max. 200 Volt. | PGI, PGM, IDH, MNR, SKDH, MDH, 6-PGDH, ADH. |
| | ASHTON-system 0.19 M boric acid 0.042 M lithium hidroxide pH 8.1 | 11-12 % concentration 0.05 M Tris 9.5 mM citric acid pH 8.1 | approx. 18 V cm-1 for 5 to 5 h, max. 200 Volt. or 80 mA. | AAT LAP MNR PGM |
| III | POULIK-system 0.3 M Tris NaOH 10N pH 8.0 | 9-10% concentration 0.017 M Tris 2.3 mM citric acid pH 8.0 | approx. 18-20 V cm-1 for 5 h, max. 200 Volt. or 70 mA | AAT LAP MNR PGM |
| IV | TRIS-Histidine-system 0.048 M L-Histidine HCL 9.5 mM citric acid pH 6.5 | 9-10% concentration 7.2 mM L-Histidine HCL 1.4 mM citric acid pH 6.5 | approx. 18-20 V cm-1 for 4 h, 15-30 mA or max. 200 Volt. | PGI, PGM, IDH, MNR, SKDH, MDH, 6-PGDH, ADH. |
Horizontal starch gel electrophoresis was performed routinely with TRIS-histidine and POULIK systems for the different isozymes analyzed, under a voltage of 18 to 20 V.cm-1 in a running distance of approximately 10 cm (see Table 2 for details of the different buffer and running conditions routinely applied) and following the general known procedures (Couto et al 1991, Liengsiri et al. 1990). Various combinations of electrode and gel buffers (Cheliak and Pitel 1984, Soltis and Soltis 1989) were initially tested for their suitability to improve the zymograms. The staining of enzymes was performed according to recipes given by Cheliak and Pitel (1984) and Soltis and Soltis (1989). The enzyme polymorphisms and its inheritance pattern was previously developed (Murillo and Hattemer 1997).
Gene flow assessment: Gene flow assessment was based on the methods of rare alleles and FSt proposed by Slatkin (1981, 1993). There were considered the only four polymorphic gene loci. The total number of alleles observed in a population was
- AT =SIi=1kij where (1)
i = the ith locus (i = 1,2,.., I)
j = the jth population (j = 1,2,..., J)
The same procedures were utilized for the analysis of gene flow at the regions of populations level. Single populations were pooled in their regional level, according to their geographic distribution. The allele frequencies were divided into rare (p < 0.105 in average across populations) and common (p > 0.105 in average) alleles. The alleles were then registered in rare (AR) and total number of observed alleles (aT ). Slatkin (1981) defines occupancy number of an allele (i) to be the number of demes (ni) in which it is present. Consequently, the conditional average frequency p (i) is the average frequency of all alleles having the same occupancy number
( Sp (i)/ni ) (2)
It has been proposed that populations sharing rare alleles are more likely to have a recent coancestry either because of mutations in recent history, or because more distantly related populations lost such alleles following divergence and isolation (Bergmann and Gregorius 1993). Besides, it has been shown that the average frequency of an allele conditioned on the number of local populations it appears in (named as the conditional average frequency), is a sensitive predictor of gene flow, since it is independent of both the selection intensity and mutation rates (Slatkin 1981).
The index of genetic similarity (M) from Slatkin (1993) is estimated from the relationship:
- M = (1/(FST-1)/4 (3)
log10 (M) = a + b log10 (d) (4)
Then, M was plotted against geographic distance (in km) on a log-log graph in order to show this relationship. With this information the regression coefficient (b) was estimated using equation (4). A significant regression (b < 0) would indicate the presence of isolation by distance, as postulated by Slatkin (1993). However, there was no parametric test for significance of the b because values of M from different population pairs were not independent as required by the regression. Therefore, it was obtained an empirical distribution of b by bootstrapping as suggested by Yang and Yeh (1995) using the Statistical Analysis System (SAS). Each bootstrap sample was drawn from the data by sampling (with replacement) n times from the n pairs of log10 (M) and log10 (d), where n = 136 for the populations´ data-structure and n = 10 for the region of populations´ data-structure. The estimate of b was computed directly from the data and from each of 1000 bootstrap samples. A 95% confidence interval for b was constructed as the interval between the 26th to the 975th of 1000 ordered bootstrap estimates of b, after controlling normality in the distribution of data.
Further, all pair of Pearson`s correlations between geographic (latitude, longitude and altitude) and genetic variables were estimated. Genetic variables included: Number of multilocus genotypes, genetic diversity (v), subpopulation differentiation (Dj), hypothetical gametic diversity (vgam), genotypic multiplicity (Mgenotyp), allelic multiplicity (Mallelic), % heterozygosity IDH-A, % heterozygosity PGM-A, % heterozygosity PGI-B, % heterozygosity MNR-A, degree of heterozygosity, number of effectiv alleles(AT), number of rare alleles (AR) and total population differentiation (dT).
Results
Rare-alleles method: There were no single private alleles found at the single population nor at the geographical region level. In Table 3 it can be observed that there were only 3 alleles registered that were shared by a few populations, while the other 7 alleles were present in all populations. However no single population nor region contained all 10 polymorphic alleles. The distributional pattern of rare alleles was variable. Allele PGI-B1 was observed only in Poás I and Poás II regions, while allele MNR-A2 was found in 10 populations belonging to different regions. At the regional level there is a sligthly lower gene flow among regions, since there are more rare alleles concentrated in the lowest occupancy number (Table 3).
Within the Poás II and Talamanca regions the results suggest a very high gene flow among their populations (Table 3). In both regions it occurred that all 10 single alleles were shared by all populations, with similar frequency values. Meanwhile, in Poás I and Irazú regions an intermediate gene flow pattern appeared, since there were some alleles found that were present only in a few or a single population. Besides, some contrasting allele frequencies were found in the populations. For instance, between Zarcero and Bajos del Toro populations (Poás I region) a strong significative difference was observed in gene locus PGM-A (2 = 10.236 ***). Allele PGM-A2 was found only in the Bajos del Toro population and allele PGM-A1 showed a deviation in frequency between both populations, larger than their respective confidence intervals. Similarly, among populations within the Irazú region a significative difference (X2 test) in all gene loci was found.
Occupancy numbers and conditional average frequencies1) detected for 10 alleles at four polymorphic loci in natural
populations of Alnus acuminata in Costa Rica and Panama
| For the 17 single populations | | |
| | | |
| | | |
| | | |
| | | |
| For the 5 regions | ||
| | | |
| | | |
| | | |
| Within the regions | ||
| Poás I region (n = 2) | ||
| | | |
| | | |
| Poás II region (n = 2) | ||
| | | |
| Irazú region (n = 6) | ||
| | | |
| | | |
| Talamanca region (n = 6) | ||
| | | |
2) n = number of populations within the region
Genetic and geographic variables of 17 Alnus acuminata natural populations from Costa Rica and Panama
| Population | Genotypes | | Different | Gametic Diversity | PGI-B | PGM-A | | | | Differentiat . | | | (m) |
| Zarcero | | | | | | | | | | | | | |
| BajosToro | | | | | | | | | | | | | |
| Vara Blanca | | | | | | | | | | | | | |
| Los Cartagos | | | | | | | | | | | | | |
| Coronado < 1400 m.a.s.l. | | | | | | | | | | | | | |
| Coronado > 2000 m.a.s.l. | | | | | | | | | | | | | |
| Llano Grande | | | | | | | | | | | | | |
| Irazú | | | | | | | | | | | | | |
| Pacayas | | | | | | | | | | | | | |
| Turrialba | | | | | | | | | | | | | |
| El Empalme | | | | | | | | | | | | | |
| Caón | | | | | | | | | | | | | |
| Copey | | | | | | | | | | | | | |
| San Gerardo | | | | | | | | | | | | | |
| Siberia | | | | | | | | | | | | | |
| División | | | | | | | | | | | | | |
| Boquete | | | | | | | | | | | | | |
Patterns of gene dispersal among populations and regions: Estimates of correlation between geographic (latitude, longitude and altitude) and genetic variables are presented in Table 5. In general, there were negative relationships among all geographical and genetical variables. Latitude did not correlate significantly with any of the genetic variables, with the exception of a slightly but significative negative association to the percentage of heterozygosity in PGI-B. At higher elevation a weak tendency to diminution in percentage of heterozygosity in PGM-A was observed as well as in the degree of heterozygosity. On the other hand, longitude showed a significative negative association with subpopulation differentiation (Dj) and hypothetical gametic diversity (gam), as well as tendency to reduction in percentage of heterozygosity in PGM-A and in the degree of heterozygosity. Meanwhile, altitude showed a high negative correlation with the number of multilocus genotypes, as well as a significative and negative association to diversity (), total population differentiation (T in Figure 2) and hypothetical gametic diversity (gam). Eventhough the relationship between subpopulation differentiation (at the regional level) and the geographic vector was not significative, due to the few degrees of freedom (r = -0.85, p = 0.065), the coefficient of determination obtained reached 74% (r2 = 0.74 in Figure 3). With an increment in altitude there was a tendency to reduction (negative association) in the proportion of heterozygosity in gene locus PGM-A observed as well as in the degree of heterozygosity.
Pearson correlations between genetic and geographic variables in 17 natural populations of Alnus acuminata
from Costa Rica and Panama
| | | | | |
| No. of multilocus genotypes | (0.86) | (0.77) | (0.01) | (0.799) |
| Diversity | (0.17) | (0.11) | (0.03) | (0.15) |
| Subpopulation Differentiation | (0.17) | (0.03) | (0.94) | (0.108) |
| Hypothetic Gametic Diversity | (0.12) | (0.05) | (0.05) | (0.092) |
| PGI-B Proportional heterozygosity | (0.05) | (0.21) | (0.65) | (0.08) |
| PGM-A proportional heterozygosity | (0.09) | (0.08) | (0.51) | (0.092) |
| Degree of heterozygosity | (0.08) | (0.10) | (0.16) | (0.083) |
| Total Population Differentiation | (0.21) | (0.17) | (0.03) | (0.199) |
| (rare) | (0.04) | (0.05) | (0.04) | (0.02) |
| (rare) | (0.46) | (0.28) | (0.36) | (0.05) |
| | (0.04) | (0.05) | (0.04) | (0.01) |
| (rare) | (0.07) | (0.15) | (0.10) | (0.25) |
| | (0.01) | (0.04) | (0.01) | (0.44) |
| | (0.001) | (0.01) | (0.002) | (0.76) |
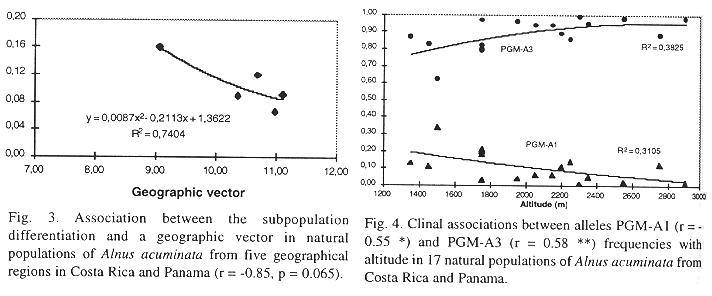
A clear clinal pattern in dependence of geographic variables was observed for some of the alleles at gene loci PGM and PGI (Table 5). Meanwhile PGM-A1- allel frequency was negatively correlated with altitude (r = -0.55*). PGM-A3 showed a strong positive association with altitude (Figure 4). Allel frequencies from PGI-B2 and PGI-B3 displayed opposing patterns with respect to latitude (Figure 5), with allel B2 showing a positive association (r = 0.64***) and B3 a negative one (r =-0.77***). It is important to mention that at each of these two gene loci three alleles were observed. Meanwhile, gene loci MNR-A and IDH-A displayed no association to any geographical variables.
Isolation by distance: Figures 6 and 7 are graphs of all pairwise M values plotted against their geographic distance (d) in a logarithmic scale. Genetic similarity (M) and geographic distance (d) varied considerably among pairs of populations and regions (Tables 6 and 7). There was only one case for which M < 1 (between populations Boquete and Turrialba, M = 0.95, d = 222 km) and several very close values to M < 1 between Boquete population and Coronado 2000 (M = 1.22 d = 227 km), and Boquete with Irazú (M = 1.42 d = 222 km), as well as between Turrialba and Copey populations (M = 1.40 d = 41 km), and Turrialba and División (M = 1.64 d = 57 km). Between pairs of geographical regions there were no single value of M < 5, indicating a large gene flow at this level.
Genetic similarity M (under the diagonal) and geographical distance (in km above the diagonal) for all possible pairs of natural populations of Alnus acuminata from Costa Rica and Panama (r = -0,259**, > 0,0023)
| Gene pool | | | | | | >2000m | | | | | | | | | | | |
| Zarcero | 0.00 | 9 | 26 | 24 | 48 | 55 | 60 | 65 | 69 | 76 | 72 | 78 | 82 | 97 | 109 | 115 | 280 |
| Bajos del Toro | 18.60 | 0.00 | 20 | 16 | 41 | 48 | 52 | 58 | 63 | 63 | 71 | 77 | 81 | 96 | 102 | 108 | 273 |
| Vara Blanca | 10.57 | 5.99 | 0.00 | 5 | 24 | 30 | 35 | 39 | 43 | 44 | 53 | 57 | 63 | 78 | 86 | 91 | 256 |
| Los Cartagos | 7.14 | 5.48 | 13.43 | 0.00 | 25 | 33 | 37 | 41 | 46 | 47 | 53 | 57 | 63 | 78 | 87 | 93 | 258 |
| Coronado 1400 m | 6.18 | 4.95 | 17.06 | 28.90 | 0.00 | 9 | 12 | 17 | 22 | 25 | 30 | 33 | 42 | 53 | 61 | 67 | 232 |
| Coronado > 2000 m | 5.12 | 5.83 | 6.71 | 29.03 | 12.76 | 0.00 | 8 | 10 | 15 | 18 | 28 | 31 | 40 | 50 | 56 | 62 | 227 |
| Llano Grande | 5.54 | 4.94 | 9.96 | 69.31 | 18.06 | 27.28 | 0.00 | 9 | 12 | 17 | 22 | 25 | 32 | 42 | 49 | 55 | 220 |
| Irazú | 4.29 | 7.63 | 5.22 | 8.09 | 6.00 | 13.33 | 9.83 | 0.00 | 5 | 7 | 29 | 30 | 37 | 45 | 51 | 57 | 222 |
| Pacayas | 7.64 | 10.20 | 5.88 | 46.77 | 11.11 | 40.03 | 31.55 | 20.46 | 0.00 | 7 | 27 | 28 | 34 | 41 | 47 | 53 | 218 |
| Turrialba | 2.09 | 2.15 | 3.37 | 7.21 | 6.65 | 6.96 | 11.16 | 5.06 | 5.84 | 0.00 | 34 | 35 | 41 | 47 | 51 | 57 | 222 |
| El Empalme | 15.34 | 13.34 | 6.05 | 12.61 | 7.42 | 12.16 | 8.41 | 6.18 | 16.32 | 2.60 | 0.00 | 6 | 10 | 25 | 36 | 40 | 205 |
| Caón | 13.02 | 8.58 | 7.03 | 20.72 | 9.07 | 14.58 | 11.34 | 5.61 | 16.24 | 2.96 | 109.99 | 0.00 | 7 | 19 | 30 | 34 | 199 |
| Copey | 17.83 | 6.08 | 4.39 | 4.35 | 3.28 | 3.16 | 3.27 | 2.28 | 3.79 | 1.40 | 9.68 | 4.73 | 0.00 | 15 | 25 | 28 | 193 |
| San Gerardo | 15.94 | 5.52 | 5.03 | 15.21 | 8.63 | 6.34 | 8.65 | 3.34 | 7.19 | 2.58 | 13.34 | 22.75 | 13.52 | 0.00 | 11 | 13 | 178 |
| Siberia | 17.55 | 5.98 | 6.78 | 6.88 | 5.28 | 4.21 | 4.70 | 4.48 | 6.53 | 1.71 | 17.16 | 18.75 | 107.54 | 22.40 | 0.00 | 6 | 171 |
| División | 16.26 | 12.86 | 4.10 | 5.70 | 3.88 | 4.45 | 4.16 | 4.75 | 6.61 | 1.65 | 35.05 | 18.03 | 18.45 | 8.54 | 28.04 | 0.00 | 165 |
| Boquete | 8.69 | 3.18 | 3.41 | 1.68 | 2.15 | 1.22 | 1.49 | 1.43 | 1.51 | 0.96 | 3.79 | 1.72 | 8.55 | 12.08 | 7.28 | 3.66 | 0.00 |
Genetic similarity values M (under the diagonal) and geographical distances (above the diagonal in km) for all possible pairs of geographical regions of natural occurrence for Alnus acuminata in Costa Rica and Panama
| | Poás I | | | | |
| Poás I | 0 | 20 | 41 | 71 | 273 |
| Poás II | 9.35 | 0 | 24 | 53 | 256 |
| Irazú | 7.41 | 21.31 | 0 | 22 | 220 |
| Talamanca | 27.79 | 10.19 | 5.81 | 0 | 165 |
| Boquete | 6.73 | 7.20 | 4.39 | 14.26 | 0 |
Statistics (Mean, range and confidence intervals) of the estimates (obtained by bootstraping) of intercept (a) and slope
(b) from the regression of genetic similarity (M) on geographic distance (d) on a log-log scale in Alnus acuminata
populations from Costa Rica and Panama
| Parameter | | ( = 0.05) | (Min-Max) |
| Population level (n = 136) | |||
| d (in_km) | | | |
| M | | | |
| Interception | | | |
| Slope (b) | | | |
| Region level (n = 10) | |||
| d (in_km) | | | |
| M | | | |
| Interception | | | |
| Slope (b) | | | |
Discussion
Clinal variation: The extreme variation in edaphic and climatic conditions among geographical regions (Coen 1983, Vargas 1994, Vázquez 1983) may explain the lack of a stronger association to geography. Such environmental differences may promote an important local adaptation of enzyme polymorphisms (Bergmann and Gregorius 1993), so that among-population fluctuation can only be partially explained by the geographic local adaptation of the populations. However, there was a weak but significative pattern of reduction in genetic parameters as long it goes south. This pattern of clinal variation is partially obscured by the disjunction between geographical occurence of this tree species within Costa Rica. The lack of a natural continuum may create some physical obstacules to gene flow among regions and populations. This can be observed in the results shown in Table 3. In the Talamanca and Poás II regions still exists a continuity of natural forests among the local populations and a lower anthropogenic disturbance in comparison to the other regions. This is reflected in an equal occupancy number for all their alleles. If the Poás I and Poás II regions were pooled together, arguing that they are physically close to each other, then there would be a private allele (PGI-B1 with p = 0.075) for this pooled region. Then, the respective analysis would come out with a clear pattern of a tree species with an intermediate gene flow (Slatkin 1981). According to Slatkin (1981), in the high migration species (Nm > 1) there are numerous alleles that have intermediate occupancy numbers with very low frequencies, as shown in Table 3. Then, the smooth form of the curve in Figure 1 corresponds to a high migration species. This type of situations support the arguments in favor of the FST over the rare-alleles method for studying gene flow, as has been latter pointed out by the same author (Slatkin and Barton 1989). The FST method uses all of the gene-frequency data, thereby making it less sensitive to misreading electrophoretic gels for particular loci. Besides, it is less sensitive of errors that would come with the identification of a private allele as belonging to another allelic type, or like in this study, where different possible definitions of a region of demes could bring out totally different frequencies for their rare and private alleles. In the same direction, the rare alleles method would be more sensitive to the common problem of sampling size and sampling procedures in genetic inventories (Gregorius 1980, Hattemer et al. 1982). Thus, the results obtained with thep (i) method in this study should not be considered as conclusive. The patterns observed tend to favor a model of a high gene flow among populations within regions and a high-intermediate gene flow among regions of populations.
Biogeographically, Alnus acuminata has migrated from the northern to southern hemisphere throughout Latin America, leaving several disjunct groups of populations isolated during the glacial events at high elevations (Furlow 1979a). The dynamics of repeated glacial and interglacial events during the last million years may explain Alnus migration through the Central American filter (Gómez 1986, Rich and Rich 1983), as well as the loss and reestablishment of the contact between populations. Today, there is a clear pattern of several isolated regions of populations along the mountains in Costa Rica and Panama. This implies the loss of a continuum distribution. Thus, it is possible to think in a pattern of north to south of slow reduction in genetic variability along its geographical distribution in Costa Rica and Panama.
The altitudinal pattern of reduction in genetic variability with elevation could be explained by the frequency of natural catastrophies. North of these mountain range several active volcanoes are located that have produced repeated events of major impact during the last centuries (Alvarado 1994). This is particular clear in the Irazú region, where the last eruptions destroyed a large portion of Alnus habitats, enhancing severe and very recent bottlenecks in the populations from this area. Similarly, the relatively high frequency of earthquakes episodes in Central America during the last centuries (Alvarado 1994) has produced large impact and landslides up in the mountain ranges. Therefore, it may partially explain the reduced levels of genetic variation in populations from Irazú region, and clearly for the populations located near the summit of the mountains (Irazú, Turrialba, and Siberia populations). Also, with an increase in altitude there is a decrease in available surface. It is clear that the chances of establishing population depends largerly on suitable habitat areas (Mosseler 1995). Therefore, it is possible to think about a direct association between population size potential as well as population perpetuation potencial with available surface. Besides, with an increase in elevation there is a tendency in reducing the length of the dry season (Vargas 1994). During the dry season most of the pollen shedding in this wind pollinated species occurs (Vílchez and Murillo 1994), which could be severely reduced during the rain season.
Isolation by distance: The results of the FST method suggest that there occurs a generally extensive migration (M > 1) among populations as well as among regions of populations. According to Wright (1943 in Yang and Yeh 1995), random drift would result in substantial local differentiation if M < 1, but not if M > 1. The absence of private alleles at the single population level and the fact that all populations contain between 70 to 90% of the polymorphic alleles, suggest extensive gene flow among populations (Slatkin 1985). However, based on the confidence intervals and the broad range of values for b generated by bootstrapping, the slope of the regression b was found significantly below from zero in both cases. Similar patterns of results have also been found in studies with Pinus contorta (Yang and Yeh 1995). These values of genetic variation are larger than previously reported among natural populations for other Alnus species in Canada across longer geographical ranges (Bousquet et al. 1987a, b, c). But in these other cases, it was pointed out that there was a similarity between the sites being sampled in terms of climate and edaphic factors. Besides, the species was abundant, having their stands not much isolated from each other. Thus, despite extensive gene flow, a slight but significant pattern of isolation by distance was found. That means, that gene exchange between pairs of populations appears to be partially dependent on their geographic distance. This observed pattern could be explained by a linear continuum model or one dimensional stepping stone model (Kimura and Weiss 1964), since this tree species occurs almost linearly along the high elevations in the mountain ranges of Costa Rica and Panama (Anonymous 1995). These results are consistent with the previous discussion on reduction of genetic variability along the geographical variables analyzed. However, it is important to mention that (1) no private alleles were found at the single population level, (2) that some of the correlations were still slightly significative and (3) that the pattern of isolation by distance was rather weak. Therefore, the model of isolation by distance as well as the reduction of genetic variability with regressive latitude across Costa Rica and Panama must be considered as preliminary. More extensive sampling of trees and populations are needed to confirm the patterns observed. Especially important would be the study of natural populations in other disjunctions of Alnus occurrence in Latin America.
Acknowledgements
This research was possible by a Doctoral Grant given to the first author by the German Academic Exchange Service (DAAD), as well as the financial support from the Institute of Forest Genetics at Göttingen University, Germany, Instituto Tecnológico de Costa Rica, International Foundation for Science (IFS Grant D/1943-1) and the IPGRI-CIFOR (Grant 96/073). We are also especially debt to H.H. Hattemer for his valuable advise and support.
Resumen
Diecisiete poblaciones naturales de esta especie forestal en Costa Rica y Panamá, fueron investigadas en relación con sus patrones de flujo genético y de variación geográfica. El análisis de flujo genético fue basado en los métodos de los alelos raros y de FST (Indice de similaridad genética M). Los análisis fueron a su vez basados en los únicos cuatro loci genéticos de un total de 22 investigados que mostraron polimorfismo (PGI-B, PGM-A, MNR-A and IDH-A). Los análisis de variación geográfica fueron basados en el desarrollo de correlaciones de Pearson entre 4 variables geográficas y 14 variables genéticas. Alguna evidencia de aislamiento por distancia así como un débil flujo genético entre regiones geográficas fue encontrado. Fueron también observados patrones de variación clinal en relación con la altitud (r = -0.62 para la diversidad genética) y latitud (r= -0.77 en PGI-B3), que apoyan la hipotesis de aislamiento por distancia para esta especie. No se encontraron alelos privados en ninguna de las poblaciones investigadas.
References
Alvarado, G. 1994. Historia Natural Antigua. Tecnológica de Costa Rica. Cartago, Costa Rica. 232 p. [ Links ]
Alvarez, V.H. (1956). Estudio forestal del jaúl Alnus jorullensis (HBK) en Costa Rica. Tesis. M.Sc. IICA.Turrialba, Costa Rica, 96 p. [ Links ]
Anonymous. 1995. jaúl. Alnus acuminata ssp. arguta (Schlectendal) Furlow. Especie de árbol de uso múltiple en América Central. Colección de Guías Silviculturales No. 18. Turrialba, Costa Rica. 85 p. [ Links ]
Bergmann, F. 1978. The allelic distribution at an acid phosphatase locus in Norway spruce (Picea abies) along similar climatic gradients. Theor. Appl. Genet. 52: 57-64. [ Links ]
Bergmann, F. & H.-R.Gregorius. 1993. Ecogeographical distribution and thermostability of isocitrate dehydrogenase (IDH) alloenzymes in European silver fir (Abies alba). Biochem. Syst. Ecol. 21: 597-605. [ Links ]
Boshier, D.H., M. R.Chase & K.S.Bawa. 1995. Population genetics of Cordia alliodora (Boraginaceae), a neotropical tree. 3. Gene flow, neighborhood, and population substructure. Am. J. Bot. 82: 484-490. [ Links ]
Bousquet, J., W.M. Cheliak & M. Lalonde. 1987a. Allozyme variability in natural populations of green alder (Alnus crispa) in Quebec. Genome 29: 345-352. [ Links ]
Bousquet, J., W.M. Cheliak & M. Lalonde. 1987b. Genetic differentiation among 22 mature populations of green alder (Alnus crispa) in central Quebec. Can. J. For. Res. 17: 219-227. [ Links ]
Bousquet, J., W.M. Cheliak & M. Lalonde. 1987c. Genetic diversity within and among juvenile populations of green alder (Alnus crispa) in Canada. Physiol. Pl. 70: 311-318. [ Links ]
Camacho, P. & O. Murillo. 1986. Algunos resultados preliminares de la epidometría del jaúl: Alnus acuminata (H.B.K.), O.Kuntze. Cartago, Costa Rica. Instituto Tecnológico de Costa Rica. Depto. de Ing. Forestal. 110 p. [ Links ]
Cheliak, W.M. & J.A.Pitel. 1984. Techniques for Starch Gel Electrophoresis of Enzymes from Forest Tree Species. Information Report Pl-X-42. Petawawa National Forestry Institute. Canadian Forestry Service. 49 p. [ Links ]
Coen, E. 1983. Climate, p 35-46. In: Janzen, D.H. (ed.). Costa Rican Natural History The University of Chicago, Chicago, Illinois. [ Links ]
Couto-Alfenas, A., I. Peters, W. Brune & G.C. Passador. 1991. Eletroforese de Proteínas e Isoenzimas de Fungos e Essncias Florestais. Universidad Federal de Viosa. Brasil. 242 p. [ Links ]
.Furlow, J.J. 1979a. The systematics of the American species of Alnus (Betulaceae). Part I. Rhodora 81: 1-121. [ Links ]
Furlow, J.J. 1979b. The systematics of the American species of Alnus (Betulaceae). Part II. Rhodora 81: 151-248. [ Links ]
Gallant, S.L., R.F., Preziosi & D.J. Fairbairn. 1993. Clinal variation in eastern populations of the waterstrider Aquarius remigis: Gradual intergradation or discontinuity? Evolution 47: 957-964. [ Links ]
Gómez, L.D. 1986. Vegetación de Costa Rica. EUNED. San José, Costa Rica. 327 p. [ Links ]
Gregorius, H.-R. 1980. The probability of losing an allele when diploid genotypes are sampled. Biometrics 36: 643-652. [ Links ]
Hamrick, J.L. & D.A.Murawski. 1991. Levels of allozyme diversity in populations of uncommon neotropical tree species. J. Trop. Ecol. 7: 395-399. [ Links ]
Hartl, D. 1980. Principles of Population Genetics. Sinauer Associates, Massachussets. 488 p. [ Links ]
Hattemer, H.H., F.,Bergmann & M.Ziehe. 1993. Einführung in die Genetik für Studierende der Forstwissenschaft. J.D. Sauerländers Verlag. Frankfurt am Main. 492 p. [ Links ]
Kimura, M. & G.H.Weiss. 1964. The stepping stone model of population structure and the decrease of genetic correlation with distance. Genetics 49: 561-576. [ Links ]
Konnert, M. & F. Bergmann. 1995. The geographical distribution of genetic variation of silver fir (Abies alba, Pinaceae) in relation to its migration history. Pl. Syst. Evol. 196: 19-30 [ Links ]
Lamprecht, H. 1990. Alnus jorullensis (= A. acuminata). (Betulaceae). P. 252-254. In: GTZ. Silvicultura en los Trópicos. Los ecosistemas forestales en los bosques tropicales y sus especies arbóreas-posibilidades y métodos para un aprovechamiento sostenido. Eschborn, Germany. [ Links ]
Liengsiri, C., , C.Piewluang & T.J.B.Boyle. 1990. Starch Gel Electrophoresis of Tropical Trees. A Manual. ASEAN-Canada Forest Tree Seed Centre and Petawawa National Forestry Institute. Bangkok, Thailand. 51 p [ Links ]
Mosseler, A. 1995. Red pine: A model for the loss of genetic diversity in trees. p 359-370. In: Baradat, Ph., Adams, W.T. and Müller-Stark, G. (eds.). Population Genetics and Genetic Conservation of Forest Trees, SPB Academic Publishing, Amsterdam, The Netherlands. [ Links ]
Murillo, O. & H.H.Hattemer. 1997. Inheritance of isozyme variants of Alnus acuminata ssp. arguta (Schlectendal) Furlow. Silvae Genetica 46 (1): 51-55. [ Links ]
Murillo, O., 1997.Genetische Untersuchungen in natürliche Populationen von Alnus acuminata ssp. arguta (Schlectendal) Furlow in Costa Rica und Panamá. Cuvillier, Göttingen, Germany. 145 p. [ Links ]
Rich, P.V. & T.H. Rich. 1983. The Central American dispersal route: biotic history and paleogeography. p 12-34. In: Janzen, D.H. (ed.). Costa Rican Natural History. The University of Chicago, Chicago, Illinois. [ Links ]
Slatkin, M. 1981. Estimating levels of gene flow in natural populations. Genetics 99: 323-335. [ Links ]
Slatkin, M 1985. Rare alleles as indicators of gene flow. Evolution 39: 53-65. [ Links ]
Slatkin, M 1993. Isolation by distance in equilibrium and non-equilibrium populations. Evolution 47: 264-279. [ Links ]
Slatkin, M. & A. Barton. 1989. A comparison of three indirect methods for estimating average levels of gene flow. Evolution 43: 1349-1368. [ Links ]
Soltis, D.E. & P.S.Soltis. 1989. Isozymes in Plant Biology. Advances in Plant Sciences Series. Vol 4. Dioscorides. Portland, Oregon. 268 p. [ Links ]
Vargas U., G. 1994. El clima de Costa Rica: Contraste de dos vertientes. Cuadernos para la Enseñanza de los Estudios Sociales. Escuela de Historia y Geografía. Universidad de Costa Rica. Guayacán. San José, Costa Rica. 42 p. [ Links ]
Vázquez, A. 1983. Soils. P. 63-65. In: Janzen, D.H. (ed.). Costa Rican Natural History. The University of Chicago, Chicago, Illinois. [ Links ]
Vílchez, B. & O. Murillo. 1994. Análisis fenológico y de la biología reproductiva del jaúl (Alnus acuminata) en Costa Rica. Tecnología en Marcha 12: 65-73. [ Links ]
Yang, R.C. & F. Yeh. 1995. Patterns of gene flow and geographic structure in Pinus contorta Dougl. Forest Genetics 2: 65-75. [ Links ]
1 Instituto Tecnológico de Costa Rica, Escuela de Ing. Forestal. Apartado 159 7050 Cartago, Costa Rica.
Fax: 591-4182. e-mail: omurillo@itcr..ac.cr
2 Universidad de Costa Rica, Escuela de Biología, Campus San Pedro, San José, Costa Rica. e-mail:
ojrocha@ucr.ac.cr

