


 Spanish (pdf)
 Article in xml format
 Article references
 Send this article by e-mail
 Cited by SciELO
  Similars in
SciELO
Similars in
SciELO 
 Permalink
Introduction
Cancer refers to a group of diseases characterized by uncontrolled cell growth (Fernandis & Wenk, 2009; Kenchegowda et al., 2022). The intratumoral heterogeneity promotes cancer genomic instability due to variability in drug resistance pattern at the single cells level which ensures tumor robustness (Lukow & Sheltzer, 2021; Kitano, 2004). To address this level of complexity, is necessary to identify biosensors able to report chemosensitivity with single cell resolution (Barteneva, Fasler-Kan, & Vorobjev, 2012; Chuan Yang, Caibo Yang, Yosef Yarden, K.W.To & Liwu Fu, 2021).
The sphingolipid pathway (SLP) has a significant role in sensing the activity of different chemotherapeutic agents which could afford to overcome drug resistance (Dupre et al., 2017; Ogretmen, 2017; Van Meer, Wolthoorn & Degroote, 2003), thus, we suggest to study the behavior of this signaling pathway as sensor of cellular stress induced by chemotherapeutic treatments.
The SLP is a complex biological system integrating different responses of cell stress and kinetic phenotypes in order to induce death of cells (Molina-Mora et al., 2018; Morales, Lee, Goñi, Kolesnick & Fernandez-Checa, 2007). The balance within sphingolipids (SL) determines cell fate (Iessi et al., 2020; Tepper et al., 2000). Concentration ratios among ceramide, sphingosine and sphingosine-1-phosphate, which are convertible metabolites, are determinant in defining cell fate. The balance between pro-death and pro-survival metabolites is termed sphingolipid rheostat (Mora et al., 2010).
In this way, previous studies indicate that understanding SL dynamics allows the manipulation of cell fate for improving the response to chemotherapy (Dyatlovitskaya,
Kandyba, Kozlov & Somova, 2001; Kroll, Cho & Kang, 2020; Ogretmen, 2006). In order to predict chemotherapy response and infer how drugs disturb the SLP, we propose to evaluate SL dynamics in single cells using fluorescent sphingolipid analogues as a biosensor.
Notwithstanding the fact that the SLP has been extensively studied in SL transport and metabolism (Iessi et al., 2020; Singh, Marks & Pagano, 2007), the effects of the perturbations on the SL signaling pathway and the sphingolipid rheostat mechanisms remain unclear. Thus, the connections between chemotherapy and cell fate should be considered for the comprehension of the SLP complexity.
In this context, we have studied the complexity of the SL metabolic pathway and its relationship with cell viability using different approaches associated to mathematical models, cancer cell lines and perturbations. Our previous work was focused on the study of a BODIPY-FL fluorescent-sphingomyelin analog (SM-BOD) to decode the effect of known perturbations in SL-metabolism in a cancer cell line (Mora et al., 2010).
We have established three approaches to evaluate the hypothesis of the use of the SLP as a predictor of tumor chemosensitivity using cell lines of three different types of cancer. The development of those approaches has been achieved with three major mathematical models and complemented with two machine learning strategies (with regards to dimensionality reduction and classification).
First, the complexity of the SLP is related to the multiple inputs and outputs and it is regulated spatially, therefore we developed a systems approach to deconvolve SLP complexity and determine the differences associated to drug resistance. Thus, cells were exposed to SM-BOD and we assessed the kinetic changes in total cell fluorescence using imaging flow cytometry or fluorescent microscopy and an ordinary differential equation (ODE) model.
Second, with the aim of characterizing the heterogeneous response to perturbations, we implemented a Gaussian mixture model (GMM). This approach allowed to identify cell subpopulations based on different drugs sensitivities and patterns of heterogeneity signals (Singh et al., 2010).
Third, we implemented a fuzzy logic model (FLM) to relate SL composition and cell viability using fuzzy rules.
With our mathematical models, we have evaluated three cell lines of three different types of cancer.
Pancreatic cancer: previous studies reported that differences between gemcitabine (GMZ) resistant and sensitive cell lines were dependent on the SLP (Guillermet-Guibert et al., 2009; Mora-Rodriguez & Molina-Mora, 2017). ODE and GMM results demonstrate that fluorescent SM-BOD can present changes according to the sensitivity profile to chemotherapy in cancer cells and validate the pathway dynamics at the subpopulation level.
Breast cancer: we implemented two machine learning analyses to identify features related to SM-BOD metabolism as predictor of chemosensitivity in the MCF7 human breast cancer cell line. SM-BOD was then tracked over time to monitor fluorescence intensity and features with single cell resolution. Also, we tested chemotherapeutic drugs in the same cell line. Using a feature selection algorithm, the system complexity was reduced to less than 10% of features. To implement a classification analysis for recognizing sensitivity or resistant conditions, features were also evaluated with a decision tree algorithm. ODE and GMM were implemented to analyze the type of sensor response in this cell line.
Leukemia: we identified different patterns of chemosensitivity using a leukemia cell line. Double perturbations were tested using chemotherapy combinations, making possible the identification of semi-quantitative patterns between SL composition and cell fate.
Taken together, these approaches suggest a potential application of fluorescent SL analogues as biosensors of perturbation-response patterns to perform in vitro chemosensitivity assays capable of considering tumor heterogeneity to quantify the signaling dynamics of this pathway to overcome drug resistance.
Methodology
2.1 Cell culture, SM-BOD metabolism and cell viability assay
In order to evaluate SL composition and its relationship to chemosensitivity, three cancer cell lines were used: pancreatic cancer (a sensitive cell line called BxPC-3, and two resistant cell lines called MIAPaCa-2 and PANC-1), MCF-7 breast cancer and CCRF-CEM leukemic cell lines. Cell lines were cultured in RPMI medium (for leukemic cell line) or DMEM (others) containing 10% of fetal bovine serum and under standard conditions in 96well plates. The general strategy implied that cells were treated with a SM-BOD fluorescent probe analogous to sphingomyelin, which was incorporated into the metabolism by the respective cellular machinery, and then exposed to chemotherapies. In the 96 well plates, culture medium was removed and replaced with medium containing the respective chemotherapeutic agents, as detailed for each cell line.
In the case of the pancreatic cancer cell lines, assays were done with different concentrations of gemcitabine (GMZ). For the other cell lines, the employed concentrations were according to (Glaysher & Cree, 2011). For the breast cancer cell line, the selected chemotherapies were: vincristine (Vin), paclitaxel (Pac), gemcitabine (GMZ), cisplatin (Cis), etoposide (Eto), methotrexate (Met), 5-fluorouracil (5-fl), epirubicin (Epi) and mafosfamide (Maf). Combinations of these chemotherapeutic drugs were used in the treatment of breast cancer. For the leukemic cell line, the same drugs were evaluated but also included temozolomide (Tem).
The same cell lines from the previous section were used to evaluate the metabolism of the SM-BODIPY sensor (sphingomyelin analogue, SM-BOD). SL inhibitors and chemotherapies were added to the cell lines for 24 hours, as described above. Next, the cells were loaded with the fluorescent sensor (0.25 μM of SM-BOD) and incubated for a specific period of time. For all cell lines, the same inhibitors of the SLP enzymes were evaluated: SKI, PDMP, CKI, Des, DMAPP-M-NCI, D609, GW, FB1 and Myr. More details of the experimental conditions are presented in (Erlich et al., 1999; Lippert, Ruoff & Volm, 2008; Solomonov, Rumyantsev, Kochergin & Antina, 2014).
After the fluorescence images were acquired using a Cytation™ 3 automated microscope (Biotek), automatic image analysis with CellProfiler™ (Broad Institute) was implemented to obtain fluorescence features (green channel for SM-BOD) with single cell resolution and including intensity, texture and morphological features. These measurements served as input for the machine learning algorithms and mathematical models.
To evaluate chemosensitivity, cell viability and cell death assays were performed using Hoechst 33342 and propidium iodide (PI) stain assays. In 96 well plates, cells were grown and incubated for 24h. Subsequently, upon completion of incubation time, propidium iodide (PI) and Hoechst 33342 stains were added. Images were captured in the red (PI, dead cells) and blue (Hoescht 33342, all nuclei of all cells) channels of the fluorescence microscope. Cell viability was determined by the number of living cells for each condition with respect to the number of alive cells of the untreated control. Each condition was evaluated in triplicate. More details of the experimental conditions are presented in (Erlich et al., 1999; Lippert et al., 2008; Solomonov et al., 2014).
2.2 Machine learning algorithms
We implemented a classification analysis to assess the predictive value of different features in each cell after exposure to SM-BOD. C4.5 (J48) decision tree algorithm was implemented. Evaluation included analysis of subsets of features which were selected by a support-vector machine (SVM) algorithm to reduce dimensionality.
On the other hand, image analysis data obtained from flow cytometry and fluorescence microscopy were subjected to GMM analysis to identify heterogeneity profiles and identify equivalences between chemotherapies and inhibitors. See details in (Solomonov et al., 2014). The validation of the performance was based on the ability of the algorithms to keep the control conditions in a same cluster.
2.3 ODE and FLM models
In order to simulate the transit of SMBOD in cancer cells, an ordinary differential equations (ODE) model was implemented using the fluorescence intensity data obtained from the fluorescence features based on the SM-BOD dynamics acquired in the green channel. Different kinetics such as the law of mass action, Michaelis-Menten or Hill coefficient were used to model each reaction. The composition of SL was inferred using the adjusted model, and that composition was then used in a new model using fuzzy logic (FLM) to create rules that correlate SL contents and cell viability. Rules were generated using the ANFIS (Adaptative Neuro-Fuzzy Inference System) algorithm in MATLAB.
Note: derived from research.
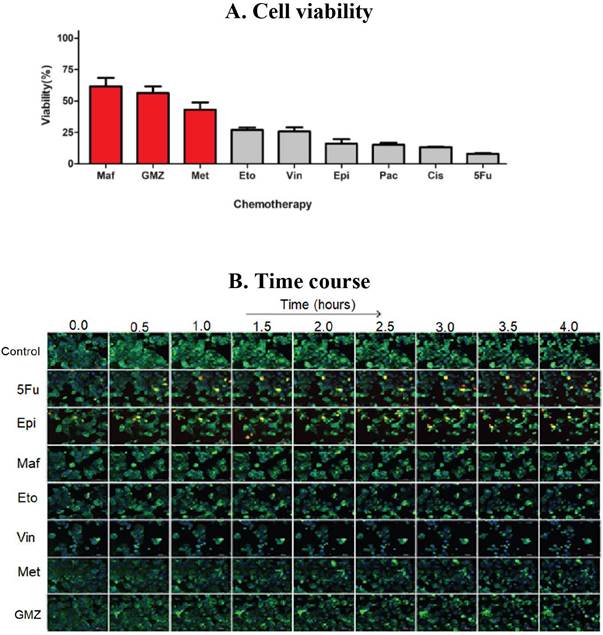
Figure 1 (A) Cell viability and (B) SM-BOD kinetics (after exposure to chemotherapies) of a breast cancer model of chemosensitivity/ chemoresistance as a proof of principle to evaluate a fluorescent sphingolipid analogue as predictor.
2.4 Simulations and validation assays
For MCF-7 breast cancer and CCRFCEM leukemic cell lines, we compared the inferred SL composition of double perturbations including inhibitor/chemotherapy with the experimentally obtained cell viability for those treatments. The validation of the variations in SL composition was performed for the pancreatic cancer cell line using thin layer chromatography (TLC), in which cell lines were compared for the content of several SL included also as standard controls. See details in (Lippert et al., 2008).
Analysis and results
Cell viability and SM-BOD kinetics: In order to identify the effect of different chemotherapies on cell fate of cancer cell lines, a viability assay was standardized.
For pancreatic cancer, BxPC-3 cells were considerably impacted after 72h with a reduced viability (down to 30% compared to control conditions) with GMZ. Contrarily, a dose-dependent reduction in cell viability was determined for both PANC-1 and MIAPaCa-2 cells, which suggest that GMZ induces an important cytostatic effect on the resistant cell lines. The evaluation of the MCF-7 human breast cancer cell line showed resistance to 3 chemotherapeutic drugs (mafosfamide, gemcitabine and methotrexate) but was sensitive to the other treatments (Figure 1-A). In addition, the CCRF-CEM leukemia cell line was sensitive to paclitaxel and vincristine, but this cell line was resistant to the remaining six chemotherapeutic agents.
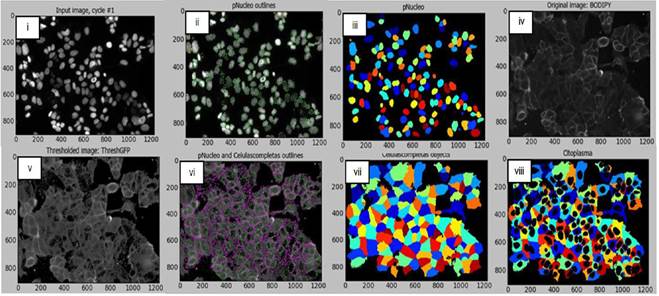
SM-BOD was added to cell lines to assess changes in cellular fluorescence (e.g. Figure 1-B for the breast cancer cell line). Intensity and distribution features were obtained from the time-resolved images. We then implemented an image analysis protocol/pipeline in CellProfiler™ for the image segmentation of both breast cancer and leukemic cell lines (shown in Figure 2 for breast cancer cell line) in order to automate features extraction for each cell.
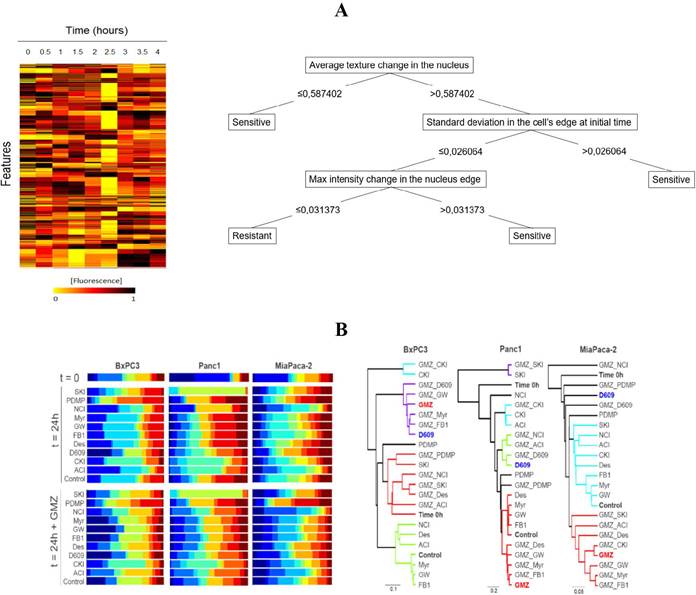
Machine learning approaches: In order to identify how different dynamical fluorescence features of the SM-BOD can be associated to chemosensitivity, we evaluated a classification technique using C4.5 (J48) decision tree algorithm. For this, feature reduction was performed to select features associated to categories of resistant or sensitive (Figure 3-A for breast cancer cell line). Temporal changes were evident (left) and reduction to 51 features enabled to classify cells with greater than 95% precision (tree not shown), but interestingly only three features could classify with a precision of 73% using the decision tree (Figure 3-A right). For the CCRF-CEM leukemia cell line, a similar reduction was done from 401 to 41 features and again with greater than 95% precision (tree not shown).
Note: derived from research.
Figure 3 The use of a fluorescent SL sensor enables population-based data mining to predict chemosensitivity and inference on how the chemotherapy perturbs the SLP. (A) Data of intensity/distribution features on the breast cancer model allows the construction of decision trees for the prediction of chemosensitivity. (B) Gaussian mixture modeling (GMM) of the population of pancreatic cancer cells leads to the inference on how gemcitabine (GMZ) perturbs the SLP by the similarity of the population-based heterogeneity profiles to known inhibitors of the SLP.
Furthermore, a GMM model was developed to predict the effect of chemotherapies on the SLP and to establish a heterogeneity profile for each perturbation as a fingerprint pattern (e.g. Figure 3-B for pancreatic cancer). Finally, a clustering analysis was performed, using Euler distance and statistical significance of 0.05 for the evaluation of the similarities of such fingerprints. According to the GMM analysis, the GMZ sensitive pancreatic cancer cell line (BxPC-3) showed that D609 inhibitor and GMZ produced comparable heterogeneity profiles, which suggest that the modification upon the SLP of both treatments induce a similar response. For the breast cancer cell line, the GMM suggested pairs of clusters composed of chemotherapy/inhibitor between FEC/myriocin, methotrexate/myriocin, epirrubicin/PDMP, gemcitabin/SKI, vincristine/SKI, mafosfamide/NCI and finally EC/desipramine, suggesting a large number of chemotherapeutic drugs sensed in the SLP. In the case of the leukemic cell line, clusters obtained were FB-Tem, NCIMet, SKI-Pac, and D609-Doxorubicin (Doxo). All these relationships suggest that those respective paired perturbations were sensed similarly by the SLP.
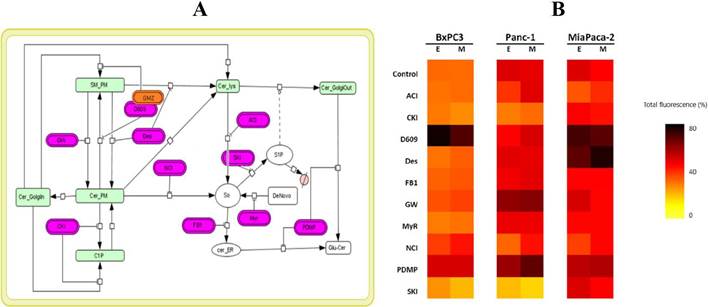
ODE-models: We built a SL metabolic pathway topology based on available data and literature. The model was fitted to imaging to estimate parameters and SL-composition per condition. For pancreatic cancer cell lines, the same network topology was established (Figure 4-A); nonetheless, the SL profile was different for each cell model (Figure 4-B). Similar results were obtained with leukemia and breast cancer cell lines.
Note: derived from research.
Figure 4 The use of fluorescent SL sensor enables the construction of ordinary differential equation (ODE) models (topology in A) to estimate the rates of the reactions involved in the metabolism of this SL analogue and changes in the relative composition of SL species upon perturbations (B). E: experiment, M: model.
Hybrid model and experimental validation: The study of the fluorescent-SL composition allowed to validate the changes in fluorescence intensities between sensitive and resistant cells obtained from the SL-sensor metabolism upon chemotherapies.
SL were inferred using the hybrid model with differential equations and the Gaussian model. For pancreatic cancer cell lines, prediction of the increment in ceramide (Cer) and glucosylceramide (Glu-Cer) content after exposure to GMZ was validated using TLC, as shown in Figure 5-A.
In the next step we tested MCF7 and CCRF-CEM cell lines to evaluate the robustness of our approach with more chemotherapeutic drugs. For the MCF-7 breast cancer cell line, cell viability was experimentally obtained for single and double perturbations of inhibitor and chemotherapy. However, the cell lines were sensitive to the majority of the single perturbations. In order to have a better scenario for studying resistance, we developed another approach using the CCRF-CEM cell line, which showed resistance to 6 of the 8 evaluated chemotherapies.
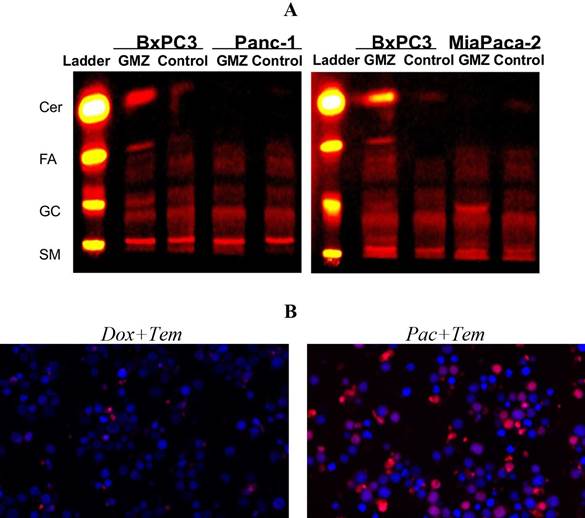
Note: derived from research.
Figure 5 Validation assays for the hybrid mathematical modeling approach of the SL sensor as predictor of chemosensitivity allows the formulation of experimentally-testable hypothesis. (A) Pancreatic cancer cell line using TLC, in which the prediction of changes in SL composition was validated. (B) Predictions of cell viability on a leukemia cell line after double chemotherapeutic treatments were validated experimentally.
Finally, the FLM was used to correlate SL composition to cell viability. Double perturbations were evaluated to predict cell viability (six combinations). Predictions showed an outstanding performance when results were compared to the experimental validation assay (Figure 5-B). Taken together, these findings indicate that the fluorescent sphingolipid analogues can be used as biosensors of chemosensitivity to identify chemotherapeutic regimes overcoming drug resistance.
Discussion
Considering the highlight functions of the SLP in cell processes related to signaling, metabolism and cell death/survival, the use of SL sensors in cancer can be used to measure chemosensitivity (Lippert et al., 2008; Quirós-Fernandez, I; Molina-Mora, JA, Kop-Monteo, M; Salas-Hidalgo. E; Mora-Rodriguez, 2018). In this context, targeting of the SLP is a potential approach to overcome chemotherapy resistance (Truman, García-Barros, Obeid & Hannun, 2014; Van Meer et al., 2003). In this context, SM-BOD has been widely used in several reports to measure SL metabolism in cells (Erlich et al., 1999; Mora et al., 2010; Solomonov et al., 2014).
Here we employed different experiments and mathematical models for describing the effects of chemotherapy on SLP and cell fate. We performed a perturbation-specific profile of cell heterogeneity for clustering the studied perturbations. GMM analysis led to discriminate different classes of perturbations based on possible relationships chemotherapy-inhibitor which can modulate the effects on the SLP (Molina-Mora et al., 2018; Molina-Mora & Mora-Rodriguez, 2016; Slack, Martinez, Wu & Altschuler, 2008). In the case of the pancreatic cancer cell lines, according to clustering analysis, the GMM indicates that gemcitabine and D609 have similar effects on the SLP. Clustering analysis of the breast cancer cell line data found 7 chemotherapies which were mapped to known perturbations in the SLP, meanwhile for the leukemic cell line, 4 chemotherapies were sensed in the SLP. All these relationships suggest that those chemotherapies perturb the SLP in a similar way. This is particularly important in cancer biology, since these results can identify specific responses to drugs, in part due to the heterogeneity.
Remarkably, these results have not been reported before. Indeed, there are a limited amount of scientific studies related to how perturbations can affect SLP (Bonhoure et al., 2006; Hannun & Obeid, 2008; Lacour et al., 2004; Machala et al., 2019). This information indicates that the chemotherapy response is dependent on the cancer type (tumor or cell line) and specific analyses are required.
Furthermore, some chemotherapies were not sensed in the SLP for neither breast cancer nor leukemia cell lines, which may not be related to any of the SL inhibitors (Bensimon, Heck & Aebersold, 2012).
To describe the metabolism of SMBOD in cell lines, total fluorescence data of perturbations were used for fitting an ODE model on a systems biology approach. In this model, we assumed that the addition of SM-BOD promotes the internalization and remains mostly in the plasma membrane (Koval & Pagano, 1991). The transit of SM-BOD for each cell line is simulated with the mathematical approach. The model was built using ODEs and it describes the SL composition for each cell line, inhibitory perturbations and single or double perturbations with chemotherapeutic treatments.
For pancreatic cancer cell lines, predictions of the mathematical model were validated by TLC, showing an increment in the ceramide content in the BxPC-3 sensitive cell line when exposed to gemcitabine. For the MCF-7 breast cancer cell line, double perturbations (inhibitor and chemotherapy) were tested. More chemotherapeutic treatments were included, and the SL composition was inferred by ODE/ GMM models. Different SL compositions were achieved for different chemosensitivity levels. To correlate the SL profile to cell viability and to infer rules, we implemented the FLM as is common for data analysis in biological studies (Al Daoud & Al-Daoud, 2010; Bosl, 2007; Torshabi, Riboldi, Fooladi, Mosalla & Baroni, 2013). Thus, the prediction of viability for double perturbations with chemotherapy were inferred from ODE/GMM/FLM models. A viability assay confirmed that the hybrid approach is able to predict cell viability when cells are exposed to double perturbations.
The hybrid models inferred that different chemotherapies triggered different mechanisms of cellular stress on the SLP, and the subsequent signaling is responsible for a specific SL balance which finally decides cell fate, as has been previously demonstrated by others (Chai et al., 2011; Molino, Tate, McKillop & Medin, 2017; Tepper et al., 2000).
Conclusions
Taking all together, our complex approach to study SL using SM-BOD was able to recognize particular features in cells, which can be useful to study cancer. As it was demonstrated, the balance in the SLP can be used as a biosensor of cancer chemosensitivity. This proof of principle was demonstrated using not only different experimental data derived from fluorescence microscopy, imaging and mathematical modeling, but also including an experimental validation (TLC and cell viability assays). At the clinical setting, these findings are interesting because they can be potentially implemented in personalized strategies to model chemosensitivity and to enhance therapeutic decisions in benefit of the patients. Further analyses are required to make this possible, but the results presented here pave the way for a translational research on SL-based chemosensitivy in cancer patients.
Author contribution statement
All the authors declare that the final version of this paper was read and approved. The total contribution percentage for the conceptualization, preparation, and correction of this paper was as follows: J.A.M.M 30%., S.M.P. 10%, I.Q.F. 10%, M.K.F. 5%, A.R.C. 5%, S.Q.5 %, F.S. 5% and R.M. 30%.

