


 English (pdf)
 Article in xml format
 Article references
 Send this article by e-mail
 Cited by SciELO
  Similars in
SciELO
Similars in
SciELO 
 Permalink
Introduction
Hereditary gingival fibromatosis (HGF) is a rare genetic condition characterized by progressive enlargement of the gingiva, which can inter- fere with normal chewing and speech (1, 2). It is inherited as an autosomal dominant trait with an incidence of 1: 350000.HGF, characterized by firm, pink, and enlarged gingival tissue. It is usually seen after permanent tooth eruption and affects both maxillary and mandibular arches. It can be generalized or localized and is rarely present at birth (3).
Gingival hypertrophy, a condition causing excessive gum growth, can occur during child- hood or adolescence and cause both upper and lower gums to become thick, firm, and enlarged. The exact cause is unknown, but mutations in certain genes cause abnormal growth. Symptoms include difficulty speaking, eating, oral hygiene, bleeding, discomfort, and psychological distress (4, 5). Diagnosis involves a thorough examination, medical history, and genetic testing to confirm the presence of specific gene mutations. Differentiating HGF from drug-induced gingival hyperplasia (GHID) is crucial, as GHID typically appears after prolonged medication use and is associated with inflammation and periodontal problems. While the prevalence of HGF is undetermined, it can appear in familial cases, and its underlying causes remain unclear, though increased fibroblast activity and altered collagen production have been noted (6).
Identifying interatomic hub genes is crucial for understanding key players and central regulatory nodes in complex biological networks. These genes influence the behavior of other genes, providing insights into molecular mechanisms and pathways in a particular biological process or disease (7, 8). Understanding these genes can guide the development of targeted therapeutic interventions and new strategies (9). For example, in hereditary gingival enlargement, identifying these genes can provide clues about dysregulated pathways and cellular processes, guiding the development of new therapeutic strategies and drug targets. They can also be biomarkers for disease diagnosis, prognosis, and treatment response prediction (10).
Predicting interactome hub genes also has implications for clinical management and personalized medicine. They can be biomarkers for disease diagnosis, prognosis, and treatment response prediction. Researchers classify patient subgroups based on hub gene expression profiles to identify high-risk individuals, tailor treatment strategies, and monitor treatment response. Network-based methods predict interactome hub genes, enabling targeted therapies, drug targets, and personalized treatment approaches (11).
Neural networks are machine learning models that can predict interactome hub genes by analyzing gene expression and protein-protein interaction data. Neural networks are powerful computational tools that accurately predict interactome hub genes by capturing complex nonlinear relationships between genes and their interactions. They can integrate various data types, such as gene expression and protein-protein interaction data. They can be combined with network- based approaches to enhance our understanding of biological network organization and disease drivers. Therefore, our study aims to predict the interatomic hub genes using neural networks for hereditary gingival fibromatosis.
materials AND methods
Differential gene expression
We followed the following methods to identify the top differentially expressed genes in the GEO dataset GSE4250 using the geor2 tool. The GEO dataset (12) GSE4250 was downloaded from the NCBI GEO database and used for analysis using the GEOR2 tool, and statistical tests like t-tests were chosen for differential expression analysis.
The study used the geor2 tool to analyze differentially expressed genes, identifying top genes based on fold change values or adjusted p-values. The results were analyzed using gene ontology enrichment analysis or pathway analysis tools.
Cytoscape and cytohubba
The study used Cytoscape (13) to construct the interactome of differentially expressed genes in the GEO dataset GSE4250. The list of genes was imported, along with their fold change values. The protein-protein interaction data was retrieved from databases like STRING or BioGRID.interactome network was visualized in Cytoscape, representing genes as nodes and protein-protein interactions. CytoHubba plugin was used to identify hub genes, using algorithms for network centrality measures. The algorithm in CytoHubba ranked hub genes based on centrality scores using maximum clique centrality, providing insights into influential genes within differentially expressed gene networks for further investigation (13).
Machine learning of hub genes - neural networks of hub genes
Identified hub genes from cytohubba and were labeled, data were normalized, and missing values were cleaned and subjected to neural networks with 80 percent training, and 20 percent test and hub-non-hub genes were labeled and predicted.
Neural network architecture
The neural network architecture, consisting of a hidden layer with 50 neurons, can predict interactome using hyperparameters, employing the ReLU activation function. Regularization prevents overfitting in neural network models using L2 regularization with a parameter of 0.001. The Adam optimizer, an extension of SGD, adapts the learning rate during training by combining AdaGrad and RMSprop algorithms. It is known for its efficiency and large dataset handling. The model is trained using a 90-iteration maximum and adjusts its weights based on training data and the chosen optimization algorithm. Validation data is used to monitor performance and prevent overfitting. The neural network architecture and hyperparameters can be adjusted based on the specific interactome prediction task.
Results
The network, with 147 nodes and 1092 edges, is large and connected, with each node having 13.701 neighbors, indicating a dense network with numerous connections. The network has a diameter of 5 and a radius of 3, with a characteristic path length of 2.285. It exhibits clustering, with nodes forming groups and a network density of 0.094. The network hetero- geneity is moderate, with moderate variation in connections. The network centralization is 0.176, promoting a balanced structure.
The network is a cohesive unit with no isolated parts, promoting efficient communication and information flow. The analysis time is 0.544 seconds, indicating the computational efficiency of the analysis method used. The network's structure is balanced and distributed, with no single node having a disproportionately large number of connections.
Figure 1 presents a volcano plot illustrating the top differentially expressed genes associated with hereditary gingival fibromatosis. The x-axis represents the log2 fold change in gene expression, while the y-axis shows the -log10 p-value, highlighting the statistical significance. Genes with higher fold changes and lower p-values appear toward the outer edges of the plot. Genes on the right side of the plot are upregulated, while those on the left are downregulated. The figure effecti- vely identifies significantly altered genes in HGF, providing insights into potential molecular mechanisms underlying the condition.
Figure 2.A displays a network diagram repre- senting the interactome of the top 250 genes identi- fied through differential gene expression analysis in hereditary gingival fibromatosis. Nodes in the network represent individual genes, while edges denote protein-protein interactions between them. The network's structure highlights key relations- hips and connectivity patterns among these genes, aiding in the identification of central or hub genes that may play crucial roles in the disease's molecular mechanisms. The figure provides a visual summary of the gene interaction landscape associated with hereditary gingival fibromatosis, offering insights into potential therapeutic targets.
Figure 2.B illustrates the interaction network of the top 50 hub genes associated with hereditary gingival fibromatosis. Nodes represent hub genes, while the edges indicate protein-protein interactions between them. The color gradient from yellow to red signifies the ranking of hub genes based on centrality, with red nodes represen- ting the most central and influential genes. The dense connectivity within this network highlights the critical roles these hub genes may play in regulating key pathways related to the disease, offering potential targets for further investigation into therapeutic interventions.
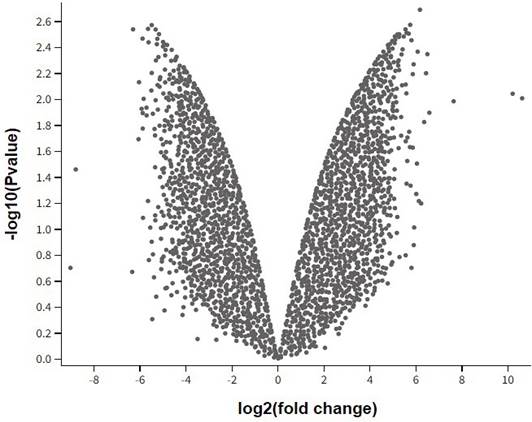
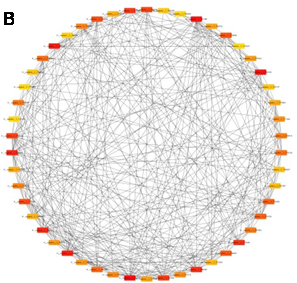
Table 1 shows that the neural network model effectively predicted interactome hub genes in hereditary gingival enlargement, with an AUC of 0.853, classification accuracy of 0.720, F1 score of 0.720, precision of 0.720, recall of 0.720, and specificity of 0.720.
Figure 3.A presents a SHAP (SHapley Additive exPlanations) plot illustrating the importance of key features in the accuracy of the neural network model predicting hub genes in hereditary gingival fibromatosis. The horizontal bar chart displays three features-P.Value, F-statistic (F), and adjusted P.Value (adj.P.Val)-plotted against a scale representing the decrease in AUC (Area Under the Curve). The P.Value bar, which extends to 0.32, indicates the most significant impact on the model's perfor- mance, while F and adj.P.Val contribute progres- sively less to model accuracy. This figure provides insights into how each feature influences the predictive power of the model, with P.Value being the dominant contributor.
Figure 3.B depicts the confusion matrix used to evaluate the performance of the neural network model in classifying hub and non-hub genes associated with hereditary gingival fibromatosis. The matrix shows actual versus predicted classes for 50 instances, with 25 instances per class ('hub' and 'non-hub'). True Positives (TP) indicate the model correctly identified 72.0% of hub genes, while False Negatives (FN) reflect that the model misclassified 28.0% of hub genes as non-hub. False Positives (FP) also account for 28.0%, representing non-hub genes incorrectly predicted as hub. This matrix highlights the classification accuracy and the top ten hub genes involved in hereditary gingival fibromatosis: SPTA1, MYBPC1, IVNS1ABP, PLA2G2A, PTPN1, IFIH1, SNX13, PCSK1, HCN1, and PAPPA2.
Table 2 shows the Kegg biological pathway of these hub genes. This table provides a comprehensive overview of biological pathways, their statis- tical measures, and their association with specific conditions or groups. It includes an index, a name, an adjusted p-value, an odds ratio, and a combined score. The index ranks the pathway, the name describes its description, and the p-value measures statistical significance. The odds ratio indicates the likelihood of enrichment between groups.
Table 3 summarizes the molecular functions associated with hub genes identified in hereditary gingival fibromatosis. Each entry details a specific Gene Ontology (GO) term related to the function of these genes, ranked by statistical significance. The table presents the p-value, adjusted p-value, odds ratio, and combined score for each molecular function. Notably, Zinc Ion Binding (GO:0008270) shows the lowest p-value (0.0005394) and the highest odds ratio (24.92), indicating a strong association with the hub genes. Other significant functions include Transition Metal Ion Binding (GO:0046914) and Intracellular cAMP- activated Cation Channel Activity (GO:0005222), with odds ratios of 18.48 and 317.19, respectively, highlighting their critical roles in biological processes. Functions such as Calcium-Dependent Phospholipase A2 Activity and Ephrin Receptor Binding further illustrate the diverse roles these hub genes play. This table underscores the impor- tance of these molecular functions in elucidating the mechanisms underlying hereditary gingival fibromatosis, potentially guiding future therapeutic strategies.
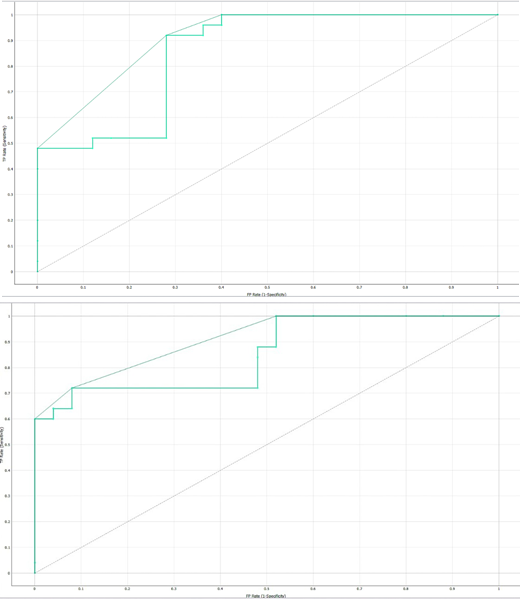
Figure 4.A presents the Receiver Operating Characteristic (ROC) curve for the classification of non-hub genes in hereditary gingival fibromatosis. The curve illustrates the trade-off between sensitivity (true positive rate) and specificity (false positive rate) of the neural network model. A higher Area Under the Curve (AUC) value indicates a better model performance in distinguishing non-hub genes from hub genes, providing a measure of the model's predictive accuracy. This curve is a key metric for evaluating how effectively the model identifies non-hub genes in comparison to hub genes.
Figure 4.B illustrates the Receiver Operating Characteristic (ROC) curve for the classification of hub genes in hereditary gingival fibromatosis. This curve demonstrates the model's performance in differentiating hub genes from non-hub genes by plotting the true positive rate (sensitivity) against the false positive rate (1-specificity). A higher Area Under the Curve (AUC) value indicates superior classification accuracy, signifying that the model is effective in correctly identifying hub genes. This ROC curve serves as a vital tool for assessing the predictive capability of the neural network model specifically for hub gene classification within the context of hereditary gingival fibromatosis.
Table 1 Neural network.
| Model | AUC | CA | F1 | Precision | Recall | Specificity |
|---|---|---|---|---|---|---|
| Neural Network | 0.853 | 0.720 | 0.720 | 0.720 | 0.720 | 0.720 |
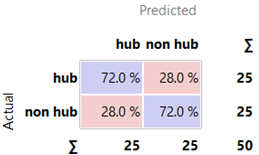
Figure 3 A. SHAP Plot of Feature Importance in Predicting Hub Genes in Hereditary Gingival Fibromatosis. B. Confusion Matrix for Predicting Hub Genes in Hereditary Gingival Fibromatosis.
Table 2 Kegg biological pathway of hub genes.
| Index | Name | p-value | Adjusted p-value | Odds Ratio | Combined score |
|---|---|---|---|---|---|
| 1 | Alpha-Linolenic acid metabolism | 0.01243 | 0.08736 | 92.44 | 405.55 |
| 2 | Linoleic acid metabolism | 0.01441 | 0.08736 | 79.21 | 335.86 |
| 3 | Fat digestion and absorption | 0.0213 | 0.08736 | 52.77 | 203.13 |
| 4 | Ether lipid metabolism | 0.02424 | 0.08736 | 46.16 | 171.72 |
| 5 | Arachidonic acid metabolism | 0.03009 | 0.08736 | 36.91 | 129.31 |
| 6 | GnRH secretion | 0.03155 | 0.08736 | 35.14 | 121.47 |
| 7 | RIG-I-like receptor signaling pathway | 0.03446 | 0.08736 | 32.08 | 108.04 |
| 8 | Adherens junction | 0.03495 | 0.08736 | 31.62 | 106.05 |
| 9 | Glycerophospholipid metabolism | 0.04794 | 0.09172 | 22.79 | 69.22 |
| 10 | Pancreatic secretion | 0.04986 | 0.09172 | 21.88 | 65.61 |
Table 3 Molecular function of hub genes.
| Index | Name | p-value | Adjusted p-value | Odds Ratio | Combined score |
|---|---|---|---|---|---|
| 1 | Zinc Ion Binding (GO:0008270) | 0.0005394 | 0.02265 | 24.92 | 187.51 |
| 2 | Transition Metal Ion Binding (GO:0046914) | 0.001254 | 0.02633 | 18.48 | 123.5 |
| 3 | Intracellular cAMP-activated Cation Channel Activity (GO:0005222) | 0.003994 | 0.03591 | 317.19 | 1751.86 |
| 4 | Non-Membrane Spanning Protein Tyrosine Phosphatase Activity (GO:0004726) | 0.004492 | 0.03591 | 277.53 | 1500.17 |
| 5 | Intracellular Cyclic Nucleotide Activated Monoatomic Cation Channel Activity (GO:0005221) | 0.00499 | 0.03591 | 246.68 | 1307.49 |
| 6 | cAMP Binding (GO:0030552) | 0.005488 | 0.03591 | 222 | 1155.57 |
| 7 | Titin Binding (GO:0031432) | 0.005985 | 0.03591 | 201.81 | 1032.95 |
| 8 | Calcium-Dependent Phospholipase A2 Activity (GO:0047498) | 0.007973 | 0.03991 | 147.96 | 714.91 |
| 9 | Adenyl Ribonucleotide Binding (GO:0032559) | 0.009865 | 0.03991 | 16.03 | 74.03 |
| 10 | Ephrin Receptor Binding (GO:0046875) | 0.01045 | 0.03991 | 110.94 | 506.01 |
Discussion
Hereditary gingival fibromatosis is a rare, autosomal dominant form of gingival overgrowth caused by a mutation in the SOS1 gene, resul- ting in a protein chimera with a wild-type SOS1 protein(14, 15). Hereditary gingival fibromatosis is a rare, benign disorder characterized by fibrous overgrowth of gingiva. Two loci have been mapped, and a novel locus, GINGF3, has been identified. The autosomal dominant inheritance pattern invol- ves increased fibroblast proliferation, collagen and fibronectin synthesis, and reduced matrix metallo- proteinases, with variable penetrance and expressivity. HGF typically appears with permanent teeth eruption, associated with increased transforming growth factor ß1 levels (2, 5, 16, 17). The gingiva has a rosy, fibrous appearance, partial or total tooth coverage, and variable severity without affecting the bone. Two autosomal dominant non-syndromic HGF loci have been mapped in familial cases, with only the SOS1 gene underlying the GINGF locus identified and a novel locus, GINGF3, mapped to 2p22.3-p23.3 (18, 19).
Gingival fibromatosis, a genetic disorder, can be familial or idiopathic and linked to inherited syndromes like Zimmerman Laband syndrome, Murray Puretic Drescher, Rutherfurd, Cross, Cowden syndrome, and tuberous sclerosis. It can cause hypertrichosis, growth retardation, epilepsy, splenomegaly, optic and auditory defects, and dentigerous cysts (1, 2, 4, 16). A heterozygous frameshift mutation in the SOS1 gene causes hereditary gingival fibromatosis (HGF). The autoso- mal dominant inheritance pattern varies, with 20% of cases lacking a family history. Diagnosis relies on medical history, clinical examination, blood tests, and histopathological evaluation, making genetic testing impractical. Identifying key genes and understanding HGF molecular mechanisms is crucial for further research (5, 6, 20).
In this study, we identified the top ten hub genes involved in hereditary gingival enlargement, including SPTA1, MYBPC1, IVNS1ABP, PLA2G2A, PTPN1, IFIH1, SNX13, PCSK1, HCN1, and PAPPA2 (Figure 1 and Figure 2). In this study, the neural network model effectively predicted interactome hub genes in hereditary gingival enlargement, with an AUC of 0.853, classification accuracy of 0.720, F1 score of 0.720, precision of 0.720, and recall of 0.720 (Figure 3 and Figure 4) (Table 1) similar to previous study identified 249 differentially expres- sed genes (DEGs) in HGF patients' gums compa- red to healthy controls. A protein-protein interac- tion network was constructed, identifying 12 core genes, with POTE ankyrin domain family member I as the highest degree node, enabling bioinfor- matics methods to predict HGF-related genes like MYBPC1, PLA2G2A, PCSK1 (21, 22).
The KEGG enrichment analysis reveals that the hub gene set is significantly associated with several metabolic and signaling pathways, primarily related to lipid metabolism and its roles in health and disease. These pathways include alpha-linolenic Acid Metabolism, which is involved in the metabolism of essential omega-3 fatty acids, linoleic Acid Metabolism, Fat Digestion and Absorption, Ether Lipid Metabolism, Arachido- nic Acid Metabolism, GnRH Secretion, RIG-I-like Receptor Signaling Pathway, Adherens Junction, Glycerophospholipid Metabolism, and Pancreatic Secretion (14, 23,24,25). These pathways are crucial for maintaining membrane integrity and functionality and influencing metabolic processes or disorders such as metabolic syndrome, cardio- vascular diseases, and reproductive health. The analysis suggests that the gene set may play a role in various physiological processes or disorders that involve these pathways, such as metabolic syndrome and fibrosis (Table 2 and Table 3). Genes reveal that interest is significantly enriched for processes related to ion binding, particularly zinc ions and transition metals. This suggests that the selected genes may play critical roles in signaling pathways or structural functions involving ion transport and binding. This could be pivotal in further investigating their roles in biological systems or diseases. The analysis also highlights the functional diversity of the list, with terms like Adenyl Ribonucleotide Binding and Ephrin Receptor Binding showing lower significance (26,27,28).
The study focuses on a specific dataset of hereditary gingival enlargement, highlighting the need for validation in larger cohorts to ensure the model's robustness and generalizability. It also suggests exploring other predictive features, such as clinical variables, genetic markers, or other omics data, to improve predictive accuracy. Functional validation experiments are also crucial to confirm the role of predicted hub genes in hereditary gingival enlargement (25, 26). The ultimate goal is to translate the model's findings into clinical utility, aiding diagnosis, prognosis, and treatment decision-making. However, limitations include limited sample size, data quality and biases, interpretability of the model, and external validation using independent datasets. These factors will help ensure the model's applicability and reliability in different settings, contributing to its robustness. Future directions should also assess the model's practicality and usefulness in real-world clinical settings.
Conclusions
The study identifies ten hub genes and develops a neural network model for predicting these genes in hereditary gingival enlargement. However, validation in larger cohorts is needed for reliability and generalizability. Additional predictive features and functional validation experiments will enhance understanding of biological mechanisms. Translation into clinical practice could improve diagnosis, prognosis, and treatment decision- making. Such as sample size, data quality, interpretability of the model, and external validation using independent datasets. The model's practicality in real-world clinical settings can be assessed to maximize its potential in assisting patients with hereditary gingival enlargement.
Conflicts of interst
The authors declare no conflicts of interest.
FUNDING
This research did not receive grants.
Author contributions statement
Conceptualization: P. K.Y., D.A. and C.M.A.
Data curation: P.K.Y, D.A. and C.M.A.
Formal analysis: P.K.Y, D.A. and C.M.A.
Funding acquisition: P.K.Y.
Investigation: P.K.Y, D.A. and C.M.A.
Methodology: P.K.Y, D.A. and C.M.A.
Project administration: P.K.Y.
Resources: P.K.Y. Software: P.K.Y.
Supervision: P.K.Y, D.A. and C.M.A.
Validation: P.K.Y, D.A. and C.M.A.
Visualization: P.K.Y, D.A. and C.M.A.
Writing-original draft: P.K.Y, D.A. and C.M.A.
Writing-review & editing: P.K.Y, D.A. and C.M.A.
All authors have read and agreed to the published version of the manuscript.

