


 English (pdf)
 Article in xml format
 Article references
 Send this article by e-mail
 Cited by SciELO
  Similars in
SciELO
Similars in
SciELO 
 Permalink
1. Introduction
Gastric cancer usually develops at the end of a well-established process that starts with superficial gastritis, which evolves into atrophy, metaplasia, dysplasia, and finally, adenocarcinoma (Correa, 1992)]. The whole process takes decades and, in most cases, is initiated by infection with Helicobacter pylori (Graham, 1997; Persson et al., 2011). H. pylori is a gram-negative, spiral, microaerophilic bacillus that is able to colonize the gastric mucosa of humans (Marshall & Warren, 1984). Around half the world's population is infected with H. pylori (Azevedo, Huntington, & Goodman, 2009). However, the prevalence of infection varies amongst high- and low-income countries, being higher in the latter, as well as in underprivileged populations (ethnic minorities, rural areas, and migrants), an epidemiological pattern associated directly with poverty and deficient hygienic conditions (Burucoa & Axon, 2017; Kayali et al., 2018). Aside from gastric adenocarcinoma, which develops in 1 % to 2 % of the infected, H. pylori is associated with pathologies such as peptic ulcer and MALT lymphoma (Malfertheiner, Chan, & McColl, 2009; Marshall, 1986; Smolka & Schubert, 2017; F. Wang, Meng, Wang, & Qiao, 2014). Costa Rica has a high prevalence of the infection (Alpízar-Alpízar, Pérez-Pérez, Une, Cuenca, & Sierra, 2005; Blanco-Delgado et al., 2001; Miranda et al., 1998; R. Sierra et al., 1992; R. Sierra et al., 2008; R. Sierra et al., 2006; Sigarán et al., 1992) and an elevated incidence of gastric cancer and its associated mortality (Bray et al., 2018; Ferlay et al., 2018).
The presence of different virulence factors has been widely described in H. pylori, some of which are related to the pathologies that occur during infection (Lu, Yamaoka, & Graham, 2005; Polk & Peek, 2010; Wen & Moss, 2009; Wroblewski, Peek, & Wilson, 2010). The presence of the cytotoxin-associated gene A (CagA) is the most important feature of the bacterium in relation with higher risk of gastric adenocarcinoma and its pre-malignant lesions (Atherton et al., 1995; Covacci et al., 1993; Cover & Blaser, 1992; Yamaoka & Graham, 2014). In the context of the infection, these factors contribute to a sustained inflammatory process that results in damage and atrophy of the epithelium and favors the malignant transformation (Qadri, Rasool, Gulzar, Naqash, & Shah, 2014). The spectrum of severity is variable, depending on an interplay between genetic factors and immune status of the host, the environmental context, and bacterial virulence factors, (Atherton, 2006; Polk & Peek, 2010; Yamaoka, 2010). In the host, an exacerbated inflammatory response could be associated with gene polymorphisms that also increase the risk of gastric cancer (Alpízar-Alpízar et al., 2005; El-Omar et al., 2000; Taguchi et al., 2005). Regarding the behavioral factors, diets with low intake of antioxidants and high salt intake, as well as tobacco smoking, have been linked to increased risk of gastric cancer (Crew & Neugut, 2006; Fox et al., 1999; Jayalekshmi et al., 2015; Menaker, Sharaf, & Jones, 2004).
The clinical presentation of precancerous lesions and early gastric tumors can mimic the symptoms of common gastric disease, which results in a late diagnosis, where the treatment is likely to fail. Therefore, current research efforts are directed to the identification of markers of initial lesions that allow detection at early stages, where treatment could be more effective. So far, the most promising ones are serum pepsinogens and gastrin (Cao, Ran, & Xiao, 2007; Dinis-Ribeiro et al., 2004). The proteolytic enzyme pepsin is produced as two types of pepsinogens (PGI and PGII) in the gastric mucosa and secreted to the gastric lumen to carry out its digestive function. However, a small amount escapes into the bloodstream and can be quantified by serology (Brenner, Rothenbacher, & Weck, 2007; Sipponen, Härkönen, Alanko, & Suovaniemi, 2003). The expression pattern of PG is altered by gastric inflammation and atrophy and these changes reflect in PG blood concentrations, with PGI and PGI/PGII ratio decreases in association with gastric atrophy, especially in the body of the stomach. As atrophy is considered a precancerous lesion, blood PG concentrations are used to screen the risk for gastric cancer (Sipponen, Samloff, Saukkonen, & Varis, 1985). In Costa Rica, gastric cancer ranks third in cancer related deaths and this is mostly due to late detection (GLOBOCAN, 2012). This highlights the importance of having reliable and affordable markers for the screening of gastric cancer risk. We have previously shown that low PG values and H. pylori-CagA+ infection are associated with risk of gastric atrophy and cancer in Costa Rican population (Rafaela Sierra et al., 2003; Sierra et al., 2008; Sierra et al., 2006).
In this study, we used an exploratory multigroup structural equation modeling (SEM) approach to describe and analyze the association of PGI/PGII ratio, as an indicator of gastric atrophy, with H. pylori-CagA and environmental factors such as caloric intake, obesity, and harmful habits amongst H. pylori-positive elderly people infected in Costa Rica. Our general model was consistent for the evaluation of different subgroups amongst the population, showing the pertinence of serum PG levels as a non-invasive test to evaluate the presence of atrophy and increased gastric cancer risk.
2. Theoretical reference
Structural Equation Modeling. Structural equation models (SEMs) are part of a family of multivariate statistical models used to estimate the effect and relationships between multiple variables (Ruiz, Pardo, & San Martín, 2010). Also known as LISREL models or covariance structure analysis, SEMs represent an alternative to explore possible causal theoretical approaches with data obtained from observational or correlational studies (46-48]. It is important to note that SEMs do not prove causality, but they do account for empirical evidence in favor or not of a causal approach.
The roots of SEMs can be traced from three other older multivariate techniques: confirmatory factor analysis that comes from psychology, path analysis that comes from biology and genetics, and systems of simultaneous equations that were developed in economics. A complete SEM integrates these three techniques (Kaplan, 2008; Montero, 2012). The interest in SEMs is generally on theoretical constructs, which are represented by latent variables, characteristics that would be useful to measure but cannot be observed. A factor model, which is often called the measurement model, specifies how the latent factors are measured by the observed variables, as measurable characteristics in the study subjects (Hox, Moerbeek, & van de Schoot, 2010; Ruiz et al., 2010). SEMs usually also include error variables that represent the errors associated with the measurement of the observed variables. SEMs are often visualized by a graphical path diagram known as structural diagram. An example of a structural diagram is shown in figure 1.
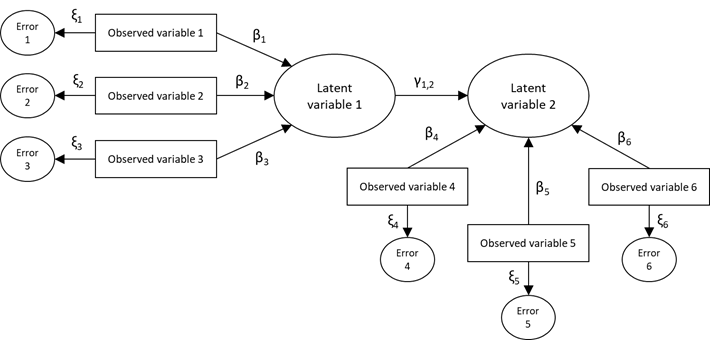
Figure 1. Example of a structural diagram used to visualize SEM (β, γ, and ξ correspond to regression coefficient of the model)
Structural diagrams follow particular conventions that are necessary to know in order to derive the corresponding equations. The observable variables are represented enclosed in rectangles, the unobservable variables (latent) and the error variables in ovals or circles, any structural effect is represented as a straight arrow from the predictor variable to the dependent variable, and the model parameters (coefficients) are represented on the corresponding arrow (Hox & Bechger, 1999; Ruiz et al., 2010).
Mathematically, these models are more complex to estimate than other multivariate models such as regression or exploratory factor analysis (Ruiz et al., 2010). Statistically, the model is evaluated by comparing two variance/covariance matrices. A sample variance/covariance matrix is calculated from the data. From this matrix and the model, an estimated population variance/covariance matrix is also computed. If the estimated population variance/covariance matrix is very similar to the known sample variance/covariance matrix, then the model is said to fit the data well (Hox et al., 2010). Once a model has been estimated, it is necessary to evaluate its quality using goodness of fit statistics. There are three types of goodness of fit statistics widely used: absolute fit statistics (e.g. chi-square), relative fit statistics (e.g. comparative fit index CFI and Tucker-Lewis index TLI), and parsimonious fit statistics (e.g. Root Mean Square Error of Approximation RMSEA). Use and interpretation of these statistics are discussed in (Hox & Bechger, 1999; Ruiz et al., 2010).
3. Materials and methods
3.1 Scope, database, and sample design.
The dataset used in this study was gathered from two research projects: "Costa Rica: Longevity and Healthy Aging Study (CRELES, for its Spanish acronym), a longitudinal study based on a national sample representing elderly people in Costa Rica, with an oversampling of people ninety years old and over, and Blood pepsinogen levels to identify people at high risk of gastric cancer in an adult Costa Rican population (52]. CRELES study included people of any nationality residing in Costa Rica that were born before 1946, that is, 60 years old or older by the time of the first interview. They were randomly selected from the Costa Rican 2000 Census database, for a total of 9 600 individuals aged 55 and over. Five-year age groups stratification was made afterwards. The sampling fraction in these groups varied between 1 % for those born in 1941 to 1945 and 100 % for those born before 1905. The sample covered 59 % of the national territory (Brenes-Camacho & Rosero-Bixby, 2008). The 2827 people who were located, interviewed, and underwent the clinical tests were included in the study. Pepsinogen concentrations and seroprevalence for H. pylori and CagA were assessed, and the participants were classified following the ABCD system. For the present study, CRELES first wave data was used, and the original sample was reduced to the individuals with positive results for H. pylori infection. Subjects with missing or incomplete information, and the extreme values for all the quantitative variables were excluded. Finally, a data sample of 1748 individuals was obtained. All participants provided informed consent. The University of Costa Rica Ethics Committee approved the procedure for collecting data and the informed consent form. Pepsinogen I and II levels were tested for all the 1748 samples from the CRELES population.
3.2 Measures.
All the data was obtained from the CRELES study databases, and the coding and secondary analysis were performed specifically for this study.
Body Mass Index (BMI). For each individual, weight and height were measured and body mass index (BMI) was calculated as weight divided by height squared. Missing values of height and weight imputed with a linear regression model. For height, knee height, age and sex were used as explanatory variables. The weight model included the variables waist circumference, calf circumference, height, age and sex.
Waist circumference (waist). For each individual, waist circumference was measured in cm, with the participants standing, in a semi-anatomical position (with the feet separated and the palm of the hands resting on the lateral thigh) using medical measuring tapes.
Arm circumference (arms). For each individual, arm circumference was measured in cm, with the person seated or standing, considering the half point between the acromion (or posterior bone of the shoulder) and the olecranon or protruding bone of the elbow, using medical measuring tapes.
Caloric intake (calories). For each individual, caloric intake was defined as the total energy per day (kcal/d). The consumed calories quantity was estimated from the frequencies declared by the participants in a questionnaire of food intake frequency (Kabagambe et al., 2001).
Harmful habits. The measure for harmful habits comprised two measures related with smoking and drinking alcohol. First one includes the question Have you smoked more than 100 cigars in your life? with two possible response categories: yes (score: 1) or no (score: 0). The other one includes the question Have you ever drunk alcoholic beverages regularly in your life? with five possible response categories: occasionally, daily, just in special occasion, not a current drinker, but drank or never drank. These five categories were reduced to three, considering current drinkers (score: 2), not current drinkers but drank (score: 1) and never drank (score: 0). Both smoking and drinking scores were combined into one, considering that the higher the score, the worse are the harmful habits.
H. pylori serology. Serum antibodies to H. pylori were measured in a qualitative Enzyme Linked Immunosorbent Assay (ELISA) developed in INISA and based on a modification of a previously described ELISA (Ferrer-Ferrer et al., 2013; Perez-Perez, Dworkin, Chodos, & Blaser, 1988).
CagA serology (CagA). Serum antibodies to CagA were measured by in-house ELISA as previously described (Blaser et al., 1995b). Both continuous and dichotomous (cutoff-value: 0.35) variables were evaluated. Due to the observed (and expected) asymmetric distribution for the continuous variable, the measure distribution was normalized maintaining its original mean and standard deviation.
Pepsinogen ratio (PG). Serum pepsinogens were determined by ELISA (Biohit Oyi, Finland), according to the manufacturer's instructions, and PG ratio (PGI/PGII) was calculated. Due to its observed (and expected) asymmetric distribution, the measure distribution was normalized maintaining its original mean and standard deviation.
3.3 Statistical analysis.
Differences across samples on the average of the manifest indicators were tested using a Multivariate Analysis of Variance (MANOVA) and descriptive statistics. Multigroup structural equations modeling (SEM) analyses were conducted using Stata 14.0 software (Stata-Corp, College Station, USA)(StataCorp, 2015), considering sex (male and female), age groups (< 80 and ≥ 80) and risk area (high, medium, low). A unique SEM model was examined across all groups (multigroup SEM), in which obesity mediated the relationship between calories and PG, and direct paths between CagA and harmful habits with PG were defined as well. In this model, obesity was measured as a latent variable, using arms, waist and BMI as its observed indicators. All remaining variables were considered as observed indicators. Structural diagrams are shown in the results section below.
The covariance matrix of the measures and parameter estimates were calculated using the maximum likelihood method. Structural coefficients were considered relevant if their values were greater than 0.10, meanwhile, measurement coefficients were considered relevant if their magnitudes were greater than 0.30(Hays, Revicki, & Coyne, 2005).
For the assessment of the goodness of fit of the multigroup structural equation models, several indicators were examined, including chi-square test and RMSEA. Chi-square test should have a probability value greater than 0.05 to indicate a good fit, but it is recognized that this parameter is strongly influenced by sample size and other parameters (60]. RMSEA less than 0.05 indicates good fit, and values between 0.05 and 0.10 are considered acceptable.
4. Results
4.1 Descriptive and preliminary inference analysis.
Descriptive statistics for the data are shown in Table 1. The MANOVA showed a general multivariate effect of sex on all indicators (p < 0.05), supporting the idea of conducting the main analysis for each sex separately. Univariate ANOVAs indicated significant difference across sex for harmful habits, arms, and waist (p < 0.001 for all three) and calories (p < 0 .05). Moreover, the MANOVA by risk area showed means differ between indicators among these groups (p < 0.001). Despite these results, univariate ANOVAs only indicated significant difference across risk areas for PG (p < 0.001). In a similar way, MANOVA showed a general multivariate effect of age group on all indicators (p < 0.001), but univariate ANOVAs indicated significant difference across age group only for CagA, arms, BMI, and waist (p < 0.001 for all four) and calories (p < 0.05).
Table 1. Descriptive statistics for all indicators across samples
| Variables | Global (n = 1748) | Male (n = 815) | Female (n = 933) | Low-Risk (n = 352) | Middle-Risk (n = 955) | High-Risk (n = 441) | Age < 80 (n = 1170) | Age ≥ 80 (n = 578) | - | - | |||||||||||
| Mean | S.E | Mean | S.E | Mean | S.E | Mean | S.E | Mean | S.E | Mean | S.E | Mean | S.E | Mean | S.E | - | - | ||||
| PG | 8 | 4.6 | 8 | 4.8 | 7.9 | 4.3 | 9.1 | 5.6 | 7.8 | 4.3 | 7.3 | 4 | 8 | 4.6 | 7.8 | 4.6 | - | - | |||
| CagA | 0.5 | 0.3 | 0.5 | 0.3 | 0.5 | 0.3 | 0.4 | 0.3 | 0.5 | 0.3 | 0.5 | 0.3 | 0.5 | 0.3 | 0.4 | 0.3 | - | - | |||
| Harmful habits | 2.7 | 1.5 | 3.7 | 1.2 | 1.8 | 1.3 | 2.7 | 1.6 | 2.7 | 1.5 | 2.7 | 1.6 | 2.7 | 1.6 | 2.6 | 1.5 | - | - | |||
| Arms | 29.2 | 4.5 | 28.8 | 3.8 | 29.5 | 5 | 28.9 | 4.5 | 29.3 | 4.5 | 29 | 4.5 | 30.2 | 4.2 | 27 | 4.3 | - | - | |||
| BMI | 26.2 | 5.3 | 25.3 | 4.2 | 26.9 | 6.1 | 26.1 | 5.5 | 26.1 | 5.4 | 26.4 | 5.1 | 27 | 5.2 | 24.5 | 5.1 | - | - | |||
| Waist | 92.5 | 12.6 | 92.4 | 10.8 | 92.6 | 14 | 92 | 13.2 | 92.7 | 12.2 | 92.5 | 13 | 93.8 | 12.5 | 90 | 12.4 | - | - | |||
| Calories | 2067.9 | 646 | 2192 | 638 | 1960 | 634 | 2112 | 664 | 2072 | 648 | 2024 | 627 | 2103 | 655 | 1997 | 623 | - | - | |||
S.E: Standard Error.
Post-hoc comparison showed that men have worse harmful habits, larger arm and waist circumferences, and more calorie-intake than women. Also, data showed that individuals from low-risk areas had a higher pepsinogen ratio average in comparison with those from middle- and high-risk areas. Finally, means comparison showed that people under 80 years have larger arms and waist circumferences, and consume more calories, than older people.
Bivariate correlation matrix between all indicators is presented in Table 2. No change across samples was observed for this correlation matrix (data no shown). A strong positive relationship between BMI, arms and waist was observed, while a negative relationship between PG and CagA. It is remarkable, however, that this last correlation did not show statistical significance.
Table 2. Bivariate correlations between all indicators.
| Variable | 1 | 2 | 3 | 4 | 5 | 6 | 7 | - | - | |
| 1 | PG | 1.00 | - | - | - | - | - | - | - | - |
| 2 | CagA | -0.23 | 1.00 | - | - | - | - | - | - | - |
| 3 | Harmful habits | 0.02 | -0.02 | 1.00 | - | - | - | - | - | - |
| 4 | Arms | 0.02 | 0.00 | -0.03 | 1.00 | - | - | - | - | - |
| 5 | BMI | 0.05 | -0.03 | -0.10 | 0.74* | 1.00 | - | - | - | - |
| 6 | Waist | 0.05 | -0.04 | 0.03 | 0.71* | 0.73* | 1.00 | - | - | - |
| 7 | Calories | 0.05 | -0.01 | 0.15 | 0.00 | -0.02 | 0.00 | 1.00 | - | - |
* p < 0.05
4.2 Multigroup structural equation models (SEM).
Diagrams for the fitted SEM models with their standardized parameter estimates across samples are shown in figure 2, figure 3, and Figure 4. Models were fitted considering CagA as a continuous variable and as a dichotomous variable (positive or negative, cutoff value = 0.35), although no statistical difference was observed between those models. Use of continuous variables was preferred due to the adequacy of the estimation method. For all chi-square tests 27 degrees of freedom ((27]) were used.
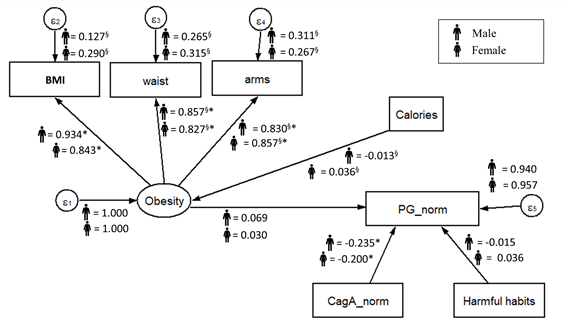
Figure 2. Standardized parameters estimated for the proposed SEM model by sex. The values indicated standardized regression coefficient (β, γ, and ξ). ∗Significant coefficient with p < 0.05. §Coefficient is significantly different across samples.
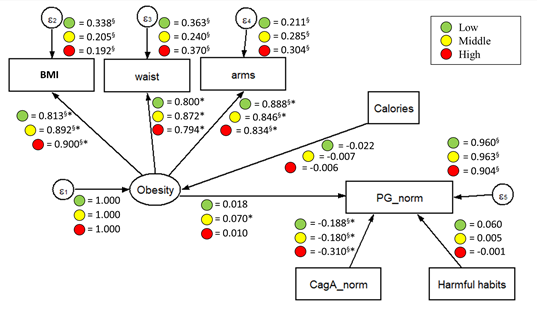
Figure 3. Standardized parameters estimated for the proposed SEM model by risk areas. The values indicated standardized regression coefficient (β, γ, and ξ). ∗Significant coefficient with p < 0.05. §Coefficient is significantly different across samples.
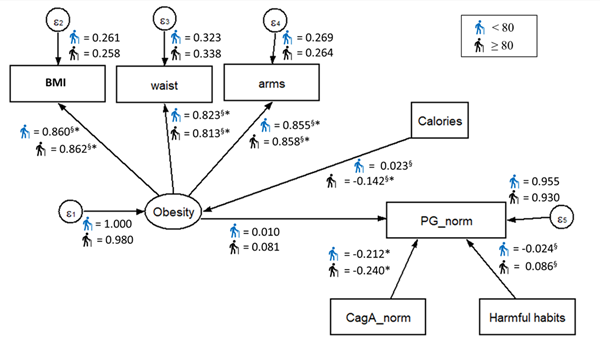
Figure 4. Standardized parameters estimated for the proposed SEM model by age group. The values indicated standardized regression coefficient (β, γ, and ξ). ∗Significant coefficient with p < 0.05. §Coefficient is significantly different across samples.
The results reveal that the proposed model exhibited a good fit in both males (χ2(27] = 24.802, p < 0.05, RMSEA = 0.039) and females (χ2(27] = 5.556, p > 0.05, RMSEA = 0.000) (Figure 2). The standardized results showed that CagA preliminary predicted PG in the expected direction (the higher/positive CagA, the less PG), in both male (β = –0.235) and females (β = –0.200), with a similar effect in both cases. All indicators involved in the measurement model for obesity (BMI, arms, and waist) showed significant standardized coefficients, with similar effects in both males and females. No other factors on the fitted model revealed statistical significance effects or differences between sex groups.
By analyzing the fitted multigroup model across risk areas (Figure 3), good fitness was found in the low-risk group (χ2(27] = 16.665, p > 0.05, RMSEA = 0.038), and for the middle-risk group (χ2(27] = 29.602, p < 0.05, RMSEA = 0.042), while an acceptable fit was found for the high-risk group (χ2(27] = 28.838, p < 0.05, RMSEA = 0.061). Perhaps, the most interesting finding was that the apparent effect of CagA on PG increased as the risk area level increased as well (χ2(27] = 6.865, p < 0.05), having the highest apparent effect in individuals from high-risk areas (βlow = –0.188, βmid = –0.180 y βhigh = –0.310) and maintaining the same expected effect direction as in the fitted model for sex groups. Also, the apparent effect of latent variable obesity on PG was found statistically significant for individuals from the middle-risk areas, but the magnitude of this effect was not considered relevant. All indicators involved in the measurement model for obesity (BMI, arms, and waist) showed significant standardized coefficients, with similar effects in all the risk areas.
Finally, the fitted multigroup model presented good fitness values for both age groups (χ2(27] = 64.271, p < 0.05, RMSEA = 0.038 for individuals under 80 years; χ2(27] = 29.602, p < 0.05, RMSEA = 0.042 for individuals aged 80 and over) (Figure 4). Similarly, CagA remained as a significant predictor of PG for both age groups, maintaining the same expected effect direction as in the other fitted models (β = –0.212 for individuals under 80 years, β = –0.240 for individuals aged 80 and over). It was also noticed that the regression coefficient between calories and obesity was statistically significant and relevant, but only for individuals aged 80 and over (β = –0.142), indicating that more caloric intake, the less obesity. Despite this finding, the effect of obesity on PG remained non-significant statistically neither relevant. No other factors on the fitted model revealed statistical significance effects or differences between age groups.
5. Discussion
H. pylori infected patients develop superficial gastritis, and approximately 50 % progress to atrophy, which is considered an independent risk factor for the development of gastric cancer (Shichijo et al., 2017; Song, Kim, Jin, Lim, & Yang, 2017). The course of disease is partly due to environmental conditions and genetics of the host, but also to the presence of particular virulence factors in the infecting bacterial strain (Correa & Piazuelo, 2012). Our results showed a good fit for the structural equations model for the considered variables. This was expected as CagA is the main oncogenic factor of H. pylori, and atrophic gastritis is the first step in the precancerous cascade. The other evaluated variables had some significant influence, but with a lower weight or non-significant influence at all, probably because of the biological importance and direct oncogenic effect of CagA. CagA binds to and deregulates intracellular signaling molecules changing the host cell signaling pathways (Higashi, Tsutsumi, Muto, et al., 2002; Yamazaki et al., 2003), such as the oncogenic Ras-Erk MAP kinases cascade (Higashi et al., 2004; Neel, Gu, & Pao, 2003) intercellular adherence and communication (Murata-Kamiya, 2011; Tsutsumi, Takahashi, Azuma, Higashi, & Hatakeyama, 2006), and cytoskeleton dynamics. Altogether, these alterations explain why the sole presence of CagA is enough to unleash the carcinogenic process in vitro and in vivo (Hatakeyama, 2003, 2004; Ohnishi et al., 2008), and the presence of CagA+ H. pylori strains has been associated with high risk of gastric cancer and precancerous lesions in numerous populations, including ours (Blaser et al., 1995a; Con et al., 2006; Kuipers, Pérez-Pérez, Meuwissen, & Blaser, 1995; Sierra et al., 2008). Another plausible explanation for this observation is that the information about caloric intake and harmful habits, was obtained from estimations and subjective references from the individuals, and the data collection instrument used was not made specifically for this study, introducing a certain degree of incertitude and bias.
Regarding the results related with sex groups, it is important to consider that a higher risk for developing gastric cancer has been described for men compared to women (Rugge, Fassan, & Graham, 2015). This difference has been attributed to the effect of estrogens, which is reinforced as the difference in risk between genders declines after 60 years of age, suggesting a loss of the hormonal protective effect in the postmenopausal years, which can be modified as by the use of hormonal replacement therapy (Camargo et al., 2012; Sipponen & Correa, 2002; Z. Wang et al., 2016). As we studied a lesion placed in the beginning of the precancerous cascade in an elderly population, it is not surprising that the difference between both sexes is lost upon the diminution of estrogen exposure in elderly women. Information about reproductive periods and use of hormonal replacement therapy was not available, so this hypothesis could not be tested for this study.
The adjusted model also showed consistency when tested in the two age groups (younger and older than 80 years). Intestinal-type gastric cancer is normally develop during a long period of time and the risk for disease gradually increases with age, reaching a plateau between 55 and 80 years (Rugge et al., 2015). Theoretically, according to age, the studied population would have already developed cancer or advanced preneoplastic lesions and being older than 80 years should be a changing factor in the carcinogenic process.
The most important change in the model was observed when subjects were separated in groups according to geographical risk areas for gastric cancer. In this case, the structure of the model was maintained but the magnitude of the effect of CagA in the PG ratio in the individuals from high-risk zones was twice as high as those for people from medium- and low-risk areas. There may be a difference amongst the CagA types present in the circulating strains in the different zones. There are three types of Western CagA proteins, that differ in the number of tyrosine phosphorylation motifs Glu-Pro-Ile-Tyr-Ala (EPIYA) (Higashi, Tsutsumi, Fujita, et al., 2002). The variations alter the phosphorylation degree of CagA and its biological activity, and in consequence, the clinical outcome of the infection (Argent et al., 2004; Ferreira, Machado, Leite, Carneiro, & Figueiredo, 2012; Nagase, Hayashi, Senda, & Hatakeyama, 2015). The specific analysis of the CagA types was not performed in this study as it requires the isolates of H. pylori, but the increased magnitude of the CagA effect highlights the importance of analyzing this feature between high- and low-risk populations in Costa Rica.
6. Conclusions
In conclusion, we showed that good fit was obtained for the proposed SEM model considering PGI/PGII ratio, H. pylori-CagA and environmental factors such as caloric intake, obesity, and harmful habits, shedding light on the possible relationships between them in the study of elderly people from Costa Rica. Findings from this study are preliminary and should be interpreted with caution. However, results seem to indicate that relationship between CagA and PG ratio increases with the geographical risk area level for elderly people, reinforcing the pertinence of serum PG levels as a non-invasive test to evaluate the presence of increased gastric cancer risk. No relationship differences were observed on measures relationships between male and female population, or between under 80 years and older individuals. The results obtained in this study may be relevant for the assessment of gastric atrophy and gastric cancer processes in elderly people. Further studies are recommended, considering a deeper analysis of CagA types, its relationship with PG ratio and younger individuals where age and sex differences may have stronger influence in measures relationships.

