English (pdf)
 Article in xml format
 Article references
 Send this article by e-mail
 Cited by SciELO
  Similars in
SciELO
Similars in
SciELO 
 Permalink
Introduction
The 22 April 1991 Mw 7.7 Limón, Costa Rica earthquake is one of the three largest earthquakes to occur in Costa Rica during the last century. In contrast to the 1950 Ms 7.7 and 2012 Ms 7.6 Nicoya Peninsula earthquakes which were located on the seismically active Pacific coast, the 1991 Limón earthquake occurred along the Caribbean coast of southeastern Costa Rica. While the Caribbean coast of Costa Rica and Northwestern Panama is an area of relatively low instrumental seismic activity (Alvarado et al., 2017), it has been affected several times in the past 200 years by large earthquakes associated with back arc thrust faulting (Adamek, Frohlich & Pennington, 1988; Camacho & Víquez,1993; Mendoza and Nishenko, 1989; Plafker & Ward, 1992; Suárez et al., 1995).
The 1991 Limón earthquake occurred on the western part of a southwest dipping fold and thrust belt (North Panama Deformed Belt) that follows the Caribbean coast of Panama and Costa Rica (Plafker & Ward, 1992; Protti & Schwartz, 1994; Silver, Reed, Tagudin & Heil, 1990; Suárez et al., 1995). Field studies by Plafker & Ward (1992) and Denyer, Personius & Arias (1994) indicate a zone of uplift along the inner continental shelf and coast that extended ~ 70 km from north of Limón to the Costa Rica-Panama border. The maximum uplift occurred at Limón (157 cm) and turned sharply westward and inland for an unknown distance. To the southeast, the crest of the uplifted zone is located approximately 3 to 4 km offshore and the amount of uplift gradually decreases towards the Costa Rica-Panama border (Plafker & Ward, 1992).
Researchers from a number of institutions, including the University of Costa Rica, the University of Panama, the Universidad Nacional Autonoma de Mexico (UNAM), the Earthquake Engineering Research Institute (EERI), the University of California Santa Cruz (UCSC) and the U.S. Geological Survey (USGS) conducted field reconnaissance in areas of both Costa Rica and Panama affected by the 1991 Limón earthquake. An area of 15,000 km2 experienced widespread liquefaction and lateral spreading in places characterized by unconsolidated coastal plain and river deposits (EERI, 1991; Camacho & Víquez, 1994; Denyer et al., 1994; Plafker & Ward, 1992). Estimates of damage to infrastructure and lost revenues are at $500 million in Costa Rica (EERI, 1991) and $75 million in Panama (SINAPROC, Panama Civil Defense, written communication, 1992). This report presents tide gauge records and eyewitness accounts of tsunami activity along the Caribbean coast of Costa Rica and Northwestern Panama following the 1991 Limón earthquake.
Tsunami observations
Tide Gauges
A tsunami or series of waves with heights, hmax, of 2 to 3 m were reported by eyewitnesses along the coast from Rio Matina, Costa Rica to Bastimentos Island, Panama following the earthquake (Fig. 1) indicating a tsunami magnitude, m, of ~1 (where m = log2hmax; Table 1; Iida, Cox & Pararas-Carayannis, 1967; Iida, 1970). The Cristobal tide gauge at Coco Solo, Panama (9.35° N, 79.92° W, 320 km southeast of the source zone) recorded a maximum peak to trough amplitude of 7.6 cm (3 in) 1 hour after the earthquake (Fig. 2). Approximately 3½ hours later, bubbler tide gauges in Magueyes Island, Puerto Rico (18.22° N, 67.16° W) and Limetree Bay, St. Croix, Virgin Islands (17.69° N, 64.75° W) both recorded disturbances of about 7 cm peak to trough (Fig. 2). Appendix 1 in the Electronic Supplement contains copies of the three tide gauge records.
Tsunami Questionnaire
In many cases, little if any systematic data collection occurs for tsunamis that have not been accompanied by extensive damage and loss of life, or where the damage has been limited to the immediate area of generation. As a result, a great deal of perishable information related to the local characteristics and behavior of these smaller tsunamis has been lost. To develop a framework for systematic data collection, a questionnaire was designed to facilitate the analysis of smaller events associated with earthquake generated tsunamis or other unusual wave activity related to submarine landslides or volcanic eruptions (Nishenko, 1987). A prototype tsunami questionnaire was field tested in the Monterey Bay, California region following the 1989 Loma Prieta, California (Ms 6.9) earthquake (Preuss & Nishenko, 1992) and was subsequently revised and simplified.
Tsunami questionnaires were also distributed following two later tsunamis in which reported damage was slight - the 1992 Petrolia, California (Ms 7.0) and 1992 Nicaragua (Ms 7.2) earthquakes (Preuss, 1994). The results of these surveys demonstrated the utility of a readily available instrument to disseminate immediately after the event.
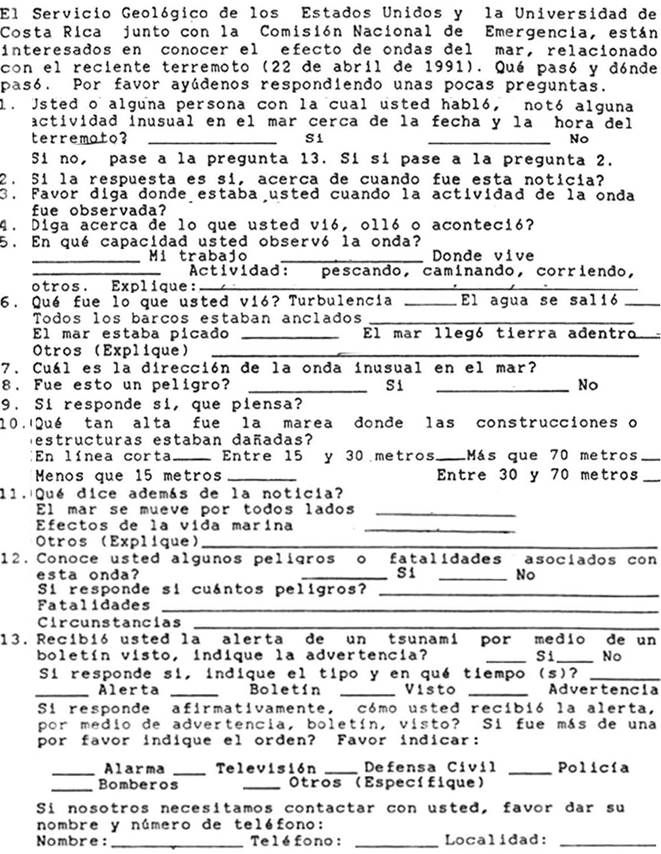
The prototype tsunami questionnaire was translated into Spanish (Fig. 3) and distributed in Costa Rica with the help of personnel from the University of Costa Rica approximately one week after the 1991 Limón earthquake. Fourteen eyewitness observations were obtained from 12 sites along 90 km of affected coast, from the mouth of the Matina River, north of Limón to Gandoca, north of the Costa Rica-Panama border. Researchers from the University of Panama Institute of Geosciences recorded observations from 14 additional sites in Panama in the fall of 1991 (Camacho, 1994).
The questions asked during the Costa Rica and Panama field surveys (Fig. 3) were organized into three primary categories:
● Data pertaining to the respondent. Questions 1-5 ask the respondents whether they actually witnessed the tsunami or wave, where they were, and what they were doing at the time.
● Data pertaining to the tsunami. Questions 6-9 ask for information about the water activity (the type of disturbance, its effect, and the direction of wave behavior) and the respondent's reaction.
● Data pertaining to damage caused by the tsunami. Question 10 asks for information about building and structural damage caused by the waves and the location of these structures relative to the shoreline.
● Additional Information. Questions 11-13 ask for additional information not covered above as well as information related to injuries, fatalities, and their circumstances; whether the respondent received a community tsunami alert or warning; and any response to the alert or warning.
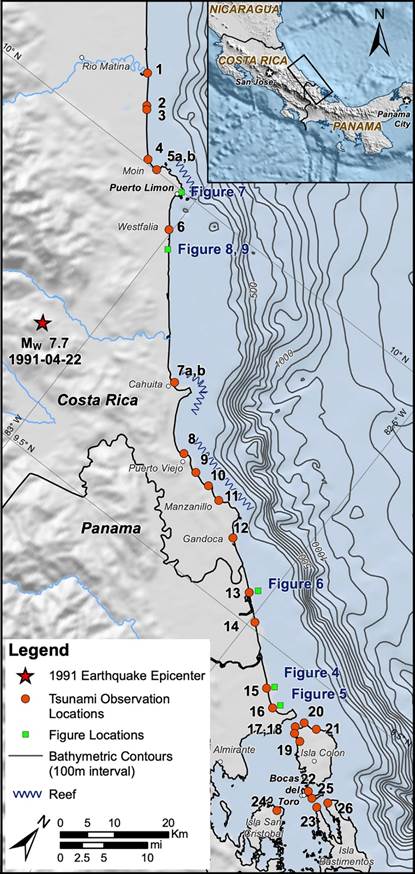
Fig. 1: Map showing locations of photographs (green squares) and questionnaire responses (red circles) collected in Costa Rica (sites 1 - 12) and Panama (sites 13 - 26) following the 22 April 1991 Limón, Costa Rica tsunami. 1991 Mw 7.7 earthquake epicenter is shown as a red star. Coastal coral reefs shown as jagged lines. Background topography and bathymetry from GEBCO Compilation Group (2020).
Tsunami Magnitude Scale
| Tsunami magnitude, m* | Significance |
| -1 | hmax ~ 1/2 m; minor tsunami |
| 0 | hmax ~ 1 m; no damage |
| 1 | hmax ~ 2 m; house damage along coastal areas, ships washed ashore |
| 2 | hmax ~ 4 - 6 m; some destruction of houses, considerable loss of life |
| 3 | hmax ~ 10 - 20 m; damage area along the coast about 400 km |
| 4 | hmax greater than 50 m; damage area along the coast more than 500 km |
| *Tsunami magnitude, m = log2hmax, where hmax is the maximum height in meters measured at a coast 10-300 km from the tsunami origin (Iida, 1970) |
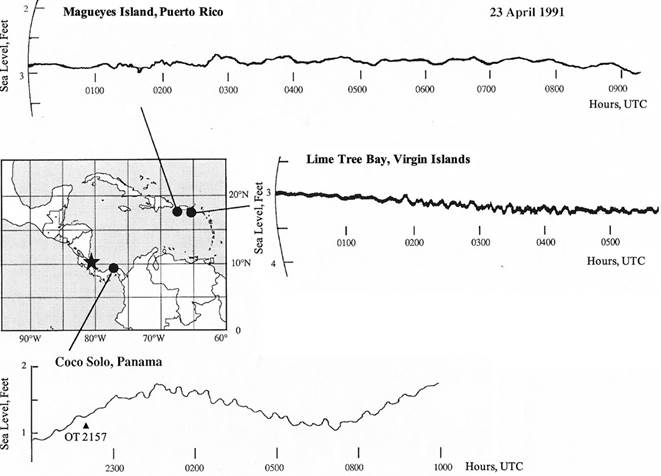
Fig. 2: Tide gauge records of the 1991 Limón, Costa Rica tsunami. Inset map shows the location of the tide gauges with respect to the epicenter (star). Vertical record scale in feet, horizontal scale in hours (Coordinated Universal Time, UTC). (a) Coco Solo (Cristobal) Panama (9.35° N, 79.92° W). Earthquake Origin Time (2157 UTC) shown by arrow. Maximum peak to trough amplitude is approximately 3 in (7.6 cm); both (b) Magueyes Island, Puerto Rico (18.22°N, 67.16°W) and (c) Limetree Bay, St. Croix, Virgin Islands (17.69°N, 64.75°W) show maximum peak to trough amplitudes of ~ 3 in (7 cm).
Summary of eyewitness observations
Eyewitness accounts of tsunami activity in Costa Rica and Panama following the 1991 Limón earthquake are summarized below. Figure 1 shows the survey site locations and Table 2 lists a summary of the questionnaire responses at those sites. Tsunami runup and coseismic uplift measurements from Plafker & Ward (1992) are also listed in Table 2 as a reference. This report supersedes an earlier, unpublished version (Nishenko et al., 1994) that has been referenced by O'Loughlin & Lander (2003) and the NGDC/WDS Global Historical Tsunami Database (2021). The survey information is also contained in a Google Earth KMZ file located in Appendix 2 of the Electronic Supplement.
All of the observers in Costa Rica and Panama noted that the sea was calm prior to the earthquake (1557 local; 2157 Coordinated Universal Time, UTC) and that no emergency warnings were issued before the tsunami occurred. Depending on location, the sea initially receded 20 to 500 m from the shoreline. The exposure of recognizable features such as reefs and sandbars provided a basis for a more quantitative estimate of the amount of withdrawal in places.
Following the initial retreat, two principal types of runup behavior were observed. The first consisted of a 2 to 3 m high wave which advanced rapidly to the beach. Runup varied according to location and ranged from 10 to 100+ m inland. This behavior was observed at the mouths of major rivers in the area, including Boca Matina (#1) and Bocas del Pantano (#2). Waves were noted to have overtopped 3 m high dikes at the mouth of the Moin River (#5) and penetrated 1 km upstream at the Estrella River (near #7). Widespread liquefaction along the coast and compaction-induced subsidence of poorly consolidated sediments appear to have locally amplified runup effects at the mouths of large rivers (EERI, 1991; Denyer et al., 1994). Large waves were noted along beaches at Puerto Viejo (#8), Punta Uva (SE sector) (#10), Manzanillo (#11), and Gandoca (#12). While no significant damage resulting from the runup was reported by observers, two drownings are reported to have occurred in the canal near Matina (#1) due to the sudden increase in water height. A third drowning has also been documented near Moin (Chacón-Barrantes, personal communication, 2021). Large waves and fast currents were also noted at sites facing the Caribbean in Bocas del Toro, Northwestern Panama. Onshore flooding was noted at Playa de Julio Abrego (#15, Fig. 4), Tiribibi Point (#16, Fig. 5), and Lime Point (#17). Elsewhere, observers described the water activity as a series of strong currents (West Knapp (#18), Ground Creek (#19) and Nancy Key (#23)). Sand deposition by the tsunami was also noted by the respondents at many locations (12 Millas de Moin (#3), Westfalia (#6), Manzanillo (#11), and Gandoca (#12)). At the San-San Natural Refuge (#13, #14), a layer of sand, approximately 1 m thick was deposited on the beach creating dunes and covering turtle nests (Fig. 6).
The second type of runup consisted of a gradual increase in water level without a large wave. In some locations, the sea returned an hour after the initial retreat. This behavior was noted both in areas that experienced coastal uplift (Moin (#5), Limon (Fig. 7), and Cahuita (#7)) and in areas surrounded by fringing reefs (Limón-Moin, Cahuita, Manzanillo, Puerto Viejo in Costa Rica, and Boca del Drago in Panama) which appear to have acted as natural wave barriers or breakwaters (Fig. 1). One observer in Cahuita noted that the water returned to a level that was lower than before the earthquake. The coseismic coastal uplift reported at Cahuita is 38 cm (Plafker & Ward, 1992). The maximum coseismic uplift offshore Cahuita (#7) and Manzanillo (#11) may be comparable to, or larger than, the uplift north and west of Limon (125-140 cm) based on measured tsunami runup heights (Plafker & Ward, 1992).
Discussion
The 1991 Limón tsunami survey demonstrated the utility of having a readily available questionnaire to distribute immediately after the event to capture perishable information related to the local characteristics and behavior of smaller tsunamis. Eyewitness observations from 26 sites along 150 km of affected coast, from Rio Matina, Costa Rica to Bocas del Toro, Northwestern Panama described a variety of wave and runup behavior. The maximum wave height is estimated to be 2 to 3 m, and the inundation and flooding extended between 10 and 150 m inland depending on local conditions. Coseismic uplift of the coast and the presence of fringing reefs minimized the impact of flooding in a number of coastal areas. Elsewhere, tsunami runup effects were amplified at other locations from the differential compaction of unconsolidated sediments at river mouths.
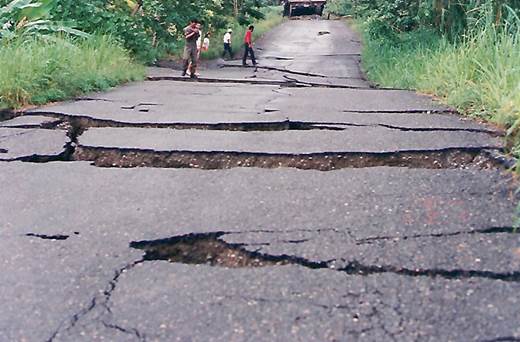
The 1991 earthquake and tsunami demonstrated the vulnerability of the coastal region to strong ground shaking, coseismic uplift and flooding. Local communities and economies were affected by limited coastal access due to significant bridge and roadway damage (Figures 8 and 9; EERI, 1991). While little tsunami-related property damage was reported, two or more drownings occurred at the canal near Matina and near Moin. No emergency warnings were issued before the tsunami occurred. Preparedness programs can educate residents to run to higher elevations when they feel strong ground shaking along the coast - even in the absence of a siren or other warning.
Information about the behavior of recent smaller tsunamis provides a valuable context for interpreting accounts of earlier Caribbean earthquake-related tsunamis. The deposition of sand near the mouth of the San-San River in 1991 is similar to descriptions of tsunami sand deposited on the coast near Gandoca and Monkey Point, near the Costa Rica-Panama border, during the 7 May 1822 (Ms 7.5+) earthquake and tsunami (Roberts & Irving, 1827). Flooding was also noted to have occurred in bays and the mouths of rivers along the Caribbean coast of Costa Rica (González-Víquez, 1910). Farther east, the 7 September 1882 earthquake (Ms 8.3), located in the North Panama Deformed Belt offshore of the San Blas coast of Northeastern Panama, created a tsunami with 2 to 3 m high waves, great destruction, and nearly 100 deaths on the islands of the San Blas archipelago. The French Panama Canal Company tide gauge near Colon recorded a maximum height of 62 cm (Víquez and Toral, 1986; Mendoza and Nishenko, 1989). The April 26, 1916 (M 6.9) Almirante, Panama earthquake also created a small local tsunami that is reported to have covered the southern tip of Carenero Island in the Bocas del Toro Archipelago minutes after the event (Reid, 1917; Duda, Khattri, Purcaru &Schick, 1990).
Hurricane-related flooding and storm surge occurs more frequently than tsunami flooding along the Caribbean coast of Costa Rica and Panama, yet both can produce comparable flooding and coastal impacts. Addressing these common hazards through identification of coastal flooding and tsunami evacuation areas, the marking of evacuation routes, and implementation of coastal building/land use development guidelines can help local communities to become more resilient in the future.
Summary of 22 April 1991 Limón, Costa Rica Tsunami Field Study Observations
| Site | Location | N Lat º | W Long º | Description | Runup Height (cm)* | Coseismic Uplift (cm)* | Site Characteristic |
| Costa Rica | |||||||
| 1 | Boca del Rio Matina | 10.12º | 83.19 º | The water retreated 400 m followed by large waves that flooded 180 m inland. Two drownings occurred in the canal near Matina. Widespread liquefaction. Dead fish were observed following the tsunami. | Beach/ River Mouth | ||
| 2 | Boca del Pantano | 10.07º | 83.16º | The water first receded ~100 m and then returned within 3 min without flooding. | Beach | ||
| 3 | 12 Millas de Moin | 10.07º | 83.16º | Two minutes after the earthquake, a 2 m wave flooded 30 to 70 m inland. Sand movement. | Beach | ||
| 4 | 6 Millas de Moin | 10.00º | 83.10º | The water slowly retreated about 20 m | 135 | Beach | |
| 5 | Moin | 10.00º | 83.08º | The water retreated about 200 m. A sea wave overtopped 3 m high dikes in the Moin River. | 125-140 | Harbor/ River Mouth | |
| 6 | Westfalia | 9.94º | 83.00º | The water retreated about 200 m and returned to the shoreline without appreciable runup or flooding. Sand movement. | 130 | 74 | Beach |
| 7 | Cahuita | 9.74º | 82.84º | The sea receded 75 m then returned slowly to a level lower than previous. Dead fish were observed. | 38 | Reefs | |
| 8 | Puerto Viejo | 9.66º | 82.76º | The sea receded 100 m followed by a large wave, receded again and was followed by a large wave with 30 -70 m runup. Sand movement and dead fish were also noted. | 155 | 38-45 | Reefs |
| 9 | Final de Cocles | 9.64º | 82.72º | The sea receded 20 m then returned slowly over a 5 - 6 min period with no runup. | 29-54 | Beach and Cliffs | |
| 10 | Punta Uva | 9.64º | 82.69º | Water retreats 400-600 m | 200 | 40-45 | Beach |
| 11 | Manzanillo | 9.63º | 82.66º | The sea receded 180 m and returned in 5 min to flood 30 to 70 m inland. Sand movement and 1.5 m sand mounds were deposited. | 83-130 | 30-40 | Beach |
| 12 | Gandoca | 9.60º | 82.60º | The sea receded 300 m in 5 min and returned to flood about 70 m inland. Sand Movement. | 125 | 30-40 | Beach |
| Panama | |||||||
| 13 | San-San Natural Refuge | 9.54º | 82.53º | Tsunami waves deposited a great deal of sand on the beach near the mouth of the San-San River, a wildlife refuge near the Costa Rica border, creating dunes which covered numerous turtle nests with approximately 1 m of sand and caused a decrease in the number of newborn turtles (see Fig. 6). | Beach | ||
| 14 | 9.51º | 82.49º | |||||
| 15 | Playa de Julio Abrego | 9.43º | 82.41º | A farmer reports that the before the quake occurred, the sea was very quiet. Minutes after the event the sea receded between three and six times. The last wave was the largest and the water penetrated 100 m inland. The NE-SW trend of fallen palm trees and other types of vegetation surrounded by sand and onshore flooding is seen in Fig. 4. | Beach | ||
| 16 | Changuinola River/ Tiribibi Pt. | 9.42º | 82.38º | Figure 5 shows the onshore flooding in this area and a zone of brown grass and vegetation parallel to the coastline. Sand deposition and fast currents | Beach | ||
| 17 | Lime Point (Boca del Drago) | 9.41º | 82.33º | Every person interviewed at this location reports that the sea was very quiet before the earthquake; but one-half to one hour before the event the sea was unusually warm. The sea receded approximately six times out to the coral reefs (approximately 100 m from shore) which looked like a stone wall. All six times the sea returned with a great roar and noise. The last wave was estimated to be 2 m high and flooded parts of the coastal road. This estimate was verified in the field by one of the authors (E. Camacho). The following day, the Boca del Drago passage had many dead fish floating in the water. Sea recedes 6 times and exposed reefs. Flooded coastal roads | Reef | ||
| 18 | West Knapp Hole | 9.41º | 82.33º | This site is located in the coast facing Almirante Bay. Before the earthquake, the sea was calm. Minutes after the quake, there was a great turbulence in the sea, similar to rapids of the strong current of a river. The strong current flooded from 5 to 10 m of the beach. Great turbulence with strong currents observed after earthquake. 5-10 m runup | Beach on Almirante Bay | ||
| 19 | Ground Creek | 9.40º | 82.31º | The sea was quiet before the quake. Water receded several times and returned as a strong river current approximately 0.6 m high, which deposited many fish along the banks of the creek which were flooded in some parts up to 10 m inland. Water receded, returns as strong current 0.6 m high. 10 m runup | Beach on Almirante Bay | ||
| 20 | Punta Cauro | 9.43º | 82.32º | This site faces the Caribbean Sea. The sea was quiet before the earthquake. The sea receded five times and returned making great noise. One witness left some clothes drying on a rock some 2 m or more above the surface of the water near a cliff. After the high waves ceased, she returned to get her clothes, and discovered they had been taken by the waves. She thinks the last wave was the one that took her clothes. A few days later, she recovered her clothes, which may have been brought back by the strong sea currents which run parallel to the coast in this area. Water receded 5 times and the last wave was ~ 2 m high. | Beach with Cliffs | ||
| 21 | Boket Bay | 9.43º | 82.30º | This site faces the Caribbean Sea. Ten to fifteen minutes after the earthquake, a 2.5 to 3 m high wave was observed from a house standing on top of a hill.2.5-3.5 m wave 10-15 min after earthquake. | Cove | ||
| 22 | Bocas del Toro | 9.34º | 82.25º | The sea was quiet before the earthquake. Ten minutes after the event, the sea receded approximately 400 m from the cove facing the town. The sand bar, Las Delicias (Grassy Bank) which is usually covered by 0.6 to 0.7 m of water, emerged and remained subareal from 5-7 minutes. After this period, several 0.6 to 0.7 m high waves started to enter the cove with great force. The water was full of sediment and flooded 100 to 150 m inland, mainly on the north part of town, which is located in an extremely flat area. Water receded 10 min after earthquake and exposed an offshore sandbar usually 0.6 m deep. Wave runup 10-15 m. | Reef | ||
| 23 | Nancy Key | 9.33º | 82.22º | As observed from Hospital Point, 10 to 15 minutes after the earthquake, the sea receded several times and returned as a strong river current from Bocas del Toro passage. Water receded several times and returned as a strong current. | Point | ||
| 24 | Isla San Cristobal | 9.29º | 82.27º | In the northwest portion of the island, in the mouth of Paloma Creek, the sea receded several meters for approximately 45 minutes. Many fish got trapped in the dry terrain. The water returned as a slow wave recovering the areas that had emerged minutes before. .Sea recedes several meters for 45 min, water returns as a slow wave. | Creek | ||
| 25 | Isla Carenero | 9.34º | 82.23º | Approximately 15 to 20 minutes after the earthquake, the sea receded, and the usually submerged sand bank Las Delicias could be seen for about 15 minutes. The sea returned with just one very gentle wave and penetrated 100 to 150 m inland crossing the southern tip of the island, which is an extremely flat area. The inhabitants that remained on the island report that the water reached to their knees. The southern portion of the island remained flooded for approximately 20 minutes before the sea receded with great strength back to its original stage. Sea receded 15-20 min after earthquake, remained out for ~ 15 min and returns as gentle wave with 100-150 m run up | Beach | ||
| 26 | Isla Bastimentos | 9.35º | 82.21º | In the northwest portion of the island, known as Old Bank, the sea receded several meters 10 to 15 minutes after the earthquake. Some submarine vegetation could be seen during this period of time before the sea gently returned 15 minutes later. The sea receded 10-15 min after earthquake and returned gently. | Reef | ||
| * Runup heights and coseismic uplifts from Plafker and Ward (1992). Site specific information is provided in Appendix 2 of the Electronic Supplement. |
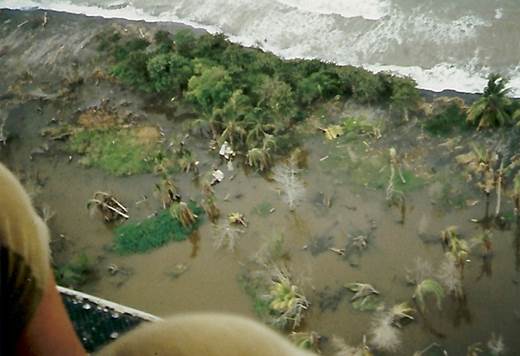
Fig. 4: Near vertical air photograph of an area flooded by the tsunami at Playa de Julio Abrego, Panama (site 15, Fig. 1). Note the onshore flooding and the NE-SW trend of fallen palm trees.
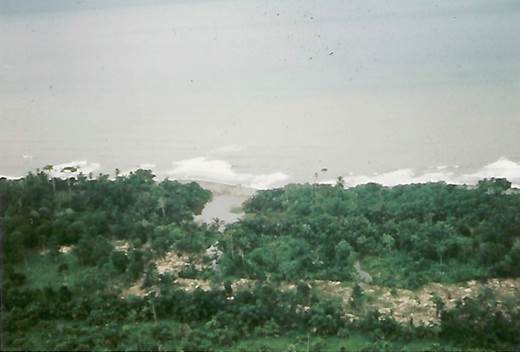
Fig. 5: Near vertical air photograph of an area inundated by the tsunami between the mouth of the Rio Changuinola and Tiribibi Point, Panama (site 16, Fig. 1). Note the onshore flooding in the center of the photograph and zone of brown vegetation in the lower portion of the photograph.
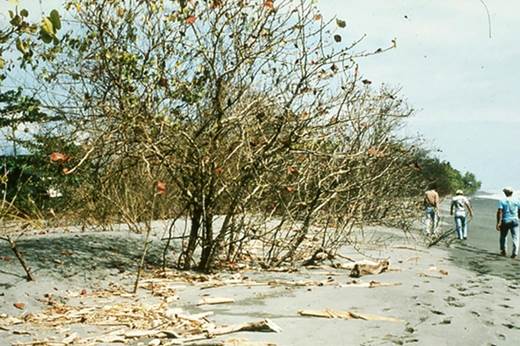
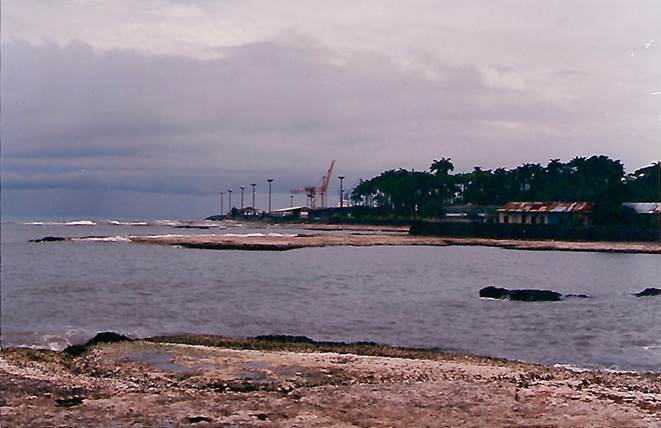
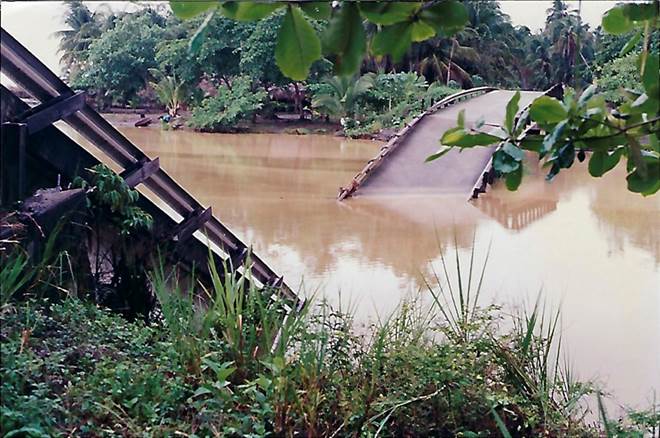
Fig. 8: Damage to the Vizcaya River bridge, 10 km south of Limón, due to soil liquefaction and lateral spreading.