




 English (pdf)
 Article in xml format
 Article references
 Automatic translation
 Send this article by e-mail
 Cited by SciELO
  Similars in
SciELO
Similars in
SciELO  uBio
uBio 
 Permalink

Introduction
Warming is already significant in Central America (CA) and the Caribbean (Alfaro-Córdoba et al., 2020; Arias et al., 2021; Castellanos et al., 2022; Hidalgo et al., 2019; Jones et al., 2016; Stephenson et al., 2014) and may be magnified even further in the future (Almazroui et al., 2021; Arias et al., 2021; Castellanos et al., 2022; Hidalgo et al., 2013; Hidalgo et al., 2017; Imbach et al., 2018). For CA, a decrease in precipitation is projected causing an increase in the severity and frequency of agricultural and ecological drought events, especially during the second half of the twenty-one century (Almazroui et al., 2021; Arias et al., 2021; Castellanos et al., 2022). This reduction in precipitation increases aridity, makes the region vulnerable and puts it at risk due to the reduction in the supply of water resources in the isthmus (Castellanos et al., 2022).
The Caribbean slope of CA generally has a humid tropical climate, type Af according to the Köppen classification, whose characteristics are regular raining conditions almost in all months, therefore there is no well-defined dry season. The average temperature is above 18 °C every month, astronomical winter does not occur, and annual rainfall is abundant and exceeds evaporation (Fallas & Oviedo, 2003; Galvin 2007). However, when using other climate classifications with higher spatial scale such as those of Thornthwaite or Hargreaves (Pérez-Briceño et al., 2017), this slope may present important spatial variations, mainly due to the complex topography of the terrain (Quesada-Román & Pérez-Briceño, 2019) and the action of multiple oceanic and atmospheric forcing forces acting on varied time and space scales (Durán-Quesada et al., 2020; Maldonado et al., 2018; Orozco-Montoya & Penalba, 2023).
In spite of the fact that the CA Caribbean slope does not show a well-defined dry season, drought periods, along with warmer temperatures, occur modulated by climate variability. An example is the recent event from 2020 to 2024 reported by the Costa Rican Meteorological Institute (Madriz, 2023).
According to Alfaro et al. (2024), the Central American Caribbean slope is located windward of the trade winds which are intrinsically connected with atmospheric pressure variations of the North Atlantic Subtropical High or NASH (Taylor & Alfaro, 2005). These trade winds are very consistent all year round and have a northeast-east component over the isthmus that interacts with the complex topography of the region (Alfaro et al., 2018; Amador et al., 2016; Durán-Quesada et al., 2020; Hidalgo et al., 2015; Sáenz & Amador, 2016). In addition, they transport moisture from the Caribbean Sea (CS) to the Eastern Tropical Pacific (ETPac) (Durán-Quesada et al., 2010; Durán-Quesada et al., 2017). Much of this moisture is used by different precipitation-producing mechanisms, associated with rainfall in this slope (e.g. Hidalgo et al., 2015).
Several studies like Alfaro et al. (2024), Garro-Molina et al. (2023), Kaufmann & Thompson (2005) and Orozco-Montoya & Penalba (2023) describe the annual cycle of precipitation and air surface temperature in the Caribbean slope of southern CA. Precipitation climatology shows two maxima, one in November and another secondary one in July, with an absolute minimum value during the month of March. This minimum value in March is explained by the little convergence of humidity observed in the region between the months of January and May (Alfaro, 2002). The rainiest months are November and December. During these months, the increase in the magnitude of the trade wind over the region begins (Alfaro et al., 2018; Amador et al., 2016), as well as the incursion of cold fronts into the Caribbean Sea also (Amador et al., 2006; Chinchilla et al., 2016; Chinchilla et al., 2017; Zárate-Hernández et al., 2013), which favors the occurrence of rains and extreme events in the Caribbean slope. The month of July presents a secondary maximum, in accordance with a maximum in the convergence of humidity in the Caribbean Sea (Alfaro, 2002) and the absolute maximum of the Caribbean Low-Level Jet (see for example Amador, 2008; Maldonado et al., 2018; Ugalde, 2022), which favors the mechanism proposed by Hidalgo et al. (2015). This mechanism is a precipitation source over the Central American Caribbean coast. A secondary minimum is also observed during the months of September and October (SO). During these months the magnitude of the trade wind is minimal (Alfaro, 2002; Alfaro et al., 2018; Amador et al., 2016; Sáenz & Amador, 2016; Taylor & Alfaro, 2005) which does not favor the transport of moisture towards the Central American isthmus (Durán-Quesada et al., 2010; Durán-Quesada et al., 2017), also observing the occurrence of equatorial westerlies (trades of the southern hemisphere) with a southwest component over the ETPac. During this two-month period of SO is also when the highest probability of occurrence of tropical cyclones occurs in the CS, near CA (Alfaro & Quesada, 2010; Alfaro et al., 2010), favoring the occurrence of synoptic westerlies over the region, due to the induced circulation of the ETPac towards the CS associated with the low pressures characteristics of these types of systems (Hidalgo et al., 2020; Hidalgo et al., 2022; Peña & Douglas, 2002). It should be noted that this particular atmospheric configuration does not favor rains in the CS, especially in the southern part of the isthmus. The circulation can also be induced by the position of some tropical cyclones in the ETPac (Hidalgo et al., 2020; Hidalgo et al., 2022), with September being the month with the highest occurrence of named tropical cyclones in the ETPac (Amador et al., 2016).
The monthly average air surface temperature presents also two maxima in the months of May and September, in which the intensity of the trade winds is weaker (Alfaro et al., 2018; Amador et al., 2016); therefore, since there is not much moisture transported towards the CS (Durán-Quesada et al., 2010; Durán-Quesada et al., 2017), there are fewer clouds and more solar radiation (Alfaro, 2002), which increases the surface air temperature. The lowest average monthly air surface temperature occurs in January, during the boreal winter, the rainiest season in which there is also the peak of cold front occurrences in the CS (Amador et al., 2006; Chinchilla et al., 2016; Chinchilla et al., 2017; Zárate-Hernández et al. 2013).
Central American climate presents north-south and east-west contrasts; high spatial resolution scenarios are important to guide local decision maker processes, suggesting that local risk management and planning strategies should be designed with a highly specific approach to each location or region. This implies that, even in geographically nearby areas, the measures taken may not necessarily be transferable due to differences in local climate projections (Hidalgo et al., 2023).
To analyze these variations, the objective of this work is to study the observed and projected latitudinal gradients for precipitation and temperature in three Southern Caribbean locations of CA: Bluefields (Nicaragua), Limón (Costa Rica) and Bocas de Toro (Panamá). The idea is to characterize their future changes and determine if there are differences or similarities in a north-south direction.
Materials and methods
Data: Monthly precipitation (P) and temperature (T) data from General Circulation Models (GCMs) from 1979 to 2099, shown in Table 1, were downloaded from the Weather Research & Forecasting model data repository. (WRF, https://esgf-node.llnl.gov/projects/cmip6/) to perform a statistical downscaling process and thus bring them to a resolution of 1 x 1 km. These models are part of the latest generation of the Coupled Model Intercomparison Project-Phase 6 (CMIP6; Balaji et al., 2018; Eyring et al., 2016) used by the Intergovernmental Panel on Climate Change (IPCC). Models were selected from the repository that proved to have less P and T biases in the region according to Almazroui et al. (2021). With respect to this, the biases in precipitation and temperature of different models with respect to several observed datasets are shown. The selection of a subset of the best 9 models from a total of 31 is first based in a bias analysis considering a threshold of 1.5 standard deviations (± 1.5 STD) about the multimodel mean bias for the historical period. Models with bias exceeding the threshold do not pass this first test and are not candidates for selection in the subset set of best models (Almazroui et al. 2017a; Almazroui et al., 2017b). The second step consists of testing the pattern correlation coefficient (PCC) and the root mean square error (RMSE) for annual mean temperature and precipitation for each candidate model and the observations. For temperature (precipitation), models with an RMSE of less than 2 °C (1 mm day-1) and a pattern correlation above 0.96 (0.60) are considered for selection. Models that satisfy both criteria are then added to the set of selected models (Almazroui et al., 2021).
Table 1
General Circulation climate models (GCMs) were used in the study.
Data
Years
Spatial Resolution
ERA5
1979-2014
0.25° x 0.25°
WorldClim
1979-2014
0.00833° x 0.00833°
ACCESS
1979-2099
1.875° x 1.25°
AWI
1979-2099
0.9375° x 0.9375°
CAMS
1979-2099
1.25° x 1.12149°
EC - EARTH3
1979-2099
0.703125° x 0.703125°
EC - EARTH3-Veg
1979-2099
0.703125° x 0.703125°
MP1
1979-2099
0.9375° x 0.9350616°
GFDL
1979-2099
0.703125° x 0.703125°
UKESM1
1979-2099
1.875° x 1.25°
The first two products (ERA5 and WorldClim) correspond to monthly data that were used for the statistical downscaling change procedure and the rest to the GCMs.
The data necessary for bias correction were obtained from the ERA5 reanalysis database (Hersbach et al., 2020) through the Copernicus Climate Change Service (Copernicus Climate Change Service, 2018), corresponding to the fifth generation of the climate model and weather from the European Center for Medium-Range Weather Forecasts (ECMWF). Monthly precipitation (P) and temperature (T) data were downloaded from 1979 to 2014 at a spatial resolution of 0.25o x 0.25º (hereinafter considered the “coarse scale”). The coarse scale domain corresponds to that shown in Fig. 1.
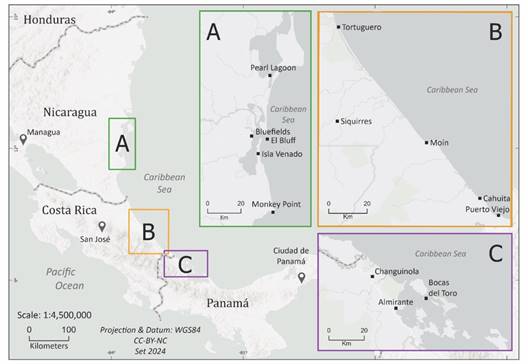
Fig. 1 Location of the three communities considered: A) Bluefields, Nicaragua, B) Limón, Costa Rica and C) Bocas de Toro, Panama.
Monthly P and T climatologies at 1 x 1 km spatial resolution and at global scales were obtained from WorldClim data (Fick & Hijmans, 2017) in http://ccafs-climate.org. A mask was produced for the region under study (communities of Bluefields, Limón and Bocas del Toro, Southern Caribbean region of Central America) and climatologies were sliced using the geographic information system software ArcGIS Pro under a license of the University of Costa Rica. These data are used in the process of downscaling and for determining the climatologies of the sites of interest.
Downscaling: The method used for downscaling is that of Navarro-Racines et al. (2020) with the addition of bias correction according to the following methodology:
a. The data from all the models shown in Table 1 (with the exception of the WorldClim data) were interpolated to the resolution of the ERA5 reanalysis to perform the bias correction that consists of imposing the average and standard deviation of the historical period (1979-2014, baseline) from the reanalysis to the standardized data of the models.
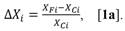
b. The 1 x 1 km climatologies of the WorldClim data are used as a basis for using the delta method of bias correction and downscaling. The procedure consists of expressing the percentiles of each of the grid observations in terms of anomalies with respect to their respective annual averages. In other words, for precipitation (1a):
For temperature (1b):

Where ∆X i is equal to the anomaly of the monthly precipitation or temperature data from the climate models calculated for grid point i, ∆X Fi is the monthly precipitation or temperature value of the model and ∆X Ci the climatological value of that location. The anomaly map of all stations is then interpolated into the WorldClim monthly climatology grids, and that respective climatology for each month is added, as follows, for precipitation (2a):

For temperature (2b):

Where X DFi is equal to the value of the scaled data and which forms a point on the high-resolution mesh (1 x 1 km) for calculating the threat. X OBSi is the value of the weather at the grid point i obtained from WorldClim, ∆X Ii is the anomaly (fractional for P and additive for T) interpolated and corrected by biases mentioned above. The extreme indices were then calculated as in the following subsections. In summary, the coarse resolution P and T data were downscaled, according to the procedure described in this section, to the fine resolution, corresponding to the 1 x 1 km locations of WorldClim grid data. This methodology was evaluated and used by Mendez et al. (2020) in their study for Costa Rica and showed in many cases better results than other bias correction techniques.
The hazard maps represented by the changes in P and T, were constructed considering the climate change maps that represent the ensemble of eight individual models shown in Table 1, based on the historical scenario (1979-2014) compared to the climate for three different future time horizons, namely: near (2020-2030), medium (2040-2060) and far (2079-2099). These horizons were made for the greenhouse gas concentration scenarios SSP1-2.6 (optimistic scenario), SSP2-4.5 (medium scenario) and SSP5-8.5 (pessimistic scenario).
The geovisualization of spatial information shows the information generated in the calculations carried out above. For this purpose, we follow the same procedure of Hidalgo et al. (2023) and several thematic maps were generated that would allow the different variables to be synthesized and be able to perceive spatial relationships or connections visually (Slocum et al., 2023).
Results
Baseline and scenarios generated
Precipitation:Fig. 2 shows the annual averages of precipitation in Bluefields, Limon and Bocas del Toro from the ensemble of eight GCMs used. In Bluefields the map shows more precipitation in the southern region, in Limón the highest precipitation is located in the northern section, and in Bocas del Toro the rainiest region is near the mountains.
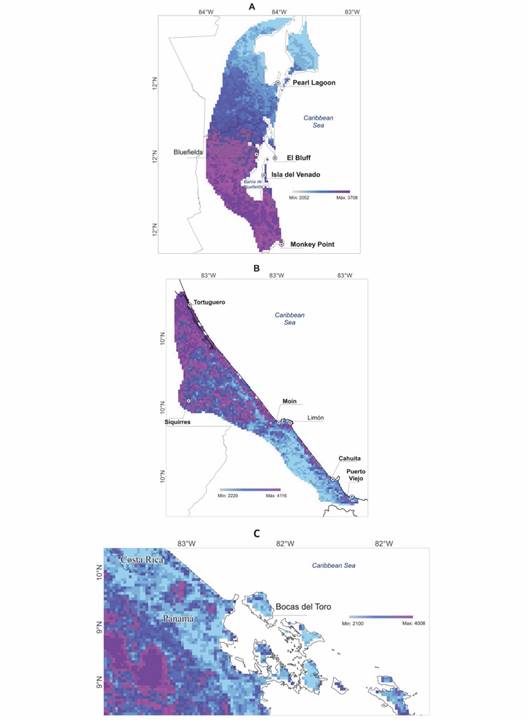
Fig. 2 Historical scenario (1979-2014) showing the ensemble of eight General Circulation climate models for precipitation (mm year-1) in A) Bluefields, B) Limón and C) Bocas del Toro.
Fig. 3, Fig. 4 and Fig. 5 show the changes projected in precipitation by the ensemble of the models for different scenarios and time horizons in Bluefields, Limon and Bocas del Toro respectively. To read these figures, the columns show the horizons of the projections: 2020-2030 (near horizon), 2040-2060 (middle horizon) and 2079-2099 (end of the century horizon); and in the rows the different scenarios with respect to their possible radiative forcings at the end of the century associated with socioeconomic development scenarios: SSP1-2.6 (optimist scenario), SSP2-4.5 (intermediate scenario), SSP5-8.5 (pessimistic scenario). So, as you can observe in Fig. 3 for Bluefields, the first scenario shows a significant increase in precipitation of around 30 %, in the second scenario in the last period there is a decrease of 10 % of precipitation compared to historical. And in the last scenario in the 2079-2099 period the decrease is around 30 % in the whole region of study.
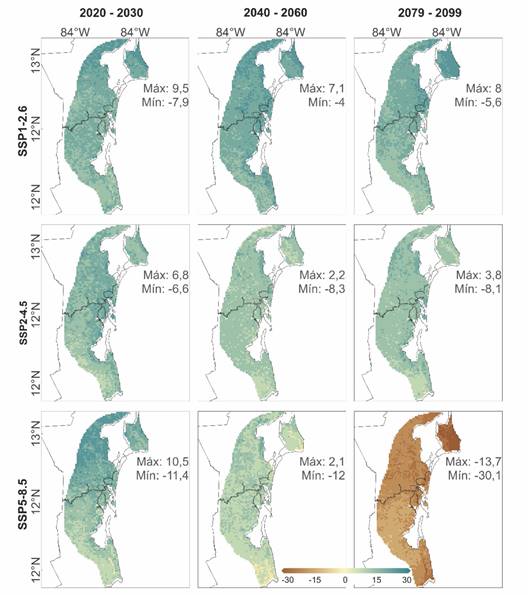
Fig. 3 Precipitation change percentage of SSP scenarios in relation to historical (1979-2014) for different time horizons in Bluefields.
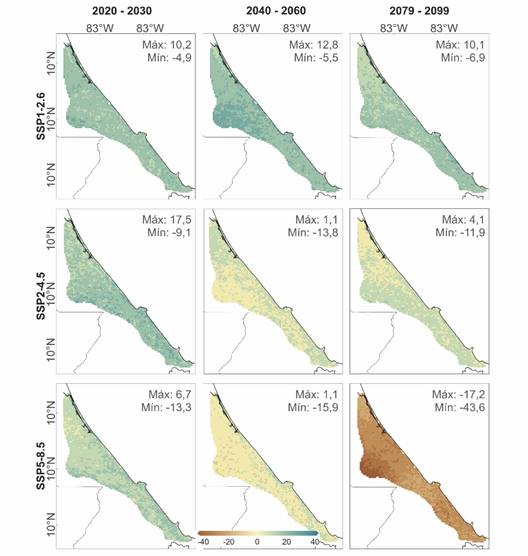
Fig. 4 Precipitation change percentage of SSP scenarios in relation to historical (1979-2014) for different time horizons in Limon.
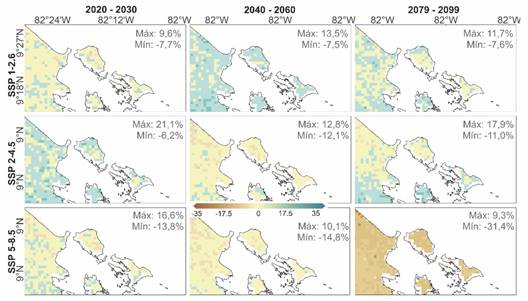
Fig. 5 Precipitation change percentage of SSP scenarios in relation to historical (1979-2014) for different time horizons in Bocas del Toro.
In the case of Limón (Fig. 4) the spatial pattern is similar between scenarios and periods, but here the decrease of precipitation at the end of the century for the pessimistic scenario is around 40 % in a region that is currently dedicated to banana crops.
In the case of Bocas del Toro (Fig. 5) the maximum reduction in precipitation is found for the pessimistic scenario at the end of the century horizon. The maximum reduction is about 31 % of the precipitation for the historical scenario. In the case of this subregion, the optimist and medium scenarios show combinations of precipitation increases and decreases, while the pessimistic show widespread reductions at the end of the century. This result is consistent with the region estimates of Almazroui et al. (2021), where the pessimistic scenario is very dry at the end of the century compared to the other scenarios.
Note that in many cases for all scenarios and subregions there is a general increase in precipitation during mid-century, while generally, it is in the second half of the 21st century that dry conditions are projected (especially for the SSP5-8.5 pessimistic scenario).
Air near-surface temperature:Fig. 6 shows the annual averages of air near-surface temperature in Bluefields, Limon and Bocas del Toro. As expected, topography controls the temperature means, with higher altitudes reporting the lower temperatures and vice versa.
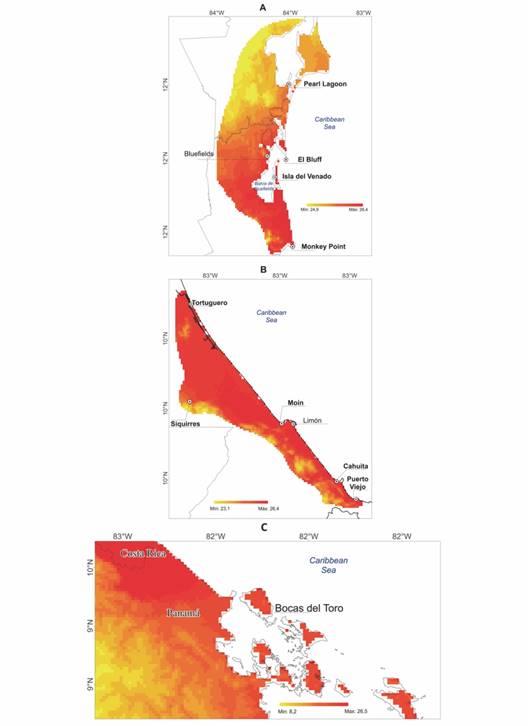
Fig. 6 Historical scenario (1979-2014) showing the ensemble of eight General Circulation climate models for air surface temperature (°C) in A) Bluefields, B) Limon and C) Bocas del Toro.
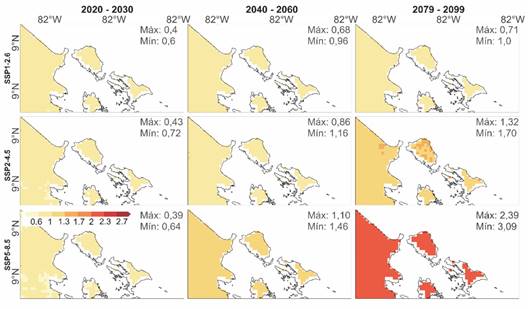
Fig. 7, Fig. 8 and Fig. 9 show the changes projected in air surface temperature by the ensemble of the models for different scenarios and time horizons in Bluefields, Limon and Bocas del Toro respectively. For the three regions, a spatial pattern can be recognized, the temperature increases almost uniformly from horizon to horizon and between scenarios, but the critical one is at the end of the century in the SSP5-8.5 where the increase is about 2.7 °C or higher. This is lower than the maximum warming that is projected to occur in other more arid regions of Central America, where temperatures are expected to increase by as much as 4 oC at the end of the century in the pessimistic scenario (Hidalgo et al., 2017; Hidalgo et al., 2023).
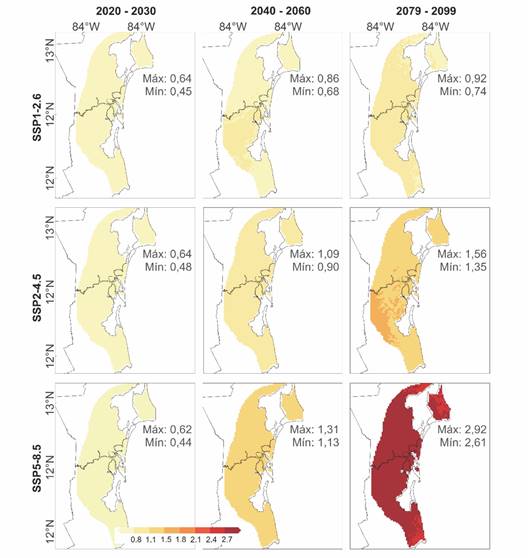
Fig. 7 Air surface temperature change of SSP scenarios in relation to historical (1979-2014) for different time horizons in Bluefields.
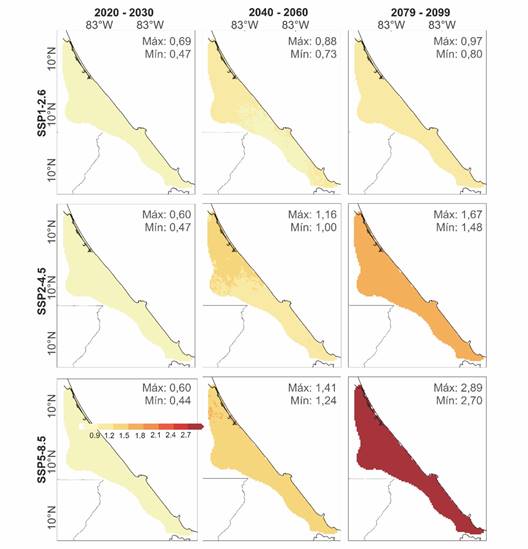
Fig. 8 Air surface temperature change of SSP scenarios in relation to historical (1979-2014) for different time horizons in Limon.
Discussion
This work presents high spatial resolution climate change scenarios, 1 x 1 km, with a historical baseline from 1979 to 2014 and with projections up to 2099. These scenarios were generated from state-of-the-art models of the AR6 of the Intergovernmental Panel on Climate Change or IPCC. The results showed that some regions would go from very humid to humid, based on strong reductions in precipitation of 30 % and warming at the end of the 21st century. This expected increased in the aridity, is going to have impacts on ecology and ecosystem services (Moreno et al., 2019), agriculture (banana plantations for example, Orozco-Montoya, 2023), human consumption due to a water availability reduction per capita (Castellanos et al., 2022) and hydroelectric generation, which is based mainly on the Caribbean slope. Increases in precipitation in the near future can also have impacts on those sectors and also cause floods that are already frequent in the Caribbean slope (Pérez-Briceño et al., 2016).
In addition to the climate change impacts mentioned above, it is also observed and projected for Central American coastal regions, an increase in ocean acidity, sea level and marine heat waves (Arias et al., 2021; Castellanos et al., 2022). These put mangroves and coral reef ecosystems at risk, due to bleaching events; and coastal socio-ecological systems at risk due also to the observed and projected increase in coastal flood and erosion (e.g. Lizano & Pérez-Briceño, 2021). Arias et al. (2021) mention also a slight increase in the annual tropical cyclone occurrences around Central America, this could be associated with more direct and indirect impacts (Peña & Douglas, 2002; Quesada-Román & Campos-Durán, 2023; Quesada-Román et al., 2024) due to extreme precipitation (Hidalgo et al., 2020; Hidalgo et al., 2022) and strong wind events (Pérez-Briceño et al., 2016), among the storm surges associated with the cyclone landings. There is evidence that all these impacts are already affecting populations in poverty and their livelihoods in the region (Castellanos et al., 2022).
According to Hidalgo et al. (2023), generation of high spatial climate change scenarios is necessary because Central America is a region characterized by significant topographic complexity, land use intensity and spatial occurrence of hydrometeorological disasters. This intrinsic variability suggests that local risk management and planning strategies must be designed with a highly specific approach to each locality or region. This implies that, even in geographically close areas, the measures taken may not necessarily be transferable due to differences in climate projections, as the results show for three nearby communities in the Southern Central American Caribbean coastal region.
Cavazos et al. (2024), Ley et al. (2023) and Quesada-Román (2023) mention that there is a great need in Central America to create public policies that address the growing vulnerability of the region and the number of critical ecosystems at risk, as well as mechanisms that ensure their transparency and effectiveness. Given the high vulnerability to climate impacts and the level of emissions in the region, there is a clear need for a greater focus on adaptation responses, within existing public policy instruments. The results presented here are a subset of what needs to happen to help the region become more proactive in collecting the necessary data, closing the adaptation gap, and moving toward the transformations that Central America needs to achieve climate-resilient development, since IPCC reports important gaps in the Central American production of scientific literature. On the other hand, action on adaptation also requires urgent attention to the fact that the climate surface and aerological monitoring network through weather stations in the region is declining. So, there are significant opportunities to strengthen collaboration in these areas between academic institutions and government agencies responsible for systematic Earth observation and meteorological and hydrological monitoring.
Ethical statement: the authors declare that they all agree with this publication and made significant contributions; that there is no conflict of interest of any kind; and that we followed all pertinent ethical and legal procedures and requirements. All financial sources are fully and clearly stated in the acknowledgments section. A signed document has been filed in the journal archives.

