




 English (pdf)
 Article in xml format
 Article references

 Automatic translation
 Send this article by e-mail
 Cited by SciELO
 Similars in
SciELO
 uBio

 Permalink


Wetlands General Insights: Wetlands are commonly understood as complex ecological communities and their associated environments, forming integral components of natural ecosystems (Mitsch et al., 2009). Despite covering only 5 % to 7 % of the Earth’s land surface, wetlands play a disproportionately significant role in global ecological functions (Mitsch et al., 2009). Wetlands contribute to various aspects of human well-being, including the provision of resources for human consumption, maintenance of climate stability, enhancement of water quality, coastal protection, flood mitigation, and preservation of wildlife habitats (Mitsch et al., 2009; Straton, 2006; Van der Valk, 2012). Consequently, wetlands, as ecological entities, not only play a crucial role in maintaining ecosystem connectivity but also deliver indispensable ecosystem services to society (Straton, 2006). The social and economic implications of these services contribute significantly to the overall well-being of human populations (Constanza et al., 1997; De Groot et al., 2006; Turner et al., 2000). Hence, the goal of the present study is to identify ecosystem services from which the local population benefits in Ramsar wetlands in Costa Rica. A detailed explanation is provided in the final part of this section.
Ecosystem services obtained from wetlands are exclusively related to hydrological processes. Due to this nature, there are challenges in assessing the benefits derived from these processes. They often align with non-market values, making it difficult to explicitly quantify ecosystem services (Barbier, 2011). Thus, to sustain the long-term benefits of wetlands, it is urgent that society moves towards their protection and, when possible, rational use (Ramsar Convention Secretariat, 2010).
In 1971, the Convention on Wetlands (Ramsar, Iran) took place, creating an intergovernmental treaty for the conservation and wise use of all wetlands, promoting local and national actions, as well as international cooperation. According to the Ramsar Convention Secretariat, as of August 24, 2023, 172 countries have subscribed to the Ramsar Convention, and Costa Rica has been a signatory since April 27, 1992 (Ramsar Convention Secretariat, 2023a).
The Ramsar List is the world’s largest network of wetland protected areas with international importance. According to this list, there are over 2 400 Ramsar sites covering more than 2.5 million square kilometers. A wetland can be designated as Ramsar if it is a site containing representative rare or unique wetland types or the site is of international importance for conserving biological diversity (Ramsar Convention Secretariat, 2016). Costa Rica alone has 12 Ramsar sites, covering 569 742 hectares (Ramsar Convention Secretariat, 2023b).
Types of ecosystem services: One example of an ecosystem service classification system is provided by Barbier (2011). This system categorizes services into three groups: provisioning, regulating, and cultural. Provisioning services include goods, which are products obtained from ecosystems, such as crops and water. A common example is food for the population, which can be provided by fisheries. Regulating services encompass many processes that regulate the environment, such as soil retention that helps to reduce erosion control. Cultural benefits encompass spiritual, religious, and aesthetic values that contribute to human well-being.
Another detailed classification of wetland ecosystem services has been proposed based on their relationship with human development (De Groot et al., 2006). This classification categorizes services into four types: provisioning, regulating, cultural, and supporting. Supporting services are those that underpin the provision of all other ecosystem services. They include processes such as nutrient cycling and biodiversity, which is essential for maintaining habitat for resident and migratory species.
Complexity of wetland socio-ecological interactions: There are many studies that analyze the ecosystem services provided by wetlands to society. However, due to the complexity involved in analyzing interactions between the biophysical and socio-economic systems at the community level, the local social dimension tends to be overlooked. An approach to viewing and analyzing the complexity of the biophysical and ecological system interacting with the socio-economic system is through the complex systems framework (Reyes et al., 2013; Straton, 2006).
According to Reyes et al. (2013), identifying and measuring ecosystem services and changes in them is particularly difficult due to the interaction of social and ecological factors. Limburg et al. (2002) argue that the socio-economic system indicates the human preferences at a specific moment; this occurs within a socio-economic system where tastes, preferences, and needs are changing (Chopra & Adhikari, 2004; Limburg et al., 2002; Straton, 2006). Therefore, it is advisable to analyze the socio-economic and environmental systems jointly, considering them as part of a co-evolutionary process, where the economic system may exert significant pressure on the environment (Turner et al., 2000). To pursue this, identifying the interconnections between ecosystems and their beneficiaries is the first step (Gunderson & Holling, 2002).
Mapping ecosystem services: In mapping ecosystem services, Burkhard et al. (2013) highlight that it is fundamental for decision-making processes as it provides information about the relevance of conservation investment and land use planning since these require robust data. Moreover, the identification and geospatial location of ecosystem services are prerequisites for future economic valuation. Therefore, it is necessary to understand where and what wetland goods and services benefit the population (Burkhard et al., 2013).
There are ecosystem services mapping tools such as InVEST, ARIES, and GUMBO that are mostly used to map regional and national scales. In this context, regulating services mapping dominates, integrating biophysical information, and less frequently, social values (Crossman et al., 2013). For instance, Crossman et al. (2013) indicate that the sub-national level is the most common scale for mapping ecosystem services. The use of empirical data, including social actors, to map local socio-ecological relations with ecosystem services is rare (Pagella & Sinclair, 2014).
Ecosystem services can be identified and prioritized with stakeholders, including the local population. For this, Cárcamo et al. (2014) propose a network approach. The relevance of identifying ecosystem services based on the population is that people’s perceptions are correlated with the activities and livelihoods directly associated with the wetland. Thus, the socio-ecological system can be better understood (Cárcamo et al., 2014). Furthermore, this approach incorporates the knowledge of the local population and creates local legitimacy for ecosystem services maps, thus helping to enhance any policy intervention to improve wetland management (Pagella & Sinclair, 2014).
Identifying ecosystem services via the population focuses on the social demand side, instead of the capacity of the system to provide those services (Castro et al., 2013). The relevance of this approach is that it shows the societal dependence on ecological life. This is highly relevant since the status of ecosystem services is not only influenced by ecosystem properties but also by societal needs. Hence, there is a need to record and spatially localize the actual ecosystem services collected and consumed by the population (Castro et al., 2013). At the local scale, this approach requires fine-resolution datasets, with the advantage that local farmers and fishermen identify their natural context (Pagella & Sinclair, 2014).
Therefore, the present study contributes to the identification and mapping of ecosystem services at the local level. More specifically, the goal of the present study is to empirically and spatially identify ecosystem services that the local population directly demands from Ramsar wetlands in Costa Rica. For this, we approach the socio-ecological system similarly to Cárcamo et al. (2014) and as Barnes et al. (2019) who analyze the socio-ecological network. Barnes et al. (2019) defined this network as the linked structures between social actors and ecological resources. The socio-ecological network takes place as long as it models the social and ecological relationships at some level, independently if the discussion is focused on one of both dimensions (Sayles et al., 2019).
The case of Costa Rica’s wetlands: According to Xu et al. (2020), no scientific studies on wetland ecosystem services in Costa Rica at the national level have been documented in the international literature. This reflects that the identification and quantification of wetlands in Costa Rica have been major challenges. On this concern, we could identify several, mostly local and regional, research studies done on Costa Rica’s wetlands. The actual number of hectares of registered wetlands is 268 703 (Sistema Nacional de Áreas de Conservación (SINAC), 2023). An examination of the socio-economic contributions of Palo Verde National Park estimates how the park quantitatively and qualitatively benefits society at local, regional, national, and international levels (Moreno et al., 2010). Another study focusing on the livelihoods of communities around Medio Queso wetland analyzes interactions by concentrating on different types of capital (Gutiérrez & Siles, 2008). Alvarado (2008) carried out a comprehensive assessment to estimate interactions among economic, social, ecological, cultural, and institutional components using a multicriteria analysis for Gandoca-Manzanillo wetland.
In the Térraba-Sierpe wetland, several studies have been conducted. For instance, the BIOMARCC-SINAC-GIZ Project, (2012) estimates the capture and fixation of carbon through different ecosystems. Sanchez et al. (2013) identified and valued ecosystem services including tourism, artisanal fishing, “piangua” (a type of mollusk) extraction; in the productive part: oil palm (Elaeis guineensis), pineapple (Ananas comosus), rice (Oryza sativa), dual-purpose livestock, and forestry. A similar approach was used by Barton (1995), who identified and quantified a wide range of ecosystem services. Kocian et al. (2010), relying on literature for quantification, given the lack of local data on ecosystem services. They identified ecosystem services such as flood protection, natural protection against droughts, nutrient cycling, biodiversity, providing “piangua”, and aesthetic value (Kocian et al., 2010). Reyes et al. (2004) assessed the ecosystem services of the Térraba-Sierpe wetland, focusing primarily on three services: fishing, “piangua” extraction, and tourism (including hospitality). Aguilar & Moulaert (2011) proposed the use of multicriteria valuation as a form of participatory valuation, political influence, and conflict resolution for use in the Térraba-Sierpe wetland. Through consultation with experts and key stakeholders, scenarios were constructed.
Aguilar & Moulaert (2011) conducted a study to estimate the loss in ecosystem services due to the conflict in Isla Portillos in the Northeast Caribbean Wetland. This study identifies ecosystem services such as food, drinking water, fuel, plant fiber, among others. In another study, Reyes et al. (2013) identified and valued ecosystem services associated with Las Baulas Marine National Park (PNMLB). This valuation was based on the local tourism cluster: lodging, food, transportation, and tour operation. Proyecto Humedales SINAC-PNUD-GEF (2017) pursued an economic valuation of ecosystem services of Ramsar wetlands for Costa Rica using the method known as transfer value per unit. This method uses secondary information from literature review to identify ecosystem services. The authors complement this method with expert interviews and remote sensing to assign land use categories. This study has been the most relevant found in the literature about identification and valuation of ecosystem services in Costa Rica. However, as Proyecto Humedales SINAC-PNUD-GEF (2017) underlines, each wetland exhibits unique characteristics distinct from others; hence, the optimal ecosystem services assessment process involves developing methodologies that can adjust to this heterogeneity. From this perspective, we propose to approach the communities that interact directly with Ramsar wetlands; thus, we hope to capture the heterogeneity of socio-ecological relations and related ecosystem services in the Ramsar wetlands of Costa Rica.
Materials and methods
We propose a methodological framework to inventory Ramsar wetlands’ ecosystem services and to understand them in light of social actors. This is important since within the Ramsar Secretary, social actors analysis and ecosystem services inventory are two steps that must be carried out to provide a robust context for policymakers and for further economic valuation exercises (De Groot et al., 2006).
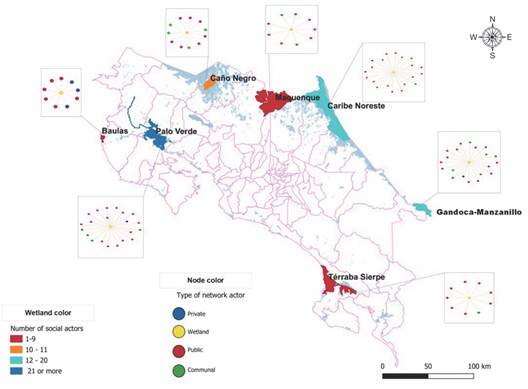
Thus, we propose an approach that considers the activities of the communities that interact directly with Ramsar wetlands to identify ecosystem services. For this, in-depth interviews were conducted with communal leaders. The research instrument focused on questions that helped to identify the usages and relationships that the local population establishes with the wetlands. To identify social actors related to the wetlands, the results of a workshop were used, which took place with the National System of Conservation Areas (SINAC) officials in charge of each wetland. The identification of ecosystem services was conducted in seven Ramsar wetlands in Costa Rica: Las Baulas, Palo Verde, Caño Negro, Maquenque, Caribe-Noreste, Gandoca-Manzanillo, and the Térraba-Sierpe. These wetlands are shown in Fig. 1. The analysis is limited to these seven wetlands because these are the ones where there is direct interaction between the communities and the wetland. In other Ramsar wetlands, such as Isla del Coco and Turberas, there are no communities directly interacting with the wetlands.
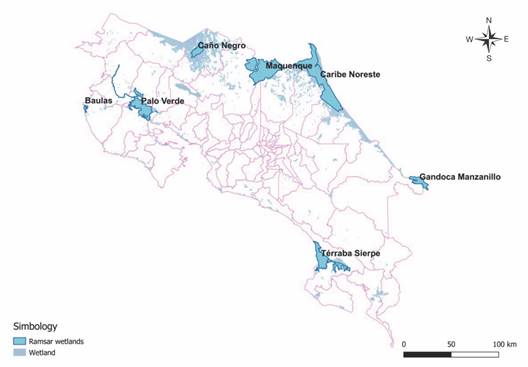
Fig. 1 Costa Rica’s Ramsar wetlands included in the study. Source: self-elaborated based on SINAC (2023).
Once the ecosystem services were identified, an analysis was conducted to determine and quantify which ecosystem services were most relevant. This part used information from a survey that took place between 2015 and 2016 as part of the Wetland Project (Conservación, Uso Sostenible de la Biodiversidad y Mantenimiento de los Servicios de los Ecosistemas de Humedales Protegidos de Importancia Internacional), which was coordinated between SINAC-PNUD-GEF. Besides the empirical research, a secondary literature review was also conducted. The objective of this review was to identify all ecosystem services reported in previous studies. Generally, this methodological approach integrates fieldwork using social research methods such as interviews, a survey, and a participatory workshop, with network analysis. It aims to provide a nuanced understanding of the socio-ecological interactions surrounding wetlands that are evidenced in the ecosystem services.
Mapping social actors: The objective of this part is to determine the interactions between social actors and wetlands. For this, we aim to identify stakeholders and socio-ecological interactions. The final analysis provides valuable insights into the dynamics between social actors and wetlands, aiding in the development of targeted management strategies and fostering a greater understanding of the shared responsibilities and benefits associated with wetland conservation. To analyze interactions, network analysis proves to be a valuable tool for determining the influence and degree of relationships among actors (Bödin & Prell, 2011). In addition, network analysis is crucial for interpreting how natural resources are co-managed, as the actor network reveals communication patterns regarding a resource (Crona & Bödin, 2006).
The analysis of results was based on information gathered in the workshop: “Planning the Wetlands Project at the Conservation Area Level.” This workshop took place from 17th to 19th March 2015 and included the participation of the officials in charge of each Ramsar wetland. There are nine Ramsar wetlands of Costa Rica included in this actors’ map; however, our analysis focuses on only seven out of the nine wetlands. Isla del Coco and Turberas wetlands were excluded from this study for the reasons previously mentioned.
The result of this part is a network where wetlands interact with social actors. A relation is registered if the rangers expressed that there is collaboration and positive interaction between the social actor and the wetland. To present the results, two network statistics were used: indegree centrality and outdegree centrality. Indegree network centrality measures the number of incoming relations, indicating the prominence of an actor as a collaborator with the wetland management processes. The indegree centrality is estimated as follows: , where i is any actor and represents incoming relationships of those linked to a wetland, as they are nominated as contacts (Brandes & Erlebach, 2005). Outdegree, on the other hand, quantifies the number of outgoing relations, highlighting a wetland’s significance in creating interconnections. The outdegree centrality is estimated as follows: , where i is any actor and represents those linked to i, namely, his neighborhood when, i, wetland authorities collaborated with a social actor, their outgoing relations (Brandes & Erlebach, 2005).
By considering these two network statistics, we gain insights into the centrality of actors within the socio-ecological network, shedding light on their relevance and influence in the overall structure. The use of these metrics allows for a comprehensive analysis of the network’s central actors and their respective roles. Additionally, we present the Ego-network of each wetland. An Ego-network, as defined by Crossley et al. (2015), is the network related to any node, i. The actors related directly to this node are known as alters. The ego-net can be limited to the representation of an ego and its alters or can be expanded to include the relations between alters (Crossley et al., 2015). Here, we limit the ego-net to the representation of ego and its alters. This network technique aims to better represent the individual wetland immediate social actor’s circle.
The statistical analysis and network modeling were conducted using the R statistical software (R Core Team, 2023). Specifically, the library igraph (Csardi & Nepusz, 2006). For network visualization, the specialized software Gephi (Bastian et al., 2009) and Cytoscape (Shannon et al., 2003) were used.
Interviews with communal leaders: We interviewed communal leaders because these local actors exhibit many characteristics of an opinion leader, as outlined by Rogers (2003). Opinion leaders have a positive influence on others and enhance the diffusion of ideas, information, and innovations within the network (Burt, 1999; Rogers, 2003; Valente & Davis, 1999). Therefore, interviews with community leaders provided an initial appreciation and helped to list ecosystem services perceived by influential actors of communities in each wetland. The communities were chosen using the criteria to prioritize the most diverse and strongest possible relations with the wetland. To pursue this, we based our selection on the workshop results, personal conversations with the SINAC officials, and the literature review. The experience of the SINAC rangers, the most cited communities, and wetland uses were central. Thus, the goal of the community selection was to identify as many ecosystem services as possible. The key respondents were selected based on initial approximations in the field, recommendations of the SINAC officials, and other local institutions. These actors must be active within the community and have lived long enough to have perceived any change in the interactions between the community and the wetland over time.
Although each wetland has a different number of villages in the surroundings, not all have the same relation with it. As observed in Table 1, there are 143 communities within the influence area of the wetlands. Thus, we worked with 10 % of all the communities, but with those who were identified as most important in a two-way relationship between the wetland and the population, as explained.
Table 1 Number of communities within the wetland influence area.
| Wetland | Number of communities | Selected communities |
| Las Baulas | 21 | -Mata Palo -Villareal |
| Palo Verde | 17 | -El Rosario -Bagatsí |
| Caño Negro | 15 | -Caño Negro -Las Cubas |
| Maquenque | 30 | -Golfito -Boca San Carlos |
| Caribe Noreste | 12 | -Tortuguero -San Francisco |
| Gandoca-Manzanillo | 10 | -Manzanillo -Gandoca |
| Térraba-Sierpe | 38 | -Ajuntaderas -Coronado |
| Total | 143 | 14 |
Finally, two communal leaders of each community were interviewed, except for the case of Las Cubas, in Caño Negro wetland, where only one interview was conducted due to the rejection of a communal leader. In general, four communal leaders per wetland were interviewed, and three in the Caño Negro wetland, resulting in a total of 27 interviews. The interviews were conducted between March and May 2015.
The survey: The survey was conducted with the aim of capturing detailed information on the interactions between the local population and the wetland, which is revealed in the provisioning ecosystem services. The results are a detailed inventory of this type of ecosystem services, quantified for each Ramsar wetland. More specifically, the provisioning ecosystem services are the most dominant and diverse ecosystem services identified by the communal leaders. In this type of services, the socio-ecological relationships are more evident in those activities related to the extraction of a biological wetland product. Thus, our aim is to describe the socio-ecological network that results from this ecosystem service. The objective is mainly to observe the relations between each wetland and the different types of wetland products collected by households, for instance fish, mollusks, and plants.
Therefore, through a survey, it was possible to determine the significant extent to which community residents are connected to wetlands through ecosystem services. The survey was conducted to determine the quantities in which different ecosystem services contribute directly or indirectly to the household. The survey was conducted from September to October 2015, in communities that inhabit and interact with the wetlands.
Based on the previous results of the workshop, literature review, and key informant interviews, along with time and financial limitations, we decided to apply the survey in the two communities that were selected for the interviews with communal leaders in each Ramsar wetland. These communities have a key and close role in the interaction with the wetland, which was our main criterion for the identification of ecosystem services. To guarantee a full mapping of the ecosystem services and the socio-ecological interactions in the communities, the research instrument was applied to all household heads. Thus, we interviewed all (census) household heads within all the selected communities; we did not sample the community (Frank in Carrington et al., 2005). The total population found in the villages differed from the total that the National Institute of Statistics and Censuses (INEC) had from the 2011 census (Instituto Nacional de Estadística y Censos (INEC), 2011). The population dynamics show an increase in some cases and a decrease in others, as shown in Table 2.
Table 2 The surveyed communities.
| Wetland | Communities | Applied surveys | Rejections | Total households |
| Las Baulas | Mata Palo | 71 | 15 | 86 |
| Villareal | 88 | 34 | 122 | |
| Palo Verde | El Rosario | 80 | 8 | 88 |
| Bagatsí | 33 | 4 | 37 | |
| Caño Negro | Caño Negro | 62 | 4 | 66 |
| Las Cubas | 8 | 1 | 9* | |
| Maquenque | Golfito | 25 | 4 | 29 |
| Boca San Carlos | 31 | 1 | 32 | |
| Caribe Noreste | Tortuguero | 105 | 25 | 130 |
| San Francisco | 58 | 9 | 67 | |
| Gandoca-Manzanillo | Manzanillo | 33 | 15 | 48 |
| Gandoca | 44 | 7 | 51 | |
| Térraba-Sierpe | Ajuntaderas | 25 | 0 | 25 |
| Coronado | 81 | 15 | 96 | |
| Total | 744 | 142 | 877** |
*According to the INEC population census of 2011, there were 35 households living in Las Cubas. However, at the moment of the field research, we found that many had left the community. **Based on the INEC population census of 2011, we expected a total of 955 households; nonetheless, we found a dynamic where many communities have reduced their population due to many factors such as unemployment. In other places, like in Coronado, in Térraba-Sierpe wetland, the population was 16 households more than expected, thus, it gained population.
A total of 14 communities were surveyed, representing approximately 10 % of the 143 communities in the wetland influence zone. The total number of surveys conducted was 744, with 140 rejections. Table 2 shows the communities that were surveyed. The total surveys applied per wetland are as follows: Las Baulas with 159, Palo Verde with 113, Caño Negro with 70, Maquenque with 56, Caribe Noreste with 163, Gandoca-Manzanillo with 77, and Térraba-Sierpe with 106. Finally, 85 % of the households were surveyed, and the remaining 15 % rejected to participate in the study.
The information was collected using recall questions about the type of products, species, quantity, and prices (if sold) of the products collected from the wetland over the last 12 months. The use of recall questions has some inconveniences, as the respondents were not always able to recall the exact details of the products. For example, the respondents were able to identify the type of fish they caught and provide an approximate number of fishes, but the details were not enough to establish the species. Hence, we only determined the family of the fish based on the common name provided by the respondent. For any future economic valuation, several factors must be considered; therefore, it is necessary to explore the valuation method that fits best. Products from the sea, such as fish, are mostly sold locally. Conversely, freshwater fish are mostly consumed by households, and if sold, they are also sold locally to neighbors, small supermarkets, or local bars.
To analyze the data, the socio-ecological network was examined as defined by Sayles et al. (2019) and Barnes et al. (2019). The nodes represent either a wetland or a wetland product. The wetland represents the aggregation of the household head’s responses. Since it was possible to estimate the quantity collected from each product by the households, the network is a weighted graph, where the tie represents the quantity of the products (Kleinberg, 1999). Therefore, to identify the most central nodes, network weighted centrality measures must be used. To estimate the degree centrality in the weighted network, two statistics were applied: the hub score and the authority score developed by Kleinberg (1999).
The authority score represents how valuable the wetland product is for the households as they collect (demand) from the wetland. The hub score indicates how crucial a Ramsar wetland is by providing products to many households, playing a key role in offering valuable natural resources for the local population. In the graph, , the non-negative authority weight is , and the non-negative hub weight is . Thus, the value for the authority statistic is: , and for the hub statistic is: , where is a network node. Therefore, a node with value of 1 will have the highest value possible (Kleinberg, 1999). These metrics were calculated using the random surfer model, where relations with larger weights influence the probability of being selected by the surfer (Csardi & Nepusz, 2006). In addition, the Ego-network of each wetland was visualized to better explain the results, using the definition of Crossley et al. (2015). The statistical analysis and network modeling were conducted using the R statistical software (R Core Team, 2023), specifically, the library igraph (Csardi & Nepusz, 2006). For network visualization, the specialized software Gephi (Bastian et al., 2009) and Cytoscape (Shannon et al., 2003) were used.
Finally, we estimated network clusters based on the survey results. The objective of this method is to identify network subgroups that belong to the same category based on the ecosystem products collected by their households. For instance, two wetlands may belong to the same cluster if the products they collect are similar, i.e. such as fish from the same families. To achieve this, we applied the Walktrap method (Pons & Latapy, 2006), which utilizes a random walk technique to construct clusters based on the neighborhood structure of nodes. The results of this analysis are important because wetlands within the same cluster tend to share similar collected or demanded products; therefore, management strategies could be considered in a similar manner.
Results
Literature review: Before delving into the empirical results, we present the main ecosystem services in Costa Rica’s Ramsar wetlands that we found through the literature review. They are detailed presented in Appendix 1-4. The types of ecosystem services with the highest number of identified cases in the literature are provisioning and regulating. Functions such as providing society with raw materials and food are among the most commonly found. Functions like regulating climate and hydrological related functions are also frequently mentioned. Cultural and supporting functions are the ones with the fewest ecosystem services. This may be due to the difficulty in measuring such services and, at times, the lack of resources for research in areas such as ethnology and biological species. Although there is literature about the wetlands, very little is focused on ecosystem services or on the economic valuation of wetlands in Costa Rica.
In summary, Table 3 presents the number of ecosystem services that the literature review led to identifying. The Proyecto Humedales SINAC-PNUD-GEF (2017) is the most complete source because it identified ecosystem services for all seven wetlands of interest. The Térraba-Sierpe wetland has the highest number of services with 23; it is also the one with the most identified provisioning services and regulating services. The wetlands of Las Baulas and Caño Negro have the least number of provisioning services identified. Besides that, the rest of the services are equally distributed.
Table 3 Total mentions of ecosystem services found according to the literature review.
| Wetland | Type | Total | |||
| Provisioning | Cultural | Supporting | Regulating | ||
| Térraba-Sierpe | 5 | 5 | 5 | 8 | 23 |
| Las Baulas | 2 | 4 | 4 | 4 | 14 |
| Caño Negro | 2 | 4 | 4 | 4 | 14 |
| Maquenque | 3 | 4 | 4 | 4 | 15 |
| Caribe Noreste | 3 | 4 | 4 | 4 | 15 |
| Gandoca Manzanillo | 3 | 4 | 4 | 4 | 15 |
| Palo Verde | 3 | 4 | 4 | 5 | 16 |
Source: self-elaborated based on literature review.
Mapping social actors around Ramsar wetlands: Our findings indicate that wetlands interact with three primary types of social actors: communal, public, and private individuals or enterprises. Fig. 2 displays the resulting network, composed of 61 actors with 139 connections. The number of mentions that each actor receives is used to estimate which actors are the most central within the network. In this network, 41 actors (the majority) are public institutions, 8 are communal, and 5 are private-individual actors, such as producer organizations. Fig. 2 illustrates the four types of actors in the network: wetlands (yellow), communal actors (red), public actors (green), and individual actors (blue). The two main actors interacting with the wetlands are the Municipalities (9 relations) and the Ministry of Public Security (9 relations).
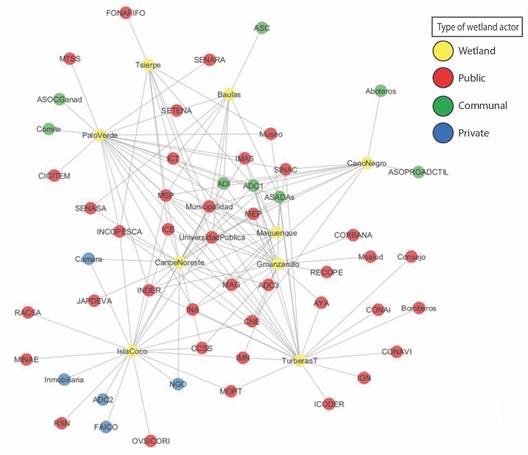
We can visualize the network node size according to the number of incoming links (network indegree centrality). Fig. 3 shows this statistic, with Municipalities and the Ministry of Public Security depicted as the two larger red nodes. Following closely in size is a third actor, Public Universities (8 relations), positioned as the third red node, indicating its significance within the network. It is important to clarify that the position of the nodes in the network is related to their shared relations with others. Thus, we observe larger node sizes for social actors that interact with many wetlands and are positioned at the center of the network. This results in actors with fewer ties being situated at the periphery of the network, forming a core-periphery structure. Additionally, two other important actors, the Costa Rican Institute of Electricity (ICE, 7 mentions), also depicted in red, and Communal Associations (7 mentions), shown in green, are noteworthy.
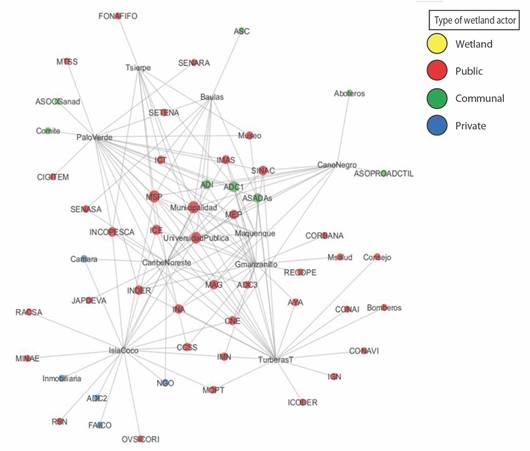
If we determine the size of the node based on the wetlands with the most relations in the network (outdegree centrality), we obtain the network visualization shown in Fig. 4. The wetlands that reported the most ties with other actors were Turberas (22 mentions), Palo Verde (21 mentions), Gandoca-Manzanillo (20 mentions), and Caribe Noreste (20 mentions). Additionally, we find Isla del Coco with 18 mentions, Caño Negro with 11 mentions, and Las Baulas, Maquenque, and Térraba-Sierpe with 9 mentions each. In our study case, Palo Verde, Gandoca-Manzanillo, and Caribe Noreste are those with a denser network. Conversely, Las Baulas, Maquenque, and Térraba-Sierpe are the wetlands with fewer connections to social actors.
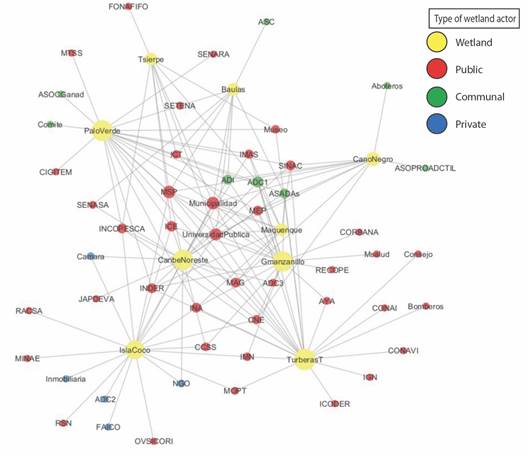
In terms of differences in the composition of the ego-networks, we can differentiate three groups:
Group 1: Wetlands with 20 and 21 or more actors that have a presence of public, communal, and private actors, although there is a majority of public actors. Here we find Caribe Noreste, Gandoca-Manzanillo, and Palo Verde wetlands.
Group 2: Wetlands where the combination of two types of actors is balanced, while the third type is missing. In this category, we find Caño Negro with public and communal actors (11 in total), but without any private actor. Additionally, Las Baulas wetland has only 9 actors, with participation from three private and six public actors, but lacks communal participation in the ego-network.
Group 3: Maquenque and Térraba-Sierpe wetlands, each with only nine actors in the ego-network. In these cases, the network is predominantly composed of public actors, with only one communal actor interacting with them.
The ego-network and the wetland actor composition can be observed in Fig. 5. This figure presents the number of actors associated with each wetland. Both the map and the ego network represent this relational information in different ways, contributing to a better understanding of the socio-ecological interconnections.
Identifying ecosystem services through communal leaders: Based on interviews with communal leaders, numerous ecosystem services were identified, with provisioning emerging as the most prominent service type. Within this category, the provision of timber and non-timber products exhibited the highest diversity and number of ecosystem services. Examples include fishing, freshwater, and drinking water, shrimp, lobster, and mollusk harvesting, all of which are non-timber resources extracted from wetlands for human consumption. Additionally, a variety of agricultural crops were cited frequently by interviewees, such as beans, rice, maize, oil palm, tubers, banana, pineapple, sugar cane, plantain, watermelon, and papaya. Furthermore, pastures and cattle ranging were highlighted as activities benefiting from wetlands, primarily due to water provisioning.
Artisanal fishing was mentioned in six out of the seven assessed wetlands, with only Palo Verde wetland not mentioned by the interviewees. Commercial fishing was specifically noted in Caño Negro Wetland. Various products were reported to be consumed or extracted in several wetlands, including wood (Maquenque and Gandoca-Manzanillo), turtle eggs (Las Baulas), land animals, and lobster (Gandoca-Manzanillo), fresh-water shrimp (Maquenque), and piangua (Térraba-Sierpe). Additionally, the importance of wetland use for transportation was highlighted, particularly in Maquenque. These provisioning ecosystem services identified by communal leaders are summarized in Table 4.
Table 4 Provisioning ecosystem services identified by communal leaders.
| Service | Wetland |
| Traditional-small scale fishing | Térraba-Sierpe |
| Las Baulas | |
| Caño Negro | |
| Maquenque | |
| Caribe Noreste | |
| Gandoca Manzanillo | |
| Timber wood extraction | Maquenque1 |
| Gandoca-Manzanillo | |
| Marine species eggs | Las Baulas |
| Firewood | Caño Negro |
| Hunting for self-consume | Gandoca-Manzanillo |
| Commercial fishing | Caño Negro |
| Lobster extraction | Gandoca-Manzanillo |
| Freshwater shrimp | Maquenque |
| Las Baulas | |
| Caño Negro | |
| Caribe Noreste | |
| Gandoca-Manzanillo | |
| Tree plantations | Maquenque |
| Honey | Palo Verde |
| Shrimps | Caribe-Noreste |
| Gandoca-Manzanillo | |
| Térraba-Sierpe | |
| Mollusk extraction | Térraba-Sierpe |
| Las Baulas | |
| Transport | Maquenque |
| Térraba-Sierpe | |
| Plants | Palo Verde2 |
| Térraba-Sierpe | |
| Fruits 3 | Las Baulas |
| Caño Negro | |
| Caribe Noreste | |
| Gandoca-Manzanillo | |
| Palo Verde | |
| Térraba-Sierpe |
1. Legal. 2. For handicrafts. 3. No plantations, diverse wild and traditional species. Source: self-elaborated based on field data.
In agriculture, the predominant products across most wetlands include rice and beans production, observed in Wetlands such as Térraba-Sierpe, Palo Verde, and Caño Negro. Other monoculture crops are also cultivated in at least two wetlands: palm oil (Térraba-Sierpe and Northeast Caribbean), banana (Northeast Caribbean and Gandoca-Manzanillo), and pineapple (Northeast Caribbean and Maquenque). These crops hold significance due to their extensive production, which necessitates the use of substantial quantities of agrochemicals. Additionally, economically vital monoculture crops encompass tubers such as cassava (Caño Negro and Maquenque), sugarcane (Palo Verde), plantain (Maquenque), and watermelon (Palo Verde).
Among the wetlands, Palo Verde stands out with seven mentioned agricultural products, followed by Térraba-Sierpe with four, Caño Negro with three, Northeast Caribbean with three, Maquenque with three, and Gandoca-Manzanillo with one. Notably, Las Baulas wetland did not receive any mentions regarding this ecosystem service. It is essential to highlight that interviewees emphasized these products due to their perceived importance to the local economy. The identified agricultural products are listed in Table 5.
Table 5 Provisioning ecosystem services related to agriculture identified by communal leaders.
| Service | Wetland |
| Beans production | Térraba-Sierpe |
| Palo Verde | |
| Caño Negro | |
| Rice production | Térraba-Sierpe |
| Palo Verde | |
| Caño Negro | |
| Maiz production | Térraba-Sierpe |
| Palo Verde | |
| Oil palm production | Térraba-Sierpe |
| Caribe Noreste | |
| Tuber production | Caño Negro |
| Maquenque | |
| Banana production | Caribe Noreste |
| Gandoca-Manzanillo | |
| Pineapple production | Caribe Noreste |
| Maquenque | |
| Sugar row production | Palo Verde |
| Plantain production | Maquenque |
| Watermelon production | Palo Verde |
| Papaya production | Palo Verde |
| Grasslands1 | Palo Verde |
1. Refers to give services to maintain the grassland for livestock. Source: self-elaborated based on field data.
Livestock farming emerges as a significant economic activity in five out of the seven wetlands, underscoring its importance to the local communities. Notably, Las Baulas and Gandoca-Manzanillo wetlands do not feature prominent livestock farming. Among the wetlands with notable livestock activity, Palo Verde and Caño Negro stand out, where the provision of watering services by the wetlands is particularly valued. Further details can be found in Table 6.
Table 6 Provisioning ecosystem services related to livestock identified by communal leaders.
| Service | Wetland |
| Cattle production | Térraba-Sierpe |
| Palo Verde | |
| Caño Negro | |
| Maquenque | |
| Caribe Noreste | |
| Goat production | Gandoca-Manzanillo |
Source: self-elaborated based on field data.
The category of Cultural ecosystem services ranks second in terms of the number of services identified. These services primarily revolve around tourism, sport fishing, environmental education, and recreational activities. Tourism was reported for all wetlands except Palo Verde. Sport fishing, on the other hand, was noted in the wetlands of Térraba-Sierpe, Caribe Noreste, and Gandoca-Manzanillo. Recreational use, distinct from tourism, was specifically mentioned only in Las Baulas wetland. In this context, recreation encompasses the activities undertaken by the local population within the wetland, while tourism involves visitors from outside the area, be they national or international. For a detailed breakdown of cultural ecosystem services by wetland, please refer to Table 7.
Table 7 Cultural ecosystem services identified by communal leaders.
| Service | Wetland |
| Tourism | Térraba-Sierpe |
| Las Baulas | |
| Caño Negro | |
| Maquenque | |
| Caribe Noreste | |
| Gandoca Manzanillo | |
| Recreation1 | Las Baulas |
| Sport fishing | Térraba-Sierpe |
| Caribe Noreste | |
| Gandoca Manzanillo |
1. Related to recreational use by community members. Source: self-elaborated based on field data.
The ecosystem services related to regulation and support appear to be largely unknown to community leaders. Only in Las Baulas was the wetland’s capacity to mitigate floods (flood reduction) mentioned, while in Gandoca-Manzanillo, the significance of the wetland’s role in providing habitat and shelter to flora and fauna was emphasized.
In summary, Table 8 illustrates the number of ecosystem services identified by communal leaders. It’s important to note that we are not assigning importance to one ecosystem service over another; rather, we are highlighting a clear trend wherein key informants were able to identify a range of benefits from wetlands. The total count of ecosystem services ranges between 7 and 13, with Térraba-Sierpe wetland having the highest count and Las Baulas wetland the lowest. This disparity underscores the variations in the relationships between wetlands and the local population. For instance, in Las Baulas wetland, provisioning services are fewer compared to other wetlands. Across all wetlands, provisioning services are more prominent than cultural services, especially notable in the case of Térraba-Sierpe and Palo Verde.
Table 8 Total ecosystem services found according to communal leaders.
| Wetland | Type | Total | |||
| Provisioning | Cultural | Supporting | Regulating | ||
| Térraba-Sierpe | 11 | 2 | 0 | 0 | 13 |
| Las Baulas | 4 | 2 | 0 | 1 | 7 |
| Caño Negro | 9 | 1 | 0 | 0 | 10 |
| Maquenque | 9 | 1 | 0 | 0 | 10 |
| Caribe Noreste | 8 | 2 | 0 | 0 | 10 |
| Gandoca Manzanillo | 9 | 2 | 1 | 0 | 12 |
| Palo Verde | 11 | 0 | 0 | 0 | 11 |
Source: self-elaborated based on field data.
Additionally, during the interviews, communal leaders were asked about which ecosystem services they believed could be promoted to increase benefits to the local population, as outlined in Table 9. Communal leaders highlighted two types of tourism that could be further developed, which were either not well-established or only in the initial stages at the time of the field research. Hence, the local leaders made two main distinctions. Socially responsible tourism was mentioned in the wetlands of Térraba-Sierpe and Las Baulas, while community-based rural tourism was identified in Palo Verde, Maquenque, and Caribe Noreste. Concerning environmental education, communal leaders expressed interest in this ecosystem service, particularly in the case of Gandoca-Manzanillo and Maquenque wetlands, although their experience with it has been limited. Generally, the provisioning ecosystem services to be improved are related to the promotion of productive projects aimed at reducing human impact on the wetland while simultaneously increasing economic benefits for the local population.
Table 9 Ecosystem services that must be incentivized by authorities: identified by communal leaders.
| Type of service | Service | Wetland |
| Provisioning | Aquaculture | Caño Negro 1 |
| Maquenque 2 | ||
| Organic agriculture | Caño Negro | |
| Palo Verde | ||
| Water consumption | Térraba-Sierpe | |
| Gandoca Manzanillo | ||
| Firewood | Térraba-Sierpe | |
| Gandoca Manzanillo | ||
| Cultural | Social-responsible tourism | Térraba-Sierpe |
| Las Baulas | ||
| Community-based rural tourism | Palo Verde | |
| Maquenque | ||
| Caribe Noreste | ||
| Environmental education | Gandoca Manzanillo | |
| Maquenque |
1. Fishing, including the tropical gar fish. 2. River shrimp. Source: self-elaborated based on field data.
Identification and quantification of main provisioning services: These results primarily focus on services that are consumed or directly collected from the wetland by households. For fish, we utilized Spanish common names along with their respective families. In Appendix 5, a table containing the Spanish common names of fish, their English equivalents, and their families is provided for reference. Table 10 presents the types of products, their common names, and the total quantities reported annually by household heads in the case of the Térraba-Sierpe wetland. Whenever feasible, we included the family names of the products, particularly for fish species.
Table 10 Provisioning ecosystem services: products collected by households in Térraba-Sierpe wetland.
| Type of Product | Product 1 | Total quantity/year |
| Mollusk | Piangua (Arcidae) | 307 440 |
| Fruits | Coconut | 120 |
| Fruits | Mango | 25 |
| Fruits | Unripe coconut (pipa) | 120 |
| Plants | Zorrillo | 120 |
| Shrimp | no id. | 26 |
| Fish | Bagre (Ariidae) | 12 |
| Fish | Corvina (Sciaenidae) | 12 |
| Fish | Macarela (Carangidae) | 12 |
| Fish | Mero (Serranidae) | 48 |
| Fish | Jurel (Carangidae) | 84 |
| Fish | Lisa (Mugilidae) | 90 |
| Fish | Pargo negro (Lutjanidae) | 90 |
| Fish | Pargo rojo (Lutjanidae) | 90 |
| Fish | no id. | 240 |
| Fish | Roncador (Haemulidae) | 300 |
| Fish | Robalo Gualaje (Centropomidae) | 540 |
| Fish | Cuminate (Ariidae) | 612 |
| Fish | Pargo (Lutjanidae) | 1 994 |
| Fish | Gualaje (Centropomidae) | 2 562 |
| Mollusk | Oyster (Osteridae) | 24 |
| Total | 314 561 |
1. For the case of fish, we use common local names, with their respective family names provided in parentheses, based on Bussing & Lopez (2011), Angulo et al. (2021), and MarViva (2015). It is important to note that this information is solely based on the responses from the respondents, and no biological field work was conducted to verify or confirm any scientific names.Source: Self-elaborated based on field data.
The results reveal that in the Térraba-Sierpe wetland, Pianguas are the most extracted product, totaling 307 440 units. However, fish exhibit a wide variety of families being captured. Among these, the families Lutjanidae and Centropomidae stand out, with the highest number of individuals captured, with 2 174 and 2 562 units respectively.
Table 11 provides information on the collected products for Maquenque wetland. In contrast to Térraba-Sierpe wetland, the range of products in Maquenque wetland is less diverse. The primary product reported is fish, particularly freshwater fish, with Guapote (Cichlidae), Barbudo (Pimelodidae), Machaca (Bryconidae), and Mojarra (Cichlidae) being the most commonly caught species.
Table 11 Provisioning ecosystem services: products collected by households in Maquenque wetland.
| Type of Product | Product 1 | Total quantity/year |
| Fresh water shrimp | no id | 12 |
| Fish | Robalo (Centropomidae) | 24 |
| Fish | no id. | 39 |
| Fish | Sabalo (Megalopidae) | 96 |
| Fish | Tilapia (Cichlidae) | 96 |
| Fish | Roncador (Haemulidae) | 120 |
| Fish | Guabina (Eleotridae) | 684 |
| Fish | Bagre (Heptapteridae) | 720 |
| Fish | Guapote (Cichlidae) | 2 424 |
| Fish | Barbudo (Pimelodidae) | 2 586 |
| Fish | Machaca (Bryconidae) | 2 676 |
| Fish | Mojarra (Cichlidae) | 5 622 |
| Total | 15 099 |
1. For the case of fish, we utilize common local names, with their respective family names provided in parentheses, based on Ángulo (2013), Ángulo et al. (2021), Instituto Costarricense de Electricidad (2007), and CRAFF (2023). It is important to note that this information is solely based on the responses from the respondents, and no biological field work was conducted to verify or confirm any scientific names. Source: Self-elaborated based on field data.
Table 12 presents the products collected by households in the Gandoca-Manzanillo wetland. The primary product collected in this wetland is fish, predominantly comprising sea fish families. Among these, Jurel (Carangidae) stands out as the most important.
Table 12 Provisioning ecosystem services: products collected by households in Gandoca-Manzanillo wetland.
| Type Of Product | Product 1 | Total Quantity/Year |
| Mollusk | Cambute (Strombidae) | 48 |
| Fruits | Coconut | 12 |
| Crustacean | Shrimp | 12 |
| Crustacean | Lobster | 36 |
| Fish | Pargo Rojo (Lutjanidae) | 12 |
| Fish | Sabalo (Megalopidae) | 12 |
| Fish | Tilapia (Cichlidae) | 48 |
| Fish | Roncador (Haemulidae) | 72 |
| Fish | Robalo (Centropomidae) | 84 |
| Fish | Bobo (Mugilidae) | 96 |
| Fish | Macarela (Carngidae) | 204 |
| Fish | Pargo (Lutjanidae) | 384 |
| Fish | Jurel (Carangidae) | 9 072 |
| Total | 10 092 |
1. For the case of fish, we utilize common local names, with their respective family names provided in parentheses, based on Ángulo (2013) and Ángulo et al. (2021), as we rely solely on the information provided by the respondents, and no biological field work was conducted to verify any possible scientific names. Source: Self-elaborated based on field data.
Table 13 displays the products collected by households in the Caribe Noreste wetland. This wetland offers a wide variety of products, including mollusks, crustaceans, and fish. However, fish have the highest recorded quantity. Among the fish families, Robalo (Centropomidae), Jurel (Carangidae), Pargo (Lutjanidae), And Mojarra (Cichlidae) are the most captured.
Table 13 Provisioning ecosystem services: products collected by households in Caribe Noreste wetland.
| Type of Product | Product 1 | Total quantity/year |
| Mollusk | Clams (no id) | 200 |
| Crustacean | Jaiba (Potunidae) | 240 |
| Mollusk | Cambute (Strombidae) | 12 |
| Fruits | Noni | 120 |
| Fruits | Uva de playa (Sea Grape) | 1 |
| Crustacean | Freshwater Shrimp | 12 |
| Crustacean | Shrimp | 372 |
| Fish | Tiburon Bolillo (Subclasss: Elasmobranchii) | 12 |
| Fish | Mero (Serranidae) | 12 |
| Fish | Pargo rojo (Lutjanidae) | 12 |
| Fish | Macarela (Carngidae) | 24 |
| Fish | Cara Seca-gualaje (Centropomidae) | 26 |
| Fish | Calva (Centropomidae) | 100 |
| Fish | Pampano (Carangidae) | 144 |
| Fish | Corvina (Sciaenidae) | 156 |
| Fish | no id. | 388 |
| Fish | Sabalo (Megalopidae) | 216 |
| Fish | Dorado (Coryphaenidae) | 348 |
| Fish | Guapote (Cichlidae) | 576 |
| Fish | Roncador (Haemulidae) | 582 |
| Fish | Robalo (Centropomidae) | 1 272 |
| Fish | Jurel (Carangidae) | 1 362 |
| Fish | Pargo (Lutjanidae) | 1 418 |
| Fish | Mojarra (Cichlidae) | 1 518 |
| Total | 9 222 |
1. For the case of fish, we employ common local names, accompanied by their respective family names in parentheses, as referenced from Ángulo (2013), Ángulo et al. (2021), and MarViva (2015), given that we solely rely on the information provided by the respondents, and no biological field work was conducted to verify any possible scientific names. In the case of Tiburon Bolillo, it may refer to at least 24 species of shark that are sold under the term “bolillo” in Costa Rica (MarViva, 2012). Source: Self-elaborated based on field data.
Table 14 presents the products collected by households in the Caño Negro wetland. Fish is the primary provisioning service in this wetland, particularly freshwater fish such as Mojarra (Cichlidae) and Guapote (Cichlidae). These two account for 77 % of the total reported products collected.
Table 14 Provisioning ecosystem services: products collected by households in Caño Negro wetland.
| Type of Product | Product 1 | Total quantity/year |
| Fruits | Oranges | 120 |
| Wood | no id. | 30 |
| Crustacean | Freshwater shrimp | 666 |
| Fish | Roncador (Haemulidae) | 1 |
| Fish | Machaca (Bryconidae) | 13 |
| Fish | Guapote lagunero (Cichlidae) | 72 |
| Fish | Barbudo (Pimelodidae) | 90 |
| Fish | No Id. | 96 |
| Fish | Sabalo (Megalopidae) | 96 |
| Fish | Tilapia (Cichlidae) | 96 |
| Fish | Guabina (Eleotridae) | 288 |
| Fish | Gaspar (Lepisosteidae) | 370 |
| Fish | Guapote pinto (Cichlidae) | 888 |
| Fish | Mojarra (Cichlidae) | 1 708 |
| Fish | Guapote (Cichlidae) | 7 972 |
| Total | 12 506 |
1. For the case of fish, we employ common local names, with their respective family names in parentheses, based on Ángulo (2013) and Ángulo et al. (2021), as we solely rely on information provided by the respondents, and no biological fieldwork was conducted to confirm any possible scientific names. Source: Self-elaborated based on field data.
Table 15 presents the products collected by households in the Las Baulas wetland. Fish is the main provisioning service reported by households in this wetland, particularly Pargo (Lutjanidae) and Jurel (Carangidae). These two species represent 80 % of the total units collected.
Table 15 Provisioning ecosystem services: products collected by households in Las Baulas wetland.
| Type of Product | Product 1 | Total quantity/year |
| Fruits | Coco | 720 |
| Fruits | Pipas | 24 |
| Crustacean | Freshwater shrimp | 12 |
| Mollusk | Piangua (no id) | 144 |
| Fish | Dorado (Coryphaenidae) | 12 |
| Fish | Robalo (Centropomidae) | 36 |
| Fish | no id. | 204 |
| Fish | Pargo (Lutjanidae) | 5 208 |
| Fish | Jurel (Carangidae) | 25 824 |
| Total | 32 184 |
1. For the case of fish, we utilize common local names, with their respective family names in parentheses, sourced from Ángulo (2013), Ángulo et al. (2021), and MarViva (2015). Since we solely rely on information from the respondents, and no biological fieldwork was conducted to confirm any possible scientific names. Source: Self-elaborated based on field data.
Table 16 illustrates the products collected by households in Palo Verde wetland. While wild birds are important, with 328 units registered by households, fish remains the primary source of products. Most of the fish are caught in agricultural irrigation channels and rivers. Tilapia (Cichlidae) is the most commonly caught, with 1 162 units, representing 33.7 % of the total product units.
Table 16 Provisioning ecosystem services: products collected by households in Palo Verde wetland.
| Type of Product | Product 1 | Total quantity/year |
| Wild birds | Zarceta (Anatidae) | 72 |
| Wild birds | Piche (Anatidae) | 256 |
| Fruits | no id. | 300 |
| Crustacean | Shrimp | 111 |
| Fish | Robalo (Centropomidae) | 12 |
| Fish | Carpa (Cyprinidae) | 24 |
| Fish | Colossoma-Tambaqui (Serrasalmidae) | 24 |
| Fish | Cuminate (Ariidae) | 68 |
| Fish | Guapote (Cichlidae) | 408 |
| Fish | Bagre (Heptapteridae) | 413 |
| Fish | no id. | 485 |
| Fish | Tilapia (Cichlidae) | 1 162 |
| Total | 3 450 |
1. For the case of fish, we utilize common local names, with their respective family names in parentheses, based on Ángulo (2013), Ángulo et al. (2021), and van Anrooy et al. (1996). Since we solely rely on information from the respondents, and no biological fieldwork was conducted to ensure any possible scientific names. Source: Self-elaborated based on field data.
Table 17 provides a summary of the total number of units collected by product type and by wetland. Of the total products collected, 21.5 % are fish and 77. 5% are mollusks. However, these numbers are skewed by the significant number of Pianguas collected in the Térraba-Sierpe wetland. Excluding Térraba-Sierpe, fish captures represent between 78 % and 99 % of all products across the other wetlands. The dominance of fish collection is evident, with percentages ranging from 99 % in Maquenque to 77.8 % in Palo Verde.
Table 17 Total number of products collected by households.
| Wetland | Fish | Mollusk | Crustacean | Plants | Wild birds | Fruits | Wood | Total |
| Térraba-Sierpe | 6 686 | 307 464 | 26 | 120 | 0 | 265 | 0 | 314 561 |
| Maquenque | 15 087 | 0 | 12 | 0 | 0 | 0 | 0 | 15 099 |
| Gandoca-Manzanillo | 9 984 | 48 | 48 | 0 | 0 | 12 | 0 | 10 092 |
| Caribe Noreste | 8 166 | 212 | 624 | 0 | 0 | 220 | 0 | 9 222 |
| Las Baulas | 31 284 | 144 | 12 | 0 | 0 | 744 | 0 | 32 184 |
| Palo Verde | 2 596 | 0 | 111 | 0 | 328 | 300 | 0 | 3 335 |
| Caño Negro | 11 690 | 0 | 666 | 0 | 0 | 120 | 30 | 12 506 |
| Total | 85 493 | 307 868 | 1 499 | 120 | 328 | 1 661 | 30 | 396 999 |
Source: self-elaborated based on field data.
Table 18 shows a summary of some important species in the wetlands that match the field data and the literature. Although the common names are the same of our documented fish, without formal identification research, we cannot ensure that they are the same species. Therefore, we stay at the fish family identification level.
Table 18 Fish families important for the Ramsar wetlands.
| Caribe Noreste | Gandoca Manzanillo | Caño Negro | Maquenque | |
| Important fish families for provisioning services** | Cichlidae* Characidae Pimelodidae Carcharinidae Centroponidae* Lutjanidae* | Lutjanidae* Serranidae Centropomidae* Carangidae* | Lepisosteidae* Megalopidae Centropomidae Cichlidae* | Poeciliidae Characidae* Cichlidae* Lepisosteidae |
| Species of particular economic interest | -Centropomus pardelles (Robalo) -Megalops atlanticus (Sábalo) -Atractosteus tropicus (Gaspar fish) | -Atractosteus tropicus (Gaspar fish) -Megalops sp. (Sábalo real) -Centropomus sp. (Róbalo) -Parachromis sp. (Guapote) | -Atractosteus tropicus (Gaspar fish) -Ciclasoma doviiy (Guapote) -Ciclasoma loisellei -Ciclasoma managuense (Guapote tigre) -Ciclasoma nicaragüense (La vieja) |
* Families also identified by our study in the respective wetland. ** No fish families or species were detailed in Térraba-Sierpe, Las Baulas and Palo Verde wetlands. Source: Proyecto Humedales SINAC-PNUD-GEF (2017).
Finally, Fig. 6 depicts a map of the Ramsar wetlands, with the area colored according to the total number of units of all collected products. Térraba-Sierpe stands out as the wetland with the highest quantity, followed by Las Baulas, Caño Negro, and Maquenque in the second category. Caribe Noreste and Gandoca-Manzanillo wetlands fall into the third category, while Palo Verde has the least number of products in the last category.
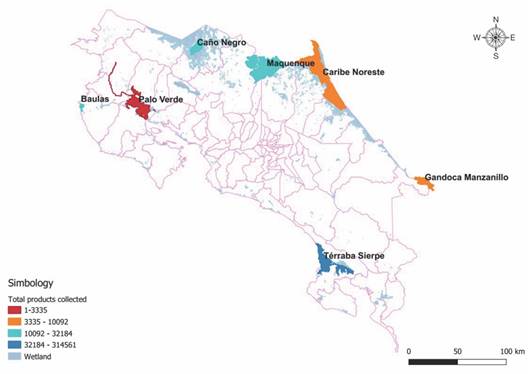
Fig. 6 Total units of products collected by households in the studied wetlands. Source: self-elaborated based on field data.
Socio-ecological network of the provisioning services: Fig. 7 illustrates the network representation of the products collected by households in the research communities, the number in the lines refers to the number of units collected. In the center of the network, we observe the products common to many wetlands. For instance, fish such as pargo (Lutjanidae), macarella (Carangidae), jurel (Carangidae), robalo (Centropomidae), and roncador (Haemulidae) are located in the denser area of the network. Other products like shrimp and coconut also hold relevance for households across different wetlands. Conversely, some products are exclusively associated with specific wetlands, evident in the periphery of the network. For example, we find wild birds in Palo Verde, jaibas in Caribe-Noreste, wood and gaspar fish in Caño Negro, and lobster in Gandoca-Manzanillo. The dominant tie is observed in the case of piangua collection in the Térraba-Sierpe wetland.
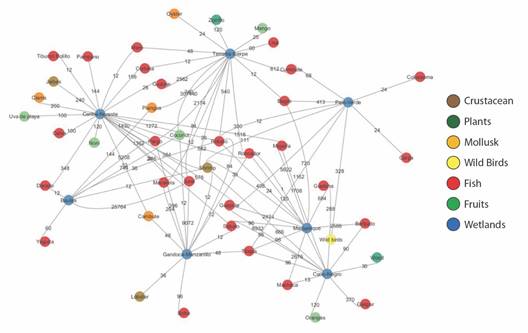
Fig. 7 Socio-ecological network representation of products collected by households in Ramsar wetlands. Source: self-elaborated based on field data.
To estimate the most central products in the network, centrality statistics are employed. Fig. 8 illustrates the network where the size of the nodes represents the authority score value. Among the top ten products, eight are fish types, and one is a crustacean, listed in descending order: shrimps (authority -score = 1), robalo (Centropomidae, authority -score = 0.88), roncador (Haemulidae, authority -score = 0.81), pargo (Lutjanidae, authority -score = 0.66), jurel (Carangidae, authority -score = 0.65), sabalo (Megalopidae, authority -score = 0.63), guapote (Cichlidae, authority -score = 0.56), macarella (Carangidae, authority -score = 0.55), tilapia (Cichlidae, authority -score = 0.50), mojarra (Cichlidae, authority -score = 0.48), and coconut (authority -score = 0.43). The likelihood of being ranked highly is influenced not only by the quantity collected by households but also by the number of wetlands where the product is recorded.
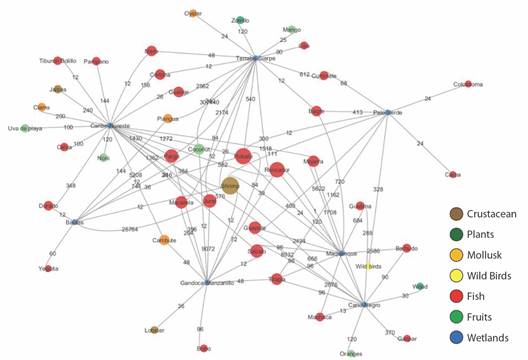
Fig. 8 Network authority score of products collected by households in Ramsar wetlands. Source: self-elaborated based on field data.
The network hub score indicates the wetlands where households collect a more diverse and larger quantity of products, as depicted in Fig. 9. The highest value is attributed to Caribe Noreste (hub -score = 1), followed by Térraba-Sierpe (hub -score = 0.81), and Gandoca Manzanillo (hub-score = 0.70), with Maquenque (hub -score = 0.62), and Caño Negro (hub -score = 0.52) out the top five wetlands. Las Baulas (hub -score = 0.45) and Palo Verde (hub -score = 0.40) wetlands occupy the last two places in the ranking.
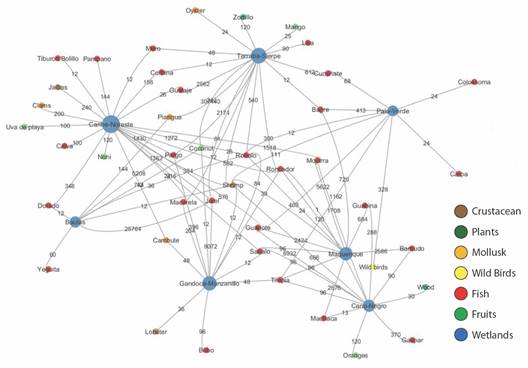
Fig. 9 Network hub score of products collected by households in Ramsar wetlands. Source: self-elaborated based on field data.
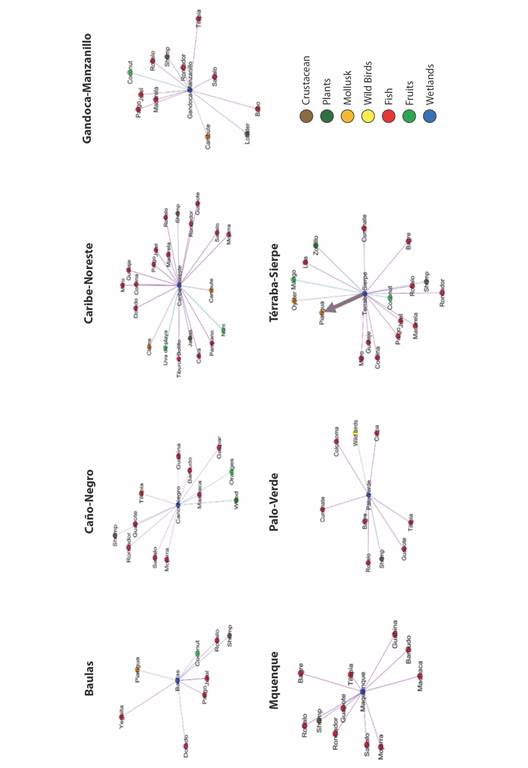
From the presented network, we can extract the respective Ego-network for each wetland, as depicted in Fig. 10. Visually, the Ego-networks of Caribe Noreste and Térraba-Sierpe confirm that these wetlands are those where households collect a more diverse number of products. Meanwhile, Palo Verde and Las Baulas are where households collect the least.
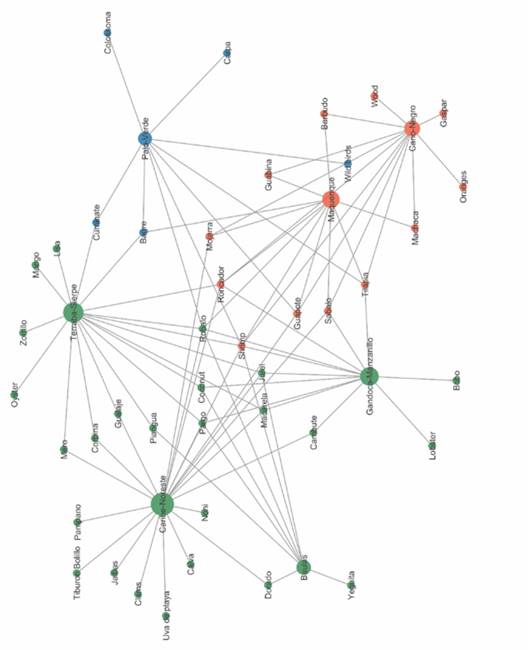
Finally, Fig. 11 illustrates the network clusters identified in the analysis. Three clusters were found: the first cluster (green) includes four wetlands-Gandoca-Manzanillo, Térraba-Sierpe, Baulas, and Caribe-Noreste. The second cluster (orange) groups Caño Negro and Maquenque, while the third cluster consists solely of the Palo Verde wetland. The type of products and fish families shared among the wetlands within each cluster determined their membership.
Discussion
Costa Rica’s wetlands ecosystem services: Parting from the literature review, regulating ecosystem services are found to be the most prevalent in Ramsar wetlands in Costa Rica, followed by supporting and cultural services. Provisioning services, on the other hand, are identified as the least prominent. However, our findings suggest a different perspective when considering the local population, as provisioning services emerge as the most identified. This result aligns with the notion that supporting and regulating services are often less perceptible, as emphasized by De Groot et al. (2006).
This discrepancy is significant, considering that local communities directly experience and benefit from wetland ecosystems on a daily basis. Similar results were reported by Gouwakinnou et al. (2019), who found that provisioning services are predominantly recognized by villages, particularly those with low socioeconomic conditions. In contrast, supporting services were generally unknown to the local communities. These findings suggest that socioeconomic conditions play a significant role in shaping the identification and perception of different types of ecosystem services. Examples of factors that influence local population perceptions of ecosystem services include educational level, poverty, and proximity of the community to the ecosystem (Gouwakinnou et al., 2019). Further research on this issue in Costa Rica will contribute to and enhance the discussion on wetland sustainable management.
This underscores the importance of involving local populations in any policy or management efforts aimed at ensuring the sustainable use of wetlands, as advocated by the Ramsar Convention (Ramsar Convention Secretariat, 2010). In this context, our work provides valuable insights and information to support this crucial task. This idea is supported by Evangelista et al. (2024), who explore how Local Ecological Knowledge (LEK) and perceptions of ecosystem services are shaped by socio-ecological variables. For example, participation in conservation and restoration initiatives significantly influences the LEK levels of local populations (Evangelista et al., 2024). Therefore, understanding the ecosystem services most relevant to communities is essential for designing and implementing effective initiatives to maintain and ensure the flow and accessibility of ecosystem services.
Overall, there exists a notable gap in empirical research on the analysis of ecosystem services. Among all the Ramsar wetlands in Costa Rica, the literature on the Térraba-Sierpe wetland contains the most comprehensive information about ecosystem services. Conversely, wetlands such as Las Baulas and Caño Negro have fewer ecosystem services identified in the literature.
Social actors and wetland ecosystem services: The results of the social mapping reveal that Palo Verde wetland, Caribe Noreste, and Gandoca Manzanillo exhibit the highest number of social actors in their ego-networks. While public actors predominate, communal actors are also represented by several entities. This is significant because wetlands with greater connectivity to diverse social actors, including communal, public, or individual entities, are expected to foster greater social cooperation and control over wetland uses. In this regard, Bodin et al. (2011) emphasize that involving all relevant social actors in the planning of wetlands is fundamental for achieving robust and sustainable management.
Therefore, collaboration among national entities, local governments, non-governmental organizations, and the local population is crucial for resolving conflicts that may arise over the use of wetland natural resources. However, achieving this collaboration requires a mutual understanding and trust among the actors involved (Bodin et al., 2011). Thus, merely having more actors in the network does not necessarily imply greater cooperation. However, an existing network may hold a comparative advantage over wetlands that lack a social network structure for their management, as the latter would need to build such a network from scratch. In our case, this advantage arises because the social actor network is founded on prior positive experiences of cooperation and problem-solving in management. Consequently, there is already a foundation of trust and shared experience to build upon, as Bodin et al. (2011) and Kininmonth et al. (2015) suggest in the context of integrating social actors into wetland management.
Thus, based on past wetland management experiences reflected in the social actor network, Maquenque and Térraba-Sierpe wetlands have fewer social actors in their networks, with communal groups mentioned only once. Consequently, these wetlands may encounter greater management challenges when integrating communal groups into planned actions.
For future wetland management considerations, it is essential to acknowledge that each situation and management problem must be evaluated individually for each wetland. This is because private and public interests do not always align, and each scenario may require a tailored approach, as noted by Cárcamo et al. (2014) in the case of artisanal and industrial fishers. Clare et al. (2013) highlights that public policy decisions often create winners and losers in the use of natural resources, thereby intensifying management tensions.
It is crucial to acknowledge the diverse ways in which local communities interact with wetlands, with each wetland exhibiting varying intensities of these interactions. For example, Las Baulas offers significant cultural ecosystem services compared to Maquenque. However, Maquenque provides more provisioning services than Las Baulas. The local socio-economic dynamics influence the demand for products and services from the wetland by households. According to communal leaders, in Palo Verde, there are minimal benefits to the communities from tourism. Nevertheless, studies by Proyecto Humedales SINAC-PNUD-GEF (2017) and Moreno et al. (2010) have identified recreational and educational benefits from the wetland.
Moreno et al. (2010) conducted a study that identified cultural ecosystem services such as tourism and scientific research from Palo Verde. Local perceived benefits reported by communal leaders did not match those reported by Moreno et al. (2010). This difference may stem from Moreno et al. (2010) including a broader range of localities, overlapping only with one of the communities studied. Our findings also reveal that Palo Verde has the highest number of social actors involved in its network.
Conversely, local leaders in Las Baulas wetland recognize that communities benefit from tourism. This finding aligns with the conclusions of Reyes et al. (2013) and Proyecto Humedales SINAC-PNUD-GEF (2017). The recognition of their use of wetland resources influences the way local populations interact with the ecosystem and may affect their willingness to protect the natural resources of the wetland. For instance, Reyes et al. (2013) identified and valued ecosystem services associated with Las Baulas wetland, with cultural ecosystem services such as lodging, food, transportation, and tour operation being prominent. Despite the involvement of numerous actors in utilizing wetland benefits in Las Baulas, our findings indicate that only nine actors are involved in the wetland’s network.
Communal leaders’ interviews reveal that for wetlands Caribe Noreste and Gandoca Manzanillo, small-scale fishing and tourism are the main ecosystem services. Proyecto Humedales SINAC-PNUD-GEF (2017) supports these findings and underlines that food and water provisioning are central services in both wetlands, while genetic material is also an important provisioning service in Caribe Noreste wetland (Proyecto Humedales SINAC-PNUD-GEF, 2017). We found that Caribe Noreste and Gandoca Manzanillo are two of the wetlands with more involved social actors with 20 (Proyecto Humedales SINAC-PNUD-GEF, 2017). Therefore, potential benefits such as educational uses, identified by Proyecto Humedales SINAC-PNUD-GEF (2017) of the wetland, can be enhanced in both cases.
In a similar case, in Caño Negro wetland, small-scale fishing and tourism are the main ecosystem services underlined by communal leaders. Proyecto Humedales SINAC-PNUD-GEF (2017) identified food and water provisioning, spiritual, recreational, aesthetic, and educational services as central ecosystem services. Nonetheless, there are only 11 social actors identified on the wetland network; a low value compared to Caribe Noreste wetland (Proyecto Humedales SINAC-PNUD-GEF, 2017). In Maquenque wetland, communal leaders also underline the presence of tourism, however, it was not strongly perceived as an important activity as it was for the leaders of Caño Negro. In this wetland, fishing is also an important activity, especially for household consumption. Proyecto Humedales SINAC-PNUD-GEF (2017) also found that food and water provisioning is a central ecosystem service. This author also identified recreational, aesthetic, and educational services as with high potential in the wetland.
Térraba-Sierpe is the wetland with more research done, the main identified ecosystem services in the literature are flood protection, natural protection against droughts, nutrient cycling, biodiversity, spiritual inspiration, providing “piangua”, shrimp extraction, fishing, water for agriculture and tourism, capture and fixation of carbon (Barton, 1995; BIOMARCC-SINAC-GIZ, 2012; Kocian et al., 2010; Proyecto Humedales SINAC-PNUD-GEF, 2017; Reyes et al., 2004; Sanchez et al., 2013) As the authors mention, most of these services are non-exclusive public goods, benefiting everyone. Our results indicate that communal leaders mention a wide range of ecosystem services, where provisioning services such as “piangua” extraction and small-scale fishing dominate, besides cultural services such as tourism. Other authors such as Barton (1995), Kocian et al. (2010), Reyes et al. (2004) and Sanchez et al. (2013) also found that piangua extraction was one of the main provisioning services in Térraba-Sierpe wetland.
In general, Térraba-Sierpe wetland has a great variety of ecosystem services that create an economic value. However, our results show that it is one of the wetlands with the lowest number of social actors involved on its network (9 actors). Thereby, the documented high socioeconomic dynamic of the wetland demands a high contact with social actors; thus, wetland authorities confront a challenge ensuring sustainability.
Communal leaders mentioned the challenge for the local communities to use wetland natural resources without endangering the sustainability of ecosystem services. To enhance the coexistence between communities and the wetland ecosystem, these key informants propose the necessity to develop sustainable productive projects with the participation of different social actors. For instance, tourism was not mentioned as an ecosystem service in Palo Verde, although indeed there is tourism attending to the wetland, locals do not feel that tourism gives any benefit to the local communities. Meanwhile, activities such as aquaculture, organic, and ecological production are proposed for Palo Verde and Caño Negro communal leaders. Taking advantage of legally framed resources for consumption such as water and firewood also seems important to communities. Environmental education would be a service desired in wetlands such as Gandoca-Manzanillo and Maquenque.
In the case of Gandoca Manzanillo wetland, early research of Alvarado (2008) concluded that, at the interaction level, activities such as organic farming, conservation incentives, low-impact tourism, agriculture, livestock, and fishing can provide social and technical solutions to negative interactions between the environment and society. These practices could be crucial and should be encouraged in the area. However, we aggregate to the last that to encourage these activities diverse social actors must be included in the initiatives.
Therefore, identified potential uses such as communal rural tourism, other uses such as fishing and traditional tourism require greater involvement from the Costa Rican Tourism Institute (ICT) and the Ministry of Environment and Energy (MINAE) to regulate and enhance these activities in wetlands. Based on the wetlands’ social actors network, ICT only has three mentions. Greater contact with wetlands is required by the Ministry of Agriculture and Livestock (MAG), for example, to enhance the use of forages from invasive species in wetlands and by the Ministry of Public Education (MEP) to implement environmental education programs in communities geographically coexisting with wetlands. So far, MAG only has five mentions, and MEP has five mentions in the network. Much is still to be enhanced in terms of incorporating social actors to cooperative work to improve wetland relations with social actors.
Furthermore, Municipalities and the Ministry of Public Security (MPS) are the actors with the highest number of contacts in the network (high indegree centrality), followed by public universities. This highlights positive relations in terms of controlling illegal activities within the wetland, developing academic research in the wetlands, and connecting the ecosystem to local productive activities. These ongoing connections should be further enhanced. Municipalities are the local governments managing the local territory; thus, they play a central role in developing sustainable relations between the local population and the wetland ecosystems. Collaboration among social actors in wetland management is crucial, especially considering the budget reductions faced by SINAC-MINAE (Programa Estado de la Nación, 2023). Therefore, incorporating local communities is essential as they are the direct beneficiaries of ecosystem services due to their geographical proximity.
As mentioned, our results position the local government in a central role within the wetlands network. This indicates that positive relationships between wetlands and their management are crucial for problem-solving and cooperation. Another network-based approach, applied by Kininmonth et al. (2015), focused on the role of municipalities in the governance and local management of wetlands. Their findings suggest that higher interconnections between local governments are desirable for effective cooperation in wetland management. This is because limited resources and in-house expertise often necessitate collaboration among neighboring municipalities to achieve goals and improve operational efficiency (Kininmonth et al., 2015). However, wetland management in Costa Rica is centralized under SINAC. Therefore, further studies should analyze the relationships between this institution and municipalities, as well as among local governments, in managing Ramsar wetlands from a broader geographical perspective.
Cárcamo et al. (2014) also utilized social actors to identify ecosystem services. They found differences in the prioritizations of different stakeholder groups, particularly between other actors and fishermen. These differences stem from components related to their activities and livelihoods. This example underscores the challenges of cooperative work between network actors. In the case presented by Cárcamo et al. (2014), private interests such as industrial and illegal fishing are perceived as high threats, while artisanal fishing is seen as a low threat. Hence, we concur with Cárcamo et al. (2014) that achieving common goals and agreements among stakeholders is crucial to improve decision-making and wetland management. Their opinions and perceptions must be incorporated into a science-policy framework. Thus, securing the sustainability of wetlands and maintaining ecosystem services requires the involvement of all stakeholders in the development and implementation of a management planning process (Ramsar Convention Secretariat, 2010).
Differences in wetlands’ provisioning services: Communal leaders identified 14 provisioning services associated with the extraction and use of timber and non-timber products from wetlands, one service related to transport, 12 services benefiting agricultural production, and two related to animal production. Only three cultural services were reported by communal leaders. Therefore, the collection of products from the wetlands, pertaining to provisioning services, is the most evident for the informants. The diversity of these products was quantified using the survey. This technique allows us to delve into the differences in products and the demand for wetland products among households.
Fish is the main product collected by households from the wetlands. There are differences between wetlands that do not have a coast and those that are coastal wetlands. It is important to mention that most studies identifying fishing as a relevant ecosystem service did not provide detailed information about the fish types, families, or species collected within the wetland. The only study that reported families and some species of particular interest is Proyecto Humedales SINAC-PNUD-GEF (2017). Table 18 shows the fish families reported by Proyecto Humedales SINAC-PNUD-GEF (2017), with the underlined fish families also registered in the applied survey. We concur with Proyecto Humedales SINAC-PNUD-GEF (2017) on these families:
Caribe Noreste: Cichlidae, Centropomidae, and Lutjanidae.
Gandoca Manzanillo: Lutjanidae, Centropomidae, Carangidae.
Caño Negro: Lepisosteidae, Cichlidae.
Maquenque: Characidae, Cichlidae.
Our results show that in coastal wetlands, most of the fish families are sea fish, while in wetlands without a coast, the main fish families captured are freshwater fishes. Here are the wetlands and the main fish families captured by households, with the quantity in units.
Térraba-Sierpe: Pargo (Lutjanidae, 1 994), Gualaje (Centropomidae, 2 562).
Gandoca Manzanillo: Pargo (Lutjanidae, 384), Jurel (Carangidae, 9 072).
Caribe Noreste: Robalo (Centropomidae, 1 272), Jurel (Carangidae, 1 362), Pargo (Lutjanidae, 1 418), Mojarra (Cichlidae, 1 518).
Las Baulas: Pargo (Lutjanidae, 5 208), Jurel (Carangidae, 25 824).
Palo Verde: Tilapia (Cichlidae, 1 162).
Caño Negro: Mojarra (Cichlidae, 1 708), Guapote (Cichlidae, 7 972).
Maquenque: Guapote (Cichlidae, 2 424), Barbudo (Pimelodidae, 2 586), Machaca (Bryconidae, 2 676), Mojarra (Cichlidae, 5 622).
The wetland where one fish family stands out over all the wetlands is the case of Jurel (Carangidae, 25 764) in Las Baulas. The higher demand for fish in this wetland was somewhat expected since Las Baulas resides in a region where tourism and economic development have increased in the last decade (Programa Estado de la Nación, 2017). Therefore, there must be an increase in the wetland products demanded by the households.
Most of the households reported that they fish for self-consumption and to pursue additional income. However, the case of freshwater fish was mentioned to have fewer market possibilities than sea fish. The case of Palo Verde is also a special case because due to the existence of open irrigation channels for agriculture, these have become habitat for local and exotic species brought by the people, for example, the case of tilapia (Cichlidae, 1 162). The case of piangua (Mollusk, 307 464) is a special case in Térraba-Sierpe wetland, where its extraction is the most important provisioning service identified and quantified.
In general, the socio-ecological network authority score shows that shrimps (crustacean), robalo (Centropomidae), roncador (Haemulidae), pargo (Lutjanidae), and jurel (Carangidae) are those products that are most central in the network, determined not only by the quantity of those but also by the number of wetlands where they are simultaneously demanded. The three wetlands that provide more and more diverse products are Caribe-Noreste, Térraba-Sierpe, and Gandoca Manzanillo. Although, as mentioned, fish is the most dominant product, each wetland has specific products demanded by local households, these products are found on the periphery of the network. For instance, wild birds in Palo Verde, lobster (crustacean) in Gandoca Manzanillo, Gaspar fish in Caño Negro, and jaibas (crustacean) in Caribe Noreste.
The results of the network cluster analysis provide valuable insights for integrating management criteria across different wetlands. The interconnection patterns reflected in the network can serve as a structural framework to understand household demands and their similar relationships betweenn wetlands. The seven wetlands are grouped into three network subclusters. The first cluster includes Caribe Noreste, Las Baulas, Gandoca Manzanillo, and Térraba Sierpe. These four wetlands belong to the same cluster as they share several products demanded by the households, such as jurel (Carangidae) and pargo (Lutjanidae). From a sustainable management perspective, it can be inferred that certain management criteria applicable to these products could be similarly applied to these wetlands.
The second cluster consists of the Maquenque and Caño Negro wetlands. Both are freshwater ecosystems located in the northern region of the country, and their products are comparable-freshwater fish families dominate the products demanded by households. This similarity suggests that their management could integrate similar criteria.
Lastly, Palo Verde exhibits distinct conditions and products compared to the other wetlands. As a result, it occupies a unique cluster within the network and warrants a management approach tailored to its specific characteristics.
Since fisheries are so important for the local communities, it is recommended to integrate and motivate local fishers into wetland governance. For instance, identification of central leaders in this activity is a strategy for improving fisheries management (Ramírez-Sánchez, 2011), a statement aligned with our research results, since it highlights how communal leaders emphasize their relationships with fisheries.
Integrating social actors such as fishers will have a higher impact since they are socially and emotionally engaged rather than following institutions as-rules (Ramírez-Sánchez, 2011). Moreover, it must be considered the differences in fish species and levels of engagement of local leaders and communities. Therefore, different wetlands may pursue different strategies for effective management (Marambanyika & Beckedahl, 2017). We concur with Marambanyika & Beckedahl (2017) and propose that the results of the network cluster analysis can be utilized to develop integrated management criteria. Thus, strategies may operate at different levels: those tailored to the unique characteristics of each wetland, and those addressing comparable conditions among wetlands within the same network cluster.
Finally, in the case of fisheries, it is recommended to follow an adaptive management approach (Sandström, 2011). In this type of management, social actors continuously consider information on the fisheries conditions and movements. Therefore, management rules must be constantly revised based on ecological knowledge (Sandström, 2011). However, in the case of Costa Rica, this last point could be a difficult task since fisheries conditions and health are not continuously monitored.
Wetland management tensions: If we integrate the results of the social actors’ network and the results of the provisioning services socio-ecological network, we have two main dimensions of wetland management. First, collaboration with social actors is key to addressing tensions with local communities. Second, attending to the demand in terms of quantity and diversity of products that households have from the wetlands is crucial to ensuring sustainability, not only for the ecosystem but also for the local socio-economy of the population. Therefore, the first dimension is captured by the network outdegree centrality of the social actors’ network. The second dimension is reflected by the provisioning services socio-ecological network hub-score.
Table 19 presents the recategorization of the mentioned variables and estimates a total value based on the combination of both. The conceptual value behind the first point is that the higher the network hub score, the higher the pressure on the natural resources of the wetland. Therefore, much care should be taken by the authorities at the moment to coordinate and control human activities. Meanwhile, the number of social actors reveals the social tools that the wetland authorities may have to cooperate and create alliances to solve problems. Hence, the higher the number of actors positively linked to the wetland, the higher the possibilities to achieve agreements and solutions by integrating the opinions of actors.
Table 19 Identification of wetland management tensions.
| Térraba-Sierpe | Caribe-Noreste | Gandoca Manzanillo | Maquenque | Caño Negro | Las Baulas | Palo Verde | |
| Household demand from the wetland-Network hub score1 | Middle High | High | Middle High | Middle High | Middle Low | Middle Low | Low |
| Social actors interrelated with the wetland-Network outdegree2 | Low | Middle High | Middle High | Low | Middle Low | Low | High |
| Total value3 | 7 | 6 | 5 | 7 | 5 | 6 | 2 |
1. Network hub score from the socio-ecological network: Low = 1 (1-0.81), Middle-Low = 2 (0.82-0.53), Middle-High = 3 (0.54-0.4), High = 4 (less than 0.4). 2. Actors interrelated with the wetland (network outdegree) from the social actors’ network: Low = 4 (less than 9), Middle-Low = 3 (9-11), Middle-High = 2 (11-20), High = 1 (more than 20). 3. High = 8-7, Middle-High = 6-5, Middle-Low = 4-3, Low = 2-1. Source: self-elaborated based on field data.
Here, we assume that the social actors are willing to cooperate and build trust, as our network of social actors is based on positive relationships and prior cooperation experiences. Therefore, following Bodin et al. (2011) and Kininmonth et al. (2015), a greater number of relationships in the network, founded on cooperation and trust, may enhance the social capital of wetlands, thereby improving the conditions for solving management problems compared to a less interconnected wetland.
The identification shows a high propensity for wetland management tensions in Térraba-Sierpe and Maquenque wetlands. These two cases have a high demand for products and a low number of social actors on the wetland’s network. Moderately exposed to management tensions are Caribe Noreste and Gandoca Manzanillo, as they have both a high demand for products and a high number of actors on their actors’ network. Caño Negro and Las Baulas wetlands also have moderate expectations for tensions, as they have both a low demand for products and a low number of social actors. Finally, Palo Verde is the only wetland that has a low expected propensity for tensions, since the wetland has a low demand for products and a high number of actors on the social network.
As observed, 29 % (two out of seven: Térraba-Sierpe and Maquenque) of the wetlands have conditions conducive to high tension in managing the wetland ecosystem, while 57 % (five out of seven: Caribe Noreste, Gandoca manzanillo, Caño Negro and Las Baulas) have a moderate propensity and 14 % (one out of seven: Palo Verde) have a more favorable scenario. These aspects should be addressed by policymakers, as decisions regarding sustainability and wetlands must be integrated into a comprehensive planning context to enhance well-being and improve environmental quality (Turner et al., 2000). In this regard, Bodin et al. (2011) emphasize that collaborative management, which incorporates strong relations between social actors, is necessary for successful management. This integrated planning approach is only feasible if the relationships between social actors and wetland ecological units are underscored and considered when assigning responsibilities.
Early literature has already documented that conflicts in wetlands management are not uncommon, as wetlands management authorities must contend with both land and water ecosystems. Therefore, various types of actors exert pressure on management interests (Hansen, 1982). In this context, Clare et al. (2013) emphasize that winners and losers emerge depending on how management policies are designed. They argue that a better approach to mitigating tensions in wetland management involves incorporating diverse opinions of social actors and their perspectives into wetland policy discussions. Similarly, to reduce potential tensions in wetland management, Cárcamo et al. (2014) stress the importance, of integrating ecosystem services and common social and environmental goals in the early planning stages of marine protected areas. However, in some cases, the integration of social and environmental goals has not been prioritized from the outset. In such instances, mitigating conflicts is beneficial for protecting wetlands, maintaining ecosystem services, and coordinating local socioeconomic development, as noted by Sun et al. (2021).
As we have demonstrated, combining the wetland social actor network with the provisioning services network provides valuable insights into the potential challenges faced by Ramsar wetlands in Costa Rica. Integrating the local population into future conservation and restoration initiatives could enhance the awareness of local inhabitants regarding a broader range of ecosystem services. For example, the results show that the Ministry of Education is not a central actor in the network, as indicated by its low indegree centrality. Thus, fostering collaboration between SINAC and the Ministry of Education together with the communities could potentially enhance the perspective that future generations have regarding the benefits of wetlands. This, in turn, may foster more positive relationships between communities, the ecosystem, and management authorities, as suggested by Evangelista et al. (2024). Consequently, one could expect the social networks of these wetlands to become better interconnected in the future.
We also agree with Marambanyika & Beckedahl (2017) who found that the local population plays a central role in both benefiting from and conserving Ramsar wetlands. As our results also suggest, Marambanyika & Beckedahl (2017) results found that poor institutional actors participation is associated with challenges in wetland governance, leading to management tensions, confusion, and conflict among social actors. In this context the engagement of communal leaders and local committees indicates a commitment to wetland conservation, given that their livelihoods depend on the health of the ecosystem. We fully endorse Marambanyika & Beckedahl’s (2017) conclusion that local communities should be at the core of institutional governance structures, particularly in developing countries where resources for wetland management and protection are limited.
Wetland conflicts typically arise from land use, human activities within wetlands, and, more recently, urban expansion (Sun et al., 2021). Similarly, Veas-Ayala et al. (2022) demonstrated that wetlands in Costa Rica face various vulnerability drivers associated with human activities in their vicinity. Specifically, Térraba-Sierpe wetland was identified as highly vulnerable, along with Caño Negro and Palo Verde wetlands. In our study, Térraba-Sierpe wetland exhibited conditions conducive to high management tensions, while Caño Negro had moderately high conditions and Palo Verde had low conditions, primarily based on social actors and household demand for products. Therefore, future research could benefit from combining approaches to gain a broader understanding of the challenges in wetland management. For example, integrating our approach, which considers community-based ecosystem services and wetland social actors’ network, with that of Veas-Ayala et al. (2022), which focuses on ecosystem health, would provide valuable insights.
Our findings suggest that sustaining ecosystem services is achievable through sustainable management that involves social actors in the process. By focusing on socio-ecological relationships, our study elucidates that societal and environmental interdependencies are critical to understanding wetland socio-ecological systems (Sayles et al., 2019). Consequently, actors within socio-ecological networks can learn from interactions, facilitating the development of updated management strategies based on socio-ecological changes (Barnes et al., 2019). It is also noteworthy to emphasize that the effectiveness of cooperative decision-making processes depends on various factors, including external policies and regulatory mandates, internal institutional administrative and budget structures, as well as institutional cultures and approaches to science and decision-making criteria (Behnken et al., 2016). Therefore, identifying constraints on cooperative action early in the wetland management planning process can help prevent future conflicts and management tensions.
Finally, we have shown that local inhabitants are aware of the benefits they obtain from wetlands. However, these benefits are primarily centered on provisioning and cultural services. While these services vary from wetland to wetland, fish provisioning is the most common across all Ramsar wetlands in Costa Rica. Given that the social actors network within wetlands highlights clear necessities for involving these actors, wetland management authorities should consider these factors to enhance ecosystem management and mitigate potential tensions among ecosystem service beneficiaries. Although these tensions differ between wetlands, almost all wetlands experience moderate to high conditions of management tensions due to their social network structures and the demand for wetland products by local communities.
Ethical statement: the authors declare that they all agree with this publication and made significant contributions; that there is no conflict of interest of any kind; and that we followed all pertinent ethical and legal procedures and requirements. All financial sources are fully and clearly stated in the acknowledgments section. A signed document has been filed in the journal archives.
See supplementary material

