


 English (pdf)
 Article in xml format
 Article references
 Send this article by e-mail
 Cited by SciELO
  Similars in
SciELO
Similars in
SciELO  uBio
uBio 
 Permalink
Introduction
Costa Rica has set ambitious targets for protecting its environment and strong emphasis on preserving its rich biodiversity. With around 702 366 hectares of secondary forest (Sistema Nacional de Áreas de Conservación (SINAC), 2015) and more than 25 % of its territory allocated to protected areas (Marx et al., 2017), Costa Rica is internationally recognized as an example for environmental protection. As for example, the national system for Payment for Environmental Services serves as a model for other countries seeking to balance economic development with environmental conservation (Le Coq et al., 2015). However, to consolidate the progress of national resources conservation, it is necessary to work on solutions to several problems, among which the prevalence of illegal activities such as logging and land use change and structural problems in territories where the rural population is concentrated and where nature conservation is a priority (Ministerio de Ambiente y Energía (MINAE), 2015).
In recent years, technical advances in the field of remote sensing and earth observation allowed the development and use of revolutionary methods for monitoring forest cover dynamics and landscape changes (Cipta et al., 2019; Marx et al., 2017; Yin et al., 2018). Among the technologies used, Synthetic Aperture Radar sensors (Hoekman et al., 2020), optical sensors (Coulter et al., 2016), data fusion of both types and the use of time series (Muñoz et al., 2020) have been successfully implemented and demonstrated useful results. On the other hand, among the data used today, the Normalized Difference Vegetation Index (NDVI) stands out for its importance, since it allows analyzing the vigor of the vegetation as well as monitoring and predicting the dynamics of the vegetation (Huang et al., 2021; Zhang et al., 2016).
When analyzing the NDVI through time series, it is possible to identify three categories of changes: seasonal, gradual and abrupt (Verbesselt et al., 2010). The seasonal changes are due to the natural variability of the reflectance according to the phenological cycles of the plants. Gradual changes occur due to slow environmental events, such as climate change, pest and diseases or anthropogenic actions such as “socola” (Wu et al., 2018). Finally, abrupt changes are due to sudden events that affect coverage, such as landslides or forest exploitation.
The detecting and monitoring land use/land cover (LULC) changes is crucial (Ngadi, et al., 2023). These changes can be detected by the algorithm of Breaks for Additive Season and Trend (BFAST) which allows the analysis of time series by decomposing them into trend and seasonality components to detect and characterize changes in a definite period of time (Anoma-Kouassi et al., 2022). BFAST iteratively estimates the time and number of abrupt changes within time series and characterizes the change by its magnitude and direction (Verbesselt et al, 2010). Using this algorithm, time series can be analyzed from various sensors (for example, Landsat and Sentinel) and can be applied to disciplines such as hydrology, climatology, and econometrics (Geng et al., 2019).
BFAST method detects significant seasonal changes in dense satellite image time series (SITS) by combining a high-speed algorithm with a time series similarity metric. Tested on various datasets, BFASTm-L2 effectively identifies changes, especially those caused by large-scale land acquisitions, outperforming existing algorithms in accuracy and speed crucial (Ngadi et al., 2023). BFAST can provide analysis of forest disturbances and resilience (Zhu et al., 2024) indicating that 20 % of forests in East, South, and Southeast Asia experienced disturbances from 2000 to 2022, with Southeast Asia being most affected. Notably, 95 % of forests showed robust resilience, often recovering within a few decades, with stronger resilience observed in forests experiencing greater disturbances.
This study evaluates the capacity of remote sensing applications to detect tree cover losses, logging and illegal logging in different land uses and landscapes by integrating time series analysis of the Normalized Difference Vegetation Index from Landsat and Sentinel (S2) using the Breaks for Additive Season and Trend (BFAST) algorithm and field data. In addition, the study explores the potential of using remote sensing information and physical variables such as slope and accessibility, to predict areas that are more vulnerable to illegal logging and then may benefit from stronger field and remote sensing monitoring. This aims at supporting national entities in their effort to prevent illegal logging and improve nature conservation.
Materials and methods
Study site: The study area corresponds to the Golfo Dulce Forest Reserve (RFGD), located in the Osa conservation area (ACOSA) and the Amistosa Biological Corridor (CBA), that connects the Osa conservation area (ACOSA) and the Amistad-Pacific conservation area (ACLA-P) (Fig. 1). The RFGD (8º23’37”-8º49’45” N & 83º15’53”-83º43’42” W) has an official extension of 59 915 ha. The climate of this area is characterized by an average annual temperature between 26 and 28 °C (Tapia, 2011a) and an average annual rainfall that varies between 3 000 and 6 000 mm (Tapia, 2011b). In the less humid parts, up to a dry month can be recorded.
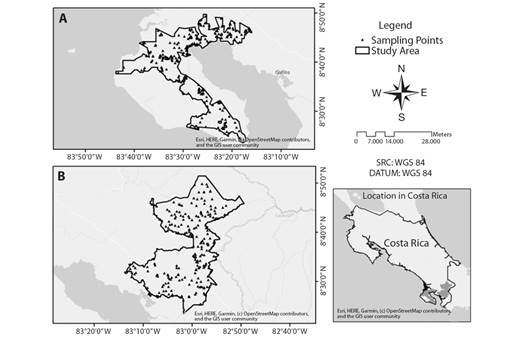
Fig. 1 Location of the study sites. A. Golfo Dulce Forest Reserve (RFGD) located in the Osa conservation area (ACOSA). B. the Amistosa Biological Corridor (CBA).
As for the CBA (5º33’31”-9º01’32” N & 83º13’46”-82º49’17” W), with an area of 92 913 ha (SINAC, 2018), the climate in the corridor is characterized by an average annual temperature between 20 and 28 °C (Tapia, 2011a) and an average annual rainfall that varies between 1 500 and 6 000 mm (Tapia, 2011b). In the driest parts, from one month up to three months of dry season has been reported.
On the other hand, forestry activities are intense in both study sites since the diagnoses of the regulatory plans define this region as an area of great forest wealth, with more than 40 timber species. According to field data campaigns, this caused 16 % of the forest to be logged between 1980 and 1995, further dividing an additional 3 %; being this area in great risk of being deforested (Roman & Angulo, 2013; Rosero-Bixby et al., 2002).
Implementation of the BFAST algorithm in SEPAL for change detection: Through the Sepal platform (Tondapu et al., 2018), a temporal analysis of the study area was carried out, in the period between June 1st, 2019 and December 31st, 2020 using the BFAST algorithm implemented through the BFAST GPU plugin. In the present study, a combined analysis was carried out between the Sentinel-2 and Landsat 8 images and the algorithm was programmed to detect monthly changes in the Normalized Vegetation Index (NDVI) on the surface of the area of study.
Random selection of sampling polygons and field control: Based on the results obtained by the algorithm, a review of the areas identified in SEPAL was carried out through the NICFI platform, which allows access to PLANET image mosaics. Based on this review, three categories of change were detected: Permanence of tree cover, loss of non-tree vegetation and loss of tree cover. For each of the classes, a random selection of the polygons with a negative change in NDVI was carried to determine the sample that was field visited. Then, the formula recommended by Chuvieco (2010) to establish a validation sample for a quantitative variable was used, to calculate the number of polygons to visit in each class.
Once the negative polygons were determined, a random selection of the positive polygons was carried out using the same number obtained for the negative areas. In total, 228 polygons were selected within RFGD with a total area of 133.98 ha (Fig. 1), which represents 2.81 % of the total area of the polygons identified by the algorithm in RFGD. In the case of CBA, 276 polygons with a total area of 216.78 ha were selected (Fig. 1), which represents a sampling of 1.32 % of the total area of the polygons identified by the algorithm.
Field measurements: Once the sampling areas were defined, each of the polygons to be checked in the field were visited by means of photogrammetric flights with UAVS at 120 m to determine the existence of logging signs within each area. According to the existence of infrastructures for forest exploitation and reduction of the canopy in the field, each polygon was assigned a damage category according to Table 1.
Table 1 Diagrammatic scale of damage assessment.
| Severity categories | Damage types |
| 1 | Place without loss of tree cover, there are no signs of any forest exploitation |
| 2 | There is a loss of tree cover due to the felling of individuals, there are signs of forest exploitation such as clearings and logging tracks |
| 3 | There is a loss of tree cover due to the felling of individuals and the creation of forest exploitation structures. Clearings, extraction tracks, skid trails and storage yards are observed |
| 4 | There is a loss of tree cover due to the felling of individuals and the creation of forest exploitation structures. Clearings, extraction tracks, skid trails and storage yards, loading yards and truck roads are observed. |
| 5 | The loss of tree cover causes a total change in land use in the area and the disappearance of the forest. |
Algorithm validation and data analysis: The results of the BFAST algorithm were validated using error matrices according to the results of the field control polygons. Any negative change in the NDVI detected by the algorithm was considered as a warning of loss of tree cover, while positive changes were considered as permanence or increase in canopy in each area. From the error matrices, the accuracy of the producer and the user was calculated for both classes, in addition to the total accuracy of each study area.
To determine the variables that influence the identification of areas where logging was carried out, various factors between field aspects and computational data were analyzed. The relationship between the changes in the NDVI detected by the BFAST algorithm and the results obtained in the field was analyzed. For this, the mode of the pixels of the raster obtained after the implementation of the algorithm was calculated using QGIS 3.18 (QGIS.org, 2021).
This information was compared with the information obtained in the field on the presence of logging signs in the polygon using a T-Test for independent samples in “R”. In order to study the relationship between the presence of logging in the field and the land use prior to logging, a supervised classification was carried out on the SEPAL platform of a mosaic generated for the 2019 year on the same platform and the results were compared using contingency tables and the calculation of Pearson’s Chi square statistic in “R” (R Core Team, 2021). Then, differences between land uses and damage categories were analyzed through changes in NDVI using Analysis of Variances (ANOVAS) tests in “R”.
In order to contrast the distance from the polygon to the routes and access roads and the presence of signs of logging in these areas, said distance was and classified into three different categories: from 0 to 500 meters, from 500 to 1 000 meters and more than 1 000 meters. With this classification, the distribution of frequencies of the polygons with and without logging signs in said categories is compared using contingency tables and the calculation of Pearson’s Chi-square statistic in “R”.
To determine the relationship between the polygons with logging signs and the slope percentage in these areas, firstly, the slope percentages were calculated from a Digital Elevation Model (DEM) obtained on the Copernicus platform. Then the mode of the raster pixels was associated with the slopes. Finally, it was compared with the information obtained in the field on the presence of logging signs in the polygon, using a T Test for independent samples in “R” (R Core Team, 2021).
Results
Algorithm validation: The results show that for the Amistosa Biological Corridor (CBA), a general accuracy of 54.51 % was obtained by the algorithm, while for the Golfo Dulce Forest Reserve (RFGD) the accuracy was 64.63 % when all negative changes detected in the NDVI were considered as lost in tree cover.
For the CBA, 35 polygons that were originally considered as polygons with loss of forest cover, in the field had indeed suffered type 2, 3, 4 or 5 damage (Fig. 2A) and 103 did not suffer changes and had remained as forest cover. In the case of RFGD, of the 114 polygons classified by the algorithm as loss of forest cover, 46 have actually suffered changes, which were verified in the field, and 68 remained unchanged.
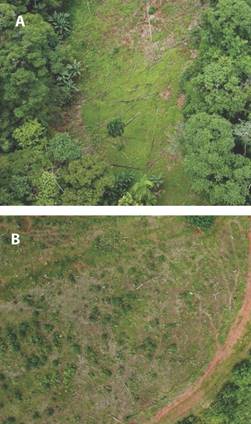
Fig. 2 Polygon with signs of logging detected in the field. A. Logging signs in forest polygon. B. Logging signs in wooded pastures.
The cases presented where the algorithm detected a negative change in the NDVI, but no cut signs were found in the field, can be explained due to various changes in the reflectivity of the canopy for reasons such as stress, seasonality, factors associated with the index, among others. The accuracy of the user of the tree cover loss class obtained for both CBA (25.36 %) and RFGD (40.35 %) shows that high possibilities are obtained of considering polygons that have not suffered damage as logging areas when only the direction of change of the NDVI is taken into account. On the other hand, the accuracy of the user (92.45 %) of the class “no change” indicates that there are low probabilities of classifying a polygon where a cut was carried out as “no change”.
Regarding the accuracy of the producer, there is a 51.24 % probability in CBA and a 43.59 % probability in RFGD of incorrectly classifying polygons that did not present changes within the logging class, when only taking into account the direction of change in the NDVI. However, despite the limitations presented, the algorithm is able to identify the logging of trees in various land uses such as wooded pastures (Fig. 2B).
Relation of the changes in the NDVI and the presence of logging in the field: There were differences between the polygons with and without signs of logging according to the direction and magnitude of the change in the NDVI for both CBA (p-value = 0.0002) and RFGD (p-value < 0.0001). The polygons where logging was carried out present much higher negative magnitudes of change compared to the polygons without change (Fig. 3).
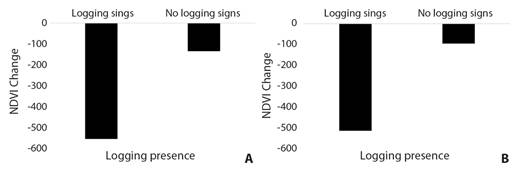
Fig. 3 Changes in the average NDVI according to the presence of logging signs. A. Amistosa Biological Corridor. B. Golfo Dulce Forest Reserve.
Similarly, there are significant differences between the categories of damage observed in the field and the change in the NDVI calculated by the algorithm in both study areas (p-value = <0.0001). The greatest magnitude of change detected was present in the polygons under category 3 (Fig. 4).
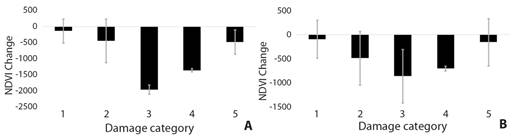
Fig. 4 Changes in the average NDVI according to damage category. A. Amistosa Biological Corridor. B. Golfo Dulce Forest Reserve.
Fig. 4 shows how the detected NDVI change increases from category 1 to category 3 and then decreases from category 4 to 5. This may be due to the fact that categories 4 and 5 have almost or completely lost their tree cover, which means that they have a reflectance similar to non-forested areas and that the change in NDVI is more stable and tends towards 0.
Most of the categories that imply the presence of logging (2, 3, 4 and 5) show NDVI changes below -500, which implies that areas with a value above -500 are more likely to represent polygons without changes (Fig. 4). Therefore, a validation was carried out again, considering as classified with the possibility of logging only those polygons where the algorithm detected a negative change in the NDVI below -500. Using this new limit, the global accuracy increases to 75.82 % in the case of CBA and up to 75.82 % in the case of RFGD.
Relation of physical variables of the environment and the presence of logging: There are no significant differences between the presence or not of logging according to the land use of each polygon (CBA: p-value = 0.8008, RFGD: p-value = 0.1205); however, the frequency distribution shows that most of the cuts detected in the field occur within the forest category, followed by the pasture class.
The study shows that there is a significant relationship between logging and the distance to the roads in CBA (p-value= <0.0159) and RFGD (p-value= <0.0001) (Table 2).
Table 2 Relationship between the presence of logging and the distance to roads.
| Distance from roads | CBA | RFGD | ||||
| Logging | No changes | Total | Logging | No changes | Total | |
| 0 - 500 m | 32 | 104 | 136 | 39 | 63 | 102 |
| 500 - 1 000 m | 6 | 35 | 41 | 7 | 22 | 29 |
| More than 1 000 m | 5 | 62 | 67 | 5 | 71 | 76 |
| Total | 43 | 201 | 244 | 51 | 156 | 207 |
The areas with the presence of logging decrease as the distance to the access roads increases, which coincides with the dynamics of logging on the site, since vehicle access is necessary to carry out the extraction of the wood.
When analyzing the behavior within the class from 0 to 500 m, the same trend is observed in both zones, since the majority of polygons with presence of logging are located between 0 and 100 m, decreasing the frequency as the distance to the tracks increases (Fig. 5).

Fig. 5 Relationship of the presence of signs of logging and distance from the area to the access roads within the category of 0 to 500 m. A. Amistosa Biological Corridor. B. Golfo Dulce Forest Reserve.
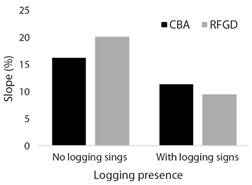
Regarding the relationship between the percentage of slope and tree cuts, the p-value obtained (< 0.0001) allows us to determine that land with a lower slope is more likely to be log (Fig. 6).
Discussion
By associating the information generated through the methodology exposed in this paper, with the logging licenses granted in the area, it would be possible to create a digital monitoring system that allows to determine loggings that were carried out illegally. This system could even include the information from the date of logged detected by the methodology, to the period of each logging license, so that it can be determined if, once the time of a license expires, illegal logging continues and could result in a possible change of land use.
Efforts to create similar systems are recorded worldwide. For example, Miomir et al. (2018), worked with the Minister of Science and Technological Development of the Republic of Serbia on forest inventories and illegal logging prevention in this country by analyzing NDVI changes in Landsat images from 2006 to 2014. Also, Isaienkov et al. (2020), used Deep Learning in Sentinel 2 images to detect regular changes in Ukrainian forest ecosystems which develop in periodical and effective monitoring of changes in forest cover.
On the other hand, it is important to understand the limits of remote sensing technologies. While the models have the potential to be adopted and offer operational functions, it is important to highlight some characteristics and interpretation of NDVI in different conditions. For example, that the algorithm detected negative changes in NDVI without trees being cut may be due to the seasonality of the area, that is, the changes that occur in the trees such as the loss of leaves, flowering and fruiting, depending on the season of the year in which it is found among other climatic and physiographic characteristics (Olivares & López-Beltrán, 2019). In addition, under drought and pest vegetation stress (Rimkus et al., 2017), the reflectance is changing (Sun et al., 2018). Therefore, this difference in spectral response can lead to negative changes in NDVI over time (Díaz, 2015). In addition, the spatial heterogeneity of the NDVI values in a particular region could also be influenced by the topography and environmental variables (Gómez, 2019).
Related to the factors associated with the index that can cause the identification of logging that have not undergone any change, is that the NDVI has the drawback of being sensitive to different climatic and environmental factors (Dong et al., 2021) like the reflectivity of the soil on which the vegetation is located, which limits its discrimination potential. For example, in an area with low density of vegetation, the reflectivity of a pixel would be determined mainly by the ground, with a small variation due to the presence of vegetation. In fact, this problem occurs more frequently when the vegetation cover is less than 50 % (Muñoz, 2013). This would explain some of the cases where negative NDVI values were obtained in polygons where the trees had considerable distances, for example, in wooded pastures, or there were natural clearings within the forest, but no cutting of trees was detected in the field.
However, despite some limitations, the algorithm was able to identify tree logging even within wooded pastures. This shows why the NDVI continues to be recommended and is widely used to describe the spatio-temporal variation of vegetation cover in different terrestrial ecosystems (Meera et al., 2015), due to the long time series and global coverage, which makes this index one of the most suitable for characterizing the vegetation cover of a particular area (Ayhan et al., 2020) and also allows identifying changes and trends in a given period (Gómez, 2019; Usman et al., 2015).
At last, by integrating different data sources such as road network and terrain slope, it is possible to equip illegal monitoring activities with models that helps cost-effective methods and approaches and support nature conservation. In terms of the relation between forestry use and the distance to the road network, this study shows that most logged areas appear on a range from 0 m to 500 m which coincides with the average travel distance of 500 m necessary for an average productivity in wood harvesting labor (Cadei et al., 2020). The results obtained also coincides with López-Alegría et al. (2018 , who analyzed and modeled spatial patterns of deforestation in the La Unión micro-basin in the municipality of Chiapa de Corzo, Chiapas, Mexico; and determined that there is a relationship between the distance of the roads and the probability of logging, since, the greater the road network, the greater the population density and therefore greater pressure on the production of the forests. This study also coincides with that published by Pérez (2021), who determined that there is a relation between the distance to the road network and deforestation in the Pómac Forest Historic Sanctuary, Peru; and its buffer zone.
In terms of the relation between forestry use and the terrain slope, this study coincides with that reported by Putz et al. (2019), who studied the behavior of forest harvesting processes in Indonesia, Gabon, Democratic Republic of Congo, Republic of Congo, Suriname and Mexico and determined that loggers tend to avoid steep slopes, largely due to the fact that said topography increases exploitation costs by requiring techniques and machinery that allow overcoming gravitational forces. Also, Quispe (2021), studied deforestation patterns in the district of Nueva Requena (Peru) and coincide with this study since he determined that on slopes less than 20 % there was greater deforestation, with the trend on slopes being even more evident in areas with less than 11 %.
In conclusion, this study demonstrates how the implementation of the BFAST algorithm in the SEPAL platform allows for repeated information on the location and period of forest cover logging in the study areas. The integration of the methodology used in this paper in the monitoring labors within institutions such as the National System of Conservation Areas of Costa Rica would allow governments to carry out more efficient monitoring of logging within conservation areas and therefore decrease the country’s deforestation rate.
Ethics statement: the authors declare that they all agree with this publication and that they have made contributions that justify their authorship; that there is no conflict of interest of any kind; and that they have complied with all relevant ethical and legal requirements and procedures. All funding sources are fully and clearly detailed in the acknowledgments section. The respective signed legal document is in the archives of the magazine.

