




 English (pdf)
 Article in xml format
 Article references
 Automatic translation
 Send this article by e-mail
 Cited by SciELO
  Similars in
SciELO
Similars in
SciELO  uBio
uBio 
 Permalink
Introduction
In cities, air pollution has become one of the most serious environmental problems, contributing significantly to climate change (Grimm et al., 2008). Vehicle emissions contain particulate matter smaller than 10 microns (PM10) and a mixture of biologically dangerous gases as carbon oxides (CO, CO2), nitrogen oxides (NO, NO2), sulphur dioxide (SO2), methane (CH4), volatile organic compounds (VOC); some of these substances could react in the troposphere to produce ozone (O3) (Ban-Weiss et al., 2008; Gallardo et al., 2012; Gentner et al., 2012). Negative effects of these pollutants on human health, as heart disease, asthma and cancer, have been widely reported (MacNee & Donaldson, 1999; Krzyżanowski, Kuna-Dibbert, & Schneider, 2005).
Urban forests and street trees play a key role in air purification (Beckett, Freer-Smith, & Taylor, 1998; Jim & Chen, 2007; McDonald et al., 2007). The foliage of trees can retain hundreds of tons of air pollutants per year, thus reducing the incidence of human illnesses. Other ecosystem services provided by urban greening include microclimate regulation, carbon sequestration and the positive influence in psychological and social wellbeing of people (Sullivan, Kuo, & Depooter, 2004; Roy, Byrne, & Pickering, 2012; Nowak, Greenfield, Hoehn, & Lapoint, 2013; Wang, Bakker, de Groot, Wortche, & Leemans, 2015). Nevertheless, when trees are exposed to extreme levels of pollutants, physiological stress becomes evident, with considerable changes in biomass accumulation, transpiration, content of photosynthetic pigments, CO2 exchange, growth and productivity (Carreras, Cañas, & Pignata, 1996; Gratani, Crescente, & Petruzzi, 2000; Takagi & Gyokusen, 2004; Joshi & Swami, 2007). More research in ecophysiology is necessary to identify management methods that guarantee the offer and improvement of tree ecosystem services (Calfapietra, Peñuelas, & Niinemets, 2015).
Particulate matter released by vehicle fuel combustion and then accumulated on leaves contains organic matter and different phytotoxic substances such as ammonium, nitrates, sulfates and trace elements as Al, As, Cd, Cr, Cu, Fe, Ni, Pb, Ti, and Zn (Tomaševič, Vukmirovič, Rajšič, Tasič, & Stevanovič, 2008; Przybysz, Sæbø, Hanslin, & Gawroński, 2014a). All of these can severely affect photosynthetic processes. For example, a film of particulate matter might block the capture of sunlight (Seoánez, 2002), clog stomata and reduce gas exchange (Beckett et al., 1998; Rai & Kulshreshtha, 2006; Przybysz et al., 2014b). Enzymes relating to photosynthesis and respiration can also be inhibited (Singh, Pandey, Misra, Yunus, & Ahmad, 1997). The physiological effects of air pollution could ultimately lead to declining in growth and development.
Tree responses to environmental stress are complex and associated with structural and biochemical changes occurring during growth from seedlings to adults (Niinemets, 2010). Beyond the tolerance limits, signs of leaf damage could appear as a result of both the direct effects of pollution and indirectly through the emergence of pests and diseases. A reduction in healthy foliage becomes a negative feedback for growth and productivity (Emberson et al., 2001; Przybysz et al., 2014b), affecting the fructification and the urban fauna that depends on tree resources.
In Bogotá district, vehicles release more than 80 % of the COX and VOC emissions, 77 % of the NOX and 36 % of the PM10 of total air pollutants (Zárate, Belalcázar, Clappier, Manzi, & Van den Bergh, 2007); in 2009, total emission of pollutants reached 6.5 million tons (SDMB, 2011). Number of cars increased 81 % and the motorcycles tripled in the 2008-2016 period alone (CCB-UNIANDES, 2017). The district has a complete monitoring database of 1.3 million of urban trees (http://sigau.jbb.gov.co/SigauJBB/VisorPublico) and analyses of distributions of leaf diseases appears not to be related to climate variables (Posada & Ramos, 2012). The remaining question is if the health and physiology of urban trees are related to pollution levels in the streets. Even though pollution tolerance depends on the species, age, and health, currently relationships between physiological performance of trees and levels of vehicular pollution are unclear.
In this study, the accumulation of particulate matter on leaves (PMAL) and physiological traits of five urban tree species were quantified in sixty points in Bogotá, with the aims to (1) build a model explaining the PMAL based on traffic variables, (2) establishing the effect of vehicle pollution on physiological and phytosanitary variables, and (3) comparing the susceptibility of seedlings and trees to vehicle pollution. The physiological performance of different species in the city could be a useful tool for a better urban forestry planning.
Materials and methods
Study area: Bogotá, the capital district of Colombia (South America), currently harbors approximately 8 million citizens. It is located at 2 600 m altitude and has a tropical climate that is highly influenced by mountain regimes of humidity and winds. The institution in charge of managing the urban forest is the Jardin Botánico de Bogotá (JBB). Sixty sampling points were located along different avenues and streets of the city. All were close enough to JBB to take prompt physiological measurements on cut material. Following the usual traffic patterns, the sampling points were classified into four levels of exposure to vehicle pollution: control, residential streets (RS), low traffic avenues (LTA) and high traffic avenues (HTA) (Table 1).
TABLE 1 Description of sampling point sites
| Level of exposure | Lanes | Sampling points | Traffic Description |
| Control | 0 | 10 | Points in the centers of parks, with a minimum distance to the nearest avenue > 100 m. |
| Residential street (RS) | 1 | 17 | Used primarily by neighborhood residents. |
| Low traffic avenue (LTA) | 2 | 15 | Highly used for private transport. Presence of public transport. |
| High traffic avenue (HTA) | 4-6 | 18 | Highly used for public and private transport. |
According with the JBB’s System for Management of Urban Forest (http://sigau.jbb.gov.co), around 1.3 million trees, representing approximately 300 species, have been used to forest the city at an average density of 0.15 trees per inhabitant. Croton bogotanus Cuatrec., Eugenia myrtifolia Sims., Ficus soatensis Dugand, Schinus mole L., and Sambucus nigra L.,are frequently occurring, widely distributed species in Bogotá. Two of these species, C. bogotanus and F. soatensis are only distributed in Colombia, S. molle have a neotropical origin, whereas E. mytifolia and S. nigra were introduced from Australia and Europe respectively (Infante-Betancour, Jara-Muñoz, & Rivera-Díaz, 2008; Blando, Onlu, Colella, & Konczak, 2013). Seedlings of three species, C. bogotanus, E. myrtifolia, and S. nigra were available for study in the greenhouses of the JBB. Specific health information of each tree is available in the System for Management of Urban Forest. Fungal disorders are the primary causes of leaf symptoms in these species (unpublished data).
Urban variables and sampling: At each sampling point, vehicle flow (no. of vehicles/min) and types of vehicles were recorded using a digital camera (Canon EOS 450D) to characterize the source of pollution from 07:30 h to 09:00 h (peak morning traffic time) on working days, during the low-rainfall season of June-August of 2009. Vehicles were classified in private cars, taxis, buses and others. Additionally, the number of lanes and tree-to-avenue distance were registered, using for this last one a laser distance meter (UNI-T-UT391), or a GPS in the case of control sites (Garmin 62SC).
Three trees were sampled per site. Height and diameter at breast height (DBH) were measured, and four to six branches per tree were randomly collected with a bypass pruner, in the stratum between 1.8 and 2.5 m in height. These branches were bagged and taken to the laboratory at JBB, kept in pots with water and cut again inside the pots to reduce cavitation. A total of 180 trees were sampled (around 36 individuals per species) and physiological measurements were performed from 09:30 h to 12:00 h in the Laboratory of the Scientific Division of the JBB.
Particulate matter accumulated on leaves (PMAL): PMAL was calculated by weighing branches (OHAUS analytical balance) before and after careful cleaning with a diluted ethanol solution (5 % v/v). Cut plant tissues continue to lose water in the time between the initial and final fresh weight measurements, so the data were corrected using specific transpiration curves for each species, made with calculations of % weight loss per minute. Later, samples were dried at 85 °C x 48 h and weighed again to determine the dry biomass (dw). PMAL was expressed in two forms: percentage (in relation to the total weight of leaves) and g Kg-1dw.
Physiological measurements on trees
Stomatal conductance (G S )
A LI-1600 (LI-COR Biosciences) porometer was used to take measurements of the stomatal conductance (mmol H2O m2 s-1) under laboratory conditions (17-20 °C, 25-40 % HR), not more than two hours after the samples collection. This parameter was used to estimate stomatal opening under different accumulations of particulate matter but similar conditions of cavitation. Leaf temperature remained relatively homogeneous during the GS measurements (18.4-21.2 °C).
Photochemical efficiency (Fv/Fm)
Non-cleaned branches in pots with water were previously acclimatized for 30 min in a dark room. A pulse amplitude modulation PAM-2000 chlorophyll fluorometer (WALZ) was used to take measurements. Pulses of saturating light at 0.8 s and 1 100 µmol quanta m-2 s-1 were applied on two leaves per branch to measure the maximum quantum efficiency of photosystem II, which corresponds to the ratio of variable fluorescence to maximal fluorescence.
Leaf area (LA) and Specific leaf mass (SLM)
All the leaves from two branches per tree were scanned (HP Scanjet 8 300, 2 400 x 2 400 dpi), and Image J software (v. 1.46) was used to determine the leaf area. Leaves were dried at 85 °C for 36 h and weighed. Specific leaf mass was expressed as g m-2.
Chlorophyll content
Pieces of five mature leaves per point were crushed with mortar and pestle and homogenized in acetone (80 %), and their absorbance at 645 and 663 nm was read with a spectrophotometer. Concentrations of chlorophyll a and b were calculated by applying the formulas from Linchtenthaler and Buschmann (2001) as follows:

Where fw is the fresh weight of the sample, concentrations of chlorophyll are given in mg gfw-1 and V is the final volume (ml) of the extract.
Fruit size
To determine if the vehicle pollution could influence the productivity of urban trees, two branches with fruits were collected per tree where possible, and polar diameter of the mature fruits were measured.
Phytosanitary condition
Severity (% affected area) of leaf symptoms in terms of chlorosis, blight, spots and necrotic blotch were evaluated in all the leaves taken from three branches per tree, using scanned images (HP Scanjet 8 300, 2 400 x 2 400 dpi) that were analyzed with Image J software (v. 1.46). The affected areas were added together to obtain the total severity of leaf symptoms, expressed as percentage of the total leaf area. In a similar way, the severity of pests, that is, herbivory and coccid sucking spots was quantified. A third variable of phytosanitary condition was the health of leaves, estimated as:
Health of leaves (%) =
100-severity of leaf symptoms (%)-severity of pests (%)
Ontogenic effect
Thirty seedlings of C. bogotanus, E. myrtifolia, and S. nigra, of 0.5 to 0.8 m in height, were transported from the District greenhouses, in a suburban zone of the city, to the greenhouses in the JBB. They remained in pots with enriched substrate and had an acclimation period of one week in the JBB greenhouse for their initial measurements. The same physiological parameters measured in trees were evaluated in seedlings, except for stomatal conductance, which could not be taken because of technical failures with the porometer. Later, five individuals per species were randomly assigned to: (1) control conditions in the greenhouse of the JBB, or (2) HTA treatment, in which the seedlings were planted in the green median of 68 Avenue, one of the busiest roads in the city. Irrigation was done twice a week. After three months, seedlings on HTA were carried again to JBB laboratory to compare the final physiological performance with control seedlings. The measurements of trees (June-August) and the experiment with seedlings (June -September) followed the same proceedings, to guarantee that the main source of variation was ontogenic.
Statistical analysis: Data analyses were performed using Statistica 10.0 software. Pearson correlations and a multiple regression using significant relationships were used to model PMAL as a function of the traffic and tree variables. ANOVAs were performed to test the effect of traffic on the physiology of trees and seedlings and the post hoc Fisher LSD was applied to find specific differences in pairs of groups. Some variables were log-transformed by using ln(X+1) to obtain a normal distribution. Rank correlations among traffic, physiological and tree health variables were used to summarize specific associations and trends by species.
Results
Exposition to vehicle emissions: A total of 3 363 vehicles were filmed at the sampling points. The mean of vehicle flow was 119.5 veh. min-1 in HTA, 54.5 veh. min-1 in LTA, and 4.2 veh. min-1 in RS. Most of the vehicles in the avenues were private cars (40.5 %) and taxis (11.4 %), whereas buses contributed to only 8 % of the traffic. The size of sampled trees varied from 2.7 to 21.2 m in height and from 7.6 to 74 cm in DBH. The tree-to-avenue distance varied from 0.2 m in a residential street to 9.1 m in a high-traffic avenue.
Particulate matter accumulated on leaves and influence of traffic: The PMAL was positively correlated with the vehicle flow (r= 0.694, P < 0.01; Fig. 1A) and varied from 0.15 % in a control individual of C. bogotanus to 8.3 % in an HTA-treatment individual of F. soatensis. These two species differed significantly (LDS test, MS= 2.42, df= 55, P= 0.04; Fig. 1B). Neither the DBH nor leaf area had variations related to the PMAL.
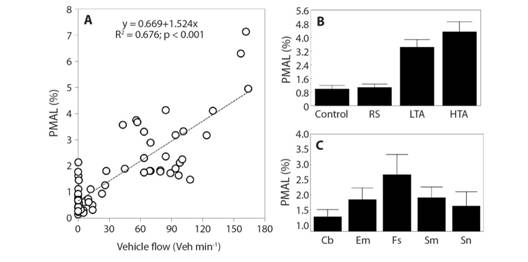
Fig. 1 Correlation between vehicle flow and particulate matter accumulated on leaves (PMAL) (A), and PMAL (Mean ± SE) per site (B) and tree species (C). RS: Residential street; LTA: Low traffic avenue. HTA: High traffic avenue; Cb: Croton bogotanus, Em: Eugenia myrtifolia, Fs: Ficus soatensis, Sm: Schinus molle, Sn: Sambucus nigra.
The primary components of PMAL variance (F4,55= 11.76, P < 0.001) were the number of lanes (beta= 0.468, t= 3.3), the vehicle flow per lane (beta= 0.367, t= 2.76), the heights of trees (beta= 0.156, t= 1.43) and the distance from trees to the avenue (beta= 0.08, t= 0.69). The best linear model to explain (46.1 %) the variable %PMAL was:
%PMAL = -0.168 + 0.446 (number of lanes) +
2.21 (flow per lane) - 0.002 (distance to avenue) +
0.04 (Tree height)
Physiological responses of tree species to vehicular pollution: The physiological behavior of most of the adult trees, in terms of their pigment content, photochemical efficiency, stomatal conductance, specific leaf mass, leaf area, and health of leaves was influenced by exposure to vehicular pollution. Fig. 2 shows the most relevant and significant trends in tree physiology among the species. The photochemical efficiency of C. bogotanus (F3, 105= 6.45, P < 0.01) E. myrtifolia (F3, 93= 3.4, P = 0.02), and S. molle (F3, 93= 3.8, P = 0.01) increased with the level of pollution. In four species, the stomatal conductance followed a bell pattern of low gas exchange in control sites, high values in RS and LTA (F3, 65 > 4.5, P < 0.01), and decreasing again in HTA. Similar variations were found in the content of chlorophyll b: S. molle had maximum values in LTA (F3, 9= 5.8, P = 0.02) and S. nigra in RS (F3, 10= 2.73, P = 0.05). Concentrations of chlorophyll a and total chlorophyll did not show significant differences in relation to vehicular emissions. Trees of C. bogotanus (F3, 95 > 6.64, P < 0.01), F. soatensis (F3, 104 > 4.68, P < 0.01)and S. nigra (F3, 113 > 4.63, P < 0.01) had a higher specific leaf mass in HTA than in control sites, and two of these species exhibited besides a higher leaf area in control sites. Contrary, the size (F3, 104 > 2.92, P = 0.04) and health (F3, 89 > 5.65, P < 0.01) of leaves of S. molle increased in more polluted sites. No relevant responses in the severity of pests or diseases were found when comparing trees of avenues and control sites.
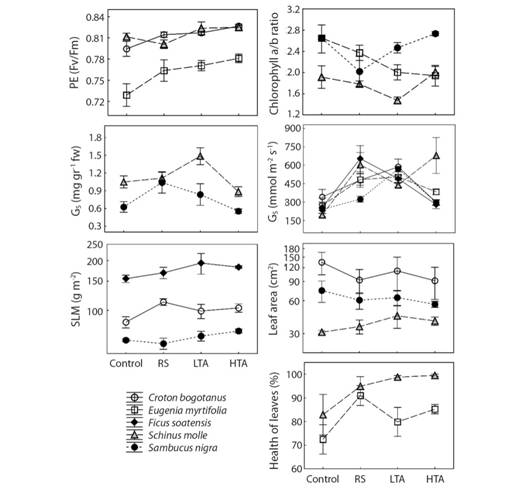
Fig. 2 Most relevant trends (Mean ± SE) in physiological performance of five tree species exposed to four levels of vehicle pollution. PE: Photochemical efficiency; SLM: Specific leaf mass; GS: Stomatal conductance. RS: Residential street; LTA: Low traffic avenue. HTA: High traffic avenue.
Relationships among vehicular pollution, tree physiology, and phytosanitary condition. There were 28 general and specific correlations between physiological or health variables of trees and traffic or pollution variables (Table 2). The increase in PMAL (in both of their measurements) was associated with high photochemical efficiency, low stomatal conductance, low severity of leaf symptoms and therefore, better health of leaves. In E. myrtifolia, PMAL was positively related with the severity of pests. Other traffic variables, as tree-to-avenue distance, vehicle flow or vehicle flow per lane, showed associations with physiological variables that would not be evident through the analysis of PMAL. In general, C. bogotanus and S. nigra were species with scarce physiological responses to vehicle emissions, whereas E. myrtifolia and S. molle appeared to be more affected by level of exposition to vehicles.
TABLE 2 General and specific correlationsbetween traffic variables and physiological variables
| Physiological variable | Traffic/pollution variable | Tree species | |||||
| Overall (N = 60) | Cb (N = 11) | Em (N = 12) | Fs (N = 12) | Sm (N = 12) | Sn (N = 13) | ||
| Ratio of chlorophylls a/b | DISTAVE | 0.258* | |||||
| PMAL (%) | -0.636* | 0.566* | |||||
| Photochemical efficiency | VF | 0.729** | |||||
| DISTAVE | -0.602* | ||||||
| PMAL (%) | 0.255* | 0.608* | 0.622* | ||||
| Stomatal conductance | VFPL | 0.718** | |||||
| DISTAVE | -0.709** | ||||||
| PMAL (g Kg-1 dw) | -0.762** | ||||||
| Transpiration | VFPL | 0.722** | |||||
| PMAL (g Kg-1 dw) | -0.615* | ||||||
| Specific leaf mass | VF | 0.595* | |||||
| PMAL (%) | 0.610* | ||||||
| Leaf area | VFPL | -0.715** | |||||
| PMAL (g Kg-1 dw) | -0.70* | ||||||
| Health of leaves | PMAL (g Kg-1 dw) | 0.594* | |||||
| PMAL (%) | 0.291* | 0.643* | 0.691* | ||||
| Severity of leaf symptoms | PMAL (g Kg-1 dw) | -0.636* | |||||
| PMAL (%) | -0.271* | -0.594* | -0.662* | ||||
| Severity of pests | PMAL (g Kg-1 dw) | 0.279* | 0.713** | ||||
| PMAL (%) | 0.692* | ||||||
| Physiological variable | Phytosanitary condition | Overall (N = 60) | Cb (N = 11) | Em (N = 12) | Fs (N = 12) | Sm (N = 12) | Sn (N= 13) |
| Total chlorophyll | SPEST | 0.692* | |||||
| Ratio of chlorophylls a/b | HLE | -0.329* | |||||
| SELS | 0.368** | ||||||
| SPEST | -0.601* | ||||||
| Stomatal conductance | NSYM | -0.636* | |||||
| Specific leaf mass | HLE | 0.435** | |||||
| SELS | -0.435** | ||||||
| NSYM | -0.508** | -0.673* | |||||
| Leaf area | HLE | -0.403** | -0.673* | ||||
| SELS | 0.410** | ||||||
Em: Eugenia myrtifolia, Fs: Ficus soatensis, Sm: Schinus molle, and Sn: Sambucus nigra. Asterisks denote significant (*P < 0.05) or highly significant (**P < 0.01) Spearman correlations.
PMAL: Particulate matter accumulated on leaves. DISTAVE: Tree-to-avenue distance. VF: Vehicle flow. VFPL: Vehicle flow per lane. SPEST: Severity of pests. HLE: Health of leaves. SELS: Severity of leaf symptoms. NSYM: number of leaf symptoms.
Ontogenic effect on physiological responses to vehicular pollution. Age of tree affected susceptibility to vehicular pollution (Fig. 3) (Age x traffic effect: F11, 35= 4.99, P < 0.01). Seedlings had greater specific leaf mass (F1, 53= 4.1, P = 0.048) and lower chlorophyll content (F1, 53= 5.04, P = 0.029) in higher traffic streets, whilst mature trees’ responses were less affected. The photochemical efficiency of seedlings planted in avenues declined by 9% (F1, 53= 5.39, P = 0.024), and in C. bogotanus, this effect was accompanied by a reduction in the ratio of chlorophylls a/b (F1, 15= 10.9, P < 0.01). Seedlings were less affected by leaf symptoms than trees (F1, 53= 10.1, P < 0.01).
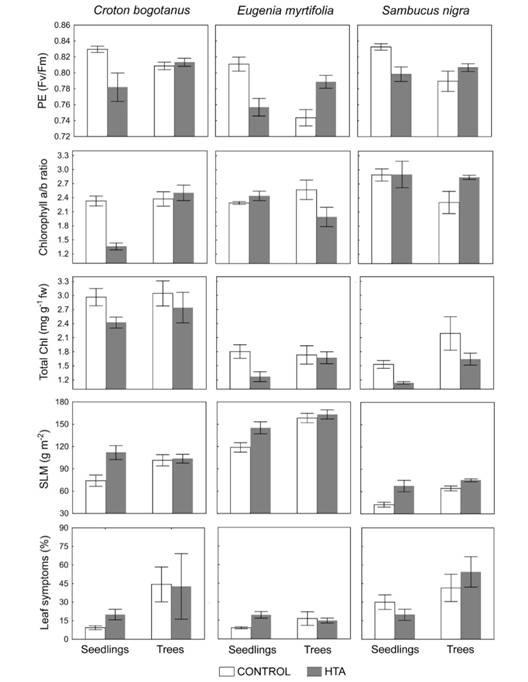
Fig. 3 Effects of exposure to traffic on the physiology of seedlings and trees (Mean ± SD). Control: Jardín Botánico de Bogotá. HTA: High traffic avenues.
Effect of vehicle pollution on productivity. Fruit measurements from all levels of vehicular exposure were only taken for F. soatensis and E. myrtifolia. The total number of measured fruits was 72, 68, 91, 44 and 39 for C. bogotanus, E. myrtifolia, F. soatensis, S. molle and S. nigra respectively. Exposure to vehicle pollution affected the productivity, as evidenced by seedling growth and fruit sizes (Table 3). The mean growth of seedlings of C. bogotanus and E. myrtifolia planted in the middle of the avenue, was respectively 52 % lower and 39 % higher than growth of control seedlings. The fruits of C. bogotanus, E. myrtifolia and F. soatensis were much smaller than fruits from control sites. Only in the case of S. molle, fruits from control sites were smaller than those from the avenue’s trees.
TABLE 3 Comparisons of tree seedling growth and fruit size between the control sites (JBB) and a high-traffic avenue (68 Avenue)
| Seedling Growth (cm) | Size of tree fruits (mm) | |||||
| Control | HTA | P | Control | HTA | P | |
| C. bogotanus | 8.66 ± 2.04 | 4.16 ± 2.2 | 0.02 | 15.32 ± 0.9 | 12.0 ± 1.1 | < 0.01 |
| E. myrtifolia | 10.68 ± 2.7 | 14.95 ± 2.6 | 0.05 | 26.05 ± 1.9 | 21.83 ± 1.9 | < 0.01 |
| S. nigra | 14.06 ± 3.2 | 14.05 ± 2.2 | 4.92 ± 0.24 | 4.75 ± 0.3 | - | |
| F. soatensis | - | - | - | 12.3 ± 0.92 | 7.64 ± 0.9 | < 0.01 |
| S. molle | - | - | - | 5.53 ± 0.37 | 6.09 ± 0.4 | < 0.01 |
Discussion
On the morning of any business day, the flow of vehicles in high-traffic avenues was 28 times higher than in residential areas from Bogotá, and the main types of vehicles are cars and buses. As expected, the vehicle flow was positively correlated with the PMAL, but a low determination coefficient shows that other urban variables contribute to PMAL levels. Specific characteristics of trees leaves can lead to different levels of PM accumulation (Freer-Smith, Beckett, & Taylor, 2005; Popek, Gawrońska, Wrochna, Gawroński, & Sæbø, 2013), and this study showed that leaves of F. soatensis accumulated proportionally more quantity of particulate matter while C. bogotanus, probably by the presence of foliar secretions, adhered less material.
The best model for predicting the PMAL used the vehicle flow per lane, tree height and the distance from the trees to the avenue, which indicates that better planning of these aspects during urban design can optimize the air-cleaning capacity of trees. The particle sizes could be included to improve the model in the future. The fraction of small particles, especially PM2.5 (particulate matter smaller than 2.5 μm), is often variable and has the highest adhesion and penetration in leaves (Dzierżanowski, Popek, Gawrońska, Sæbø, & Gawroński, 2011). Other variables to consider are the distances among the trees and the leaf area index because density and continuity of foliage could function like a wall for pollutants, inclusive affecting their pattern of dispersion.
The accumulation of particulate matter is definitively related to changes in tree physiology. Nevertheless, the combined impact of all traffic variables was very complex because of their interactions and the species under evaluation. Based on the results of linear correlations, the possible way in that traffic variables interact with physiology and health of trees, is summarized in Fig. 4.
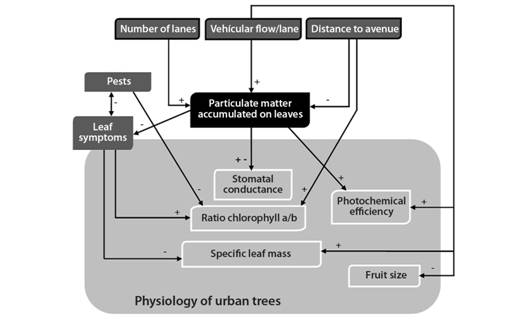
Fig. 4 Relationships between the traffic and biological parameters for five species of urban trees in Bogotá. The PMAL had a direct effect on the gas exchange, photochemical efficiency and leaf symptoms. The pests and diseases affected the pigment content and the allometry of the leaves. Positive and negative interactions are denoted by signs on the arrows.
The most evident physiological response was a higher photochemical efficiency in high traffic avenues, which can be associated with adaptations to shade (Gross, Homlicher, Weinreich, & Wagner, 1996) and foliar assimilation of nitrite and nitrate as nitrogen source that enhances the photosynthetic apparatus (Chaparro-Suarez, Meixner, & Kesselmeier, 2011; Hu et al., 2016). Increases of specific leaf mass (C. bogotanus, F. soatensis, S nigra) and stomatal conductance (E. myrtifolia y S. molle)in avenues are evidence of higher carbon assimilation stimulated by CO2 emissions (Mcelrone, Reid, Hoye, Hart, & Jackson, 2005; Liu & Li, 2012,). Nevertheless, a trend of reduction in the GS of C. bogotanus, E. myrtifolia and S. nigra from LTA to HTA suggest that extreme exposures to traffic led to clogging of stomata (Beckett et al., 1998; Rai & Kulshreshtha, 2006; Przybysz et al., 2014a) and oxidative damage by ozone (Alonso et al., 2011). The low leaf areas of these three species in HTA demonstrates that accumulation of particulate matter affects growth. Previous research estimated that approximately 40 % of particles penetrate the epidermal layer of leaves (Kuang, Xi, Li, Zhu, & Zhang, 2012; Popek et al., 2013), and sensitive species undergo reductions in stomata density (Lake, Woodward, & Quick, 2002; Pourkhabbaz, Rastin, Olbrich, Langenfeld-Heyser, & Polle, 2010).
On the other side, S. molle and F. soatensis showed better stomatal function and lower leaf symptoms severity in the HTA sites than in the control sites. In fact, the leaf area of S. molle increased in avenues. Some studies have found that conidial germ tubes of pathogenic fungus are not able to penetrate easily clogged stomata, and the assimilation of nitrogen increases the synthesis of defense substances such as phenols and tannins (Mcelrone et al., 2005).
The results indicate that phytosanitary condition can be influenced by vehicular pollution, and they are also an important determinant of tree physiology. Chlorophyll a/b ratio, leaf area and specific leaf mass were significantly related to the severity of leaf symptoms, whereas the pest severity was positively correlated to the chlorophyll b content in S. molle. The distance to avenue was positively related to chlorophyll a/b ratio, which means that trees closest to vehicular pollution increase their chlorophyll b content. A similar physiological modulation is found in leaves to shade (Lambers, Chapin III, & Pons, 2008), which confirms that light limitations are associated with vehicular pollution, regardless of accumulation of particulate matter. A direct correlation between pigments and photochemical efficiency supports modulation responses under stress conditions (Joshi & Swami, 2007; Nanos & Ilias, 2007).
Exposure of trees to vehicle pollution led to productivity-related consequences. The reduction in size of fruitsof E. myrtifolia,C. bogotanus, and F. soatensis could be the result of metabolic disruptions. Some authors propose that air pollutant exposure decreases gibberellins, affecting the yields and average life spans of trees (Lambers et al., 2008; Kuang et al., 2012). Further, physiological responses were ontogeny-dependent. In high-traffic sites, seedlings had lower photochemical efficiency, lower total chlorophyll content, and a higher specific leaf mass than in control sites. These results differed widely from trees, where pollution favored the light reactions of photosynthesis. The effects on seedlings growth varied among species, being negative for C. bogotanus, positive for E. myrtifolia, and neutral for S nigra. Previous studies coincide with the affectations on chlorophyll content (Pandey & Agrawal, 1994; Madan & Verma, 2015) and thehigh allocation of biomass to leaves (Searle et al., 2012), but certainly is necessary to deep in research that evaluates the success of planting urban trees, in different stages of growth.
In conclusion, no two species had the same physiological responses to vehicular pollution, and this variability in the tolerance to stress should be exploited in a positive way for better forestry planning in Bogotá. Ficussoatensis improves particle filtration. Croton bogotanus is recommended for planting in high-traffic avenues, although only as saplings, to avoid the negative effects of pollution on seedlings growth. By contrast, fast-growing E. myrtifolia and S. nigra seedlings should only be planted in low-traffic avenues because their pigment contents, leaf area and stomatal conductance are susceptible to pollutants. Finally, because of its persistent high stomatal conductance and low leaf symptoms, S. molle is the best-adapted species to vehicle pollution. Since some pests can affect S. molle, it is recommended its planting in combination with other species. In all cases, the addition of nutrients or treatments with mycorrhizae can improve the allocation of resources and stimulate the offer of fruits for urban fauna (Ramos-Montaño, Posada, Ronderos, & Penagos, 2010).
In the coming years, planning institutions will be challenged to pursue the maximization of ecosystem services in Bogotá. To accomplish this goal, it is necessary: to hold a high diversity associated with urban trees (Jim & Chen, 2007), increase the research on functional ecology (Nowak, 2006) and improve the monitoring and determination of specific pollutants. Despite having an efficient information system on urban forestry, there is no a valuation of the air purification services provided by the urban forest in Bogotá, as there is in other cities in the United States, China and Chile (McDonald et al., 2007; Escobedo et al., 2007; Jim & Chen, 2007). If the negative effects of vehicular pollution cause a substantial reduction in those services or the average life span of trees, then strong policies, including taxes and new technologies, must be implemented.
Declaración de ética: la autora declara que está de acuerdo con esta publicación; que no existe conflicto de interés de ningún tipo; y que ha cumplido con todos los requisitos y procedimientos éticos y legales pertinentes. Todas las fuentes de financiamiento se detallan plena y claramente en la sección de agradecimientos. El respectivo documento legal firmado se encuentra en los archivos de la revista.

