


 English (pdf)
 Article in xml format
 Article references
 Send this article by e-mail
 Cited by SciELO
  Similars in
SciELO
Similars in
SciELO 
 Permalink
Introduction
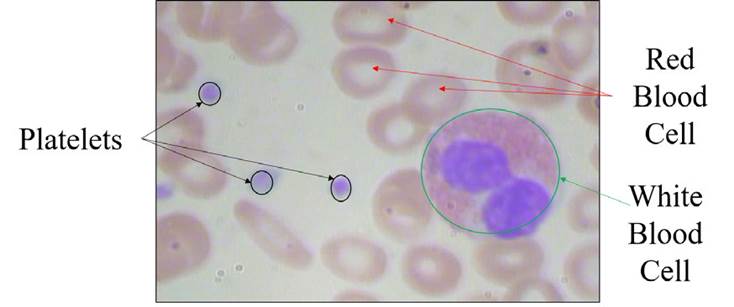
Blood is composed of four major components, namely red blood cells (RBC) or erythrocytes, white blood cells (WBC) or leukocytes, platelets or thrombocytes, and plasma. Plasma is the fluid component of the blood, which includes proteins and dissolved salts. RBCs and platelets are found in the blood in large numbers, while WBCs are only 1% of the total blood cells. About 40-45% of blood cells are RBCs; they play a major role in carrying oxygen to other tissues. WBCs are responsible for the immunity of the body against infections. Platelets aid in clotting the blood and saving from excessive loss of blood.
Counting blood cells is an important parameter analyzed by doctors and medical professionals to check patients’ health. Microscopic blood cell analysis is still used to diagnose multiple diseases such as leishmaniasis, trypanosomiasis, filariasis, and malaria. The number of blood cells is large, and instruments like hemocytometers took longer to count blood cells. These instruments have chances of error and depend on the skills of the pathologist. Hence, it arises from the need for an automated system for blood cells detection and counting of different blood cells. The blood smear image analysis can give more information when training images of different blood cells in neural networks to develop an accurate and robust system.
An image processing-based method to count RBCs is proposed by Acharya & Kumar (2018), where normal and abnormal cells were identified for an input blood smear image. For this purpose, the K-medoids algorithm is used to extract WBCs from a blood smear image, and granulometric-based analysis is performed to separate WBCs and RBCs. Circular Hough Transform and labeling are used to count the number of cells. Another image processing-based RBC counting method is presented where thresholding is done for different pixels of HSV converted images (Cruz et al., 2017). Counting blood cells is done using the connected component labeling. Circular Hough transform (Acharjee et al., 2016), CHT (Sarrafzadeh et al., 2015), SVM, and spectral angle imagining (Lou et al., 2016) are also used to count different blood cells. ResNet and Inception net-based pre-trained models were used to count WBC from the image after segmentation using color space analysis (Habibzadeh et al., 2018). An iterative circle detection algorithm is also used to find RBCs and WBCs (Alomari et al., 2014). Another method has been presented for segmenting and counting RBCs using pulse-coupled neural networks (Ma et al., 2016). Counting cells is based on the average size of RBC, which can create mismatching in some cases. The blood cell counting using different deep learning models is compared on BCCD datasets which achieved the highest mean average precision (mAP) of 74.37% (Alam & Islam, 2019).
The main contribution of this paper is an automatic blood cell detection and counting framework. The dataset of 364 images having 4888 blood cells is labeled and divided into training, validation, and test set. The whole dataset is used to train convolutional neural networks in different batch sizes. The performance of the trained model is analyzed in different parameters. Bounding boxes were made around the detected blood cells. Mean average precision is high. The average precision of WBCs is more than 97% for all models. The counting error is much less for detected blood cells with a detection threshold of 0.9, and WBCs cells give 100% accurate results on counting. The detection time for processing one blood smear image of size 640×480 pixels takes
0.11 seconds. The proposed system can assist pathologists and medical professionals in making decisions based on the predicted output.
Blood Cell Image Dataset
In this study, the blood cell images database was collected from an opensource repository; it is the Blood Cell Count Dataset (BCCD), which has 364 images of blood cells. These images contain 4888 different cells: 4155 RBCs cells, 372 WBCs cells, and 361 platelets (BCCD, 2020). Figure 1 shows RBCs, WBCs, and platelets on an input blood smear image. The deep learning model is trained with 256 images, and the model is validated with 54 blood cell images. Once the model is generated, it is tested with 54 blood cell images having 800 different blood cells, and counting is performed.
Proposed Method
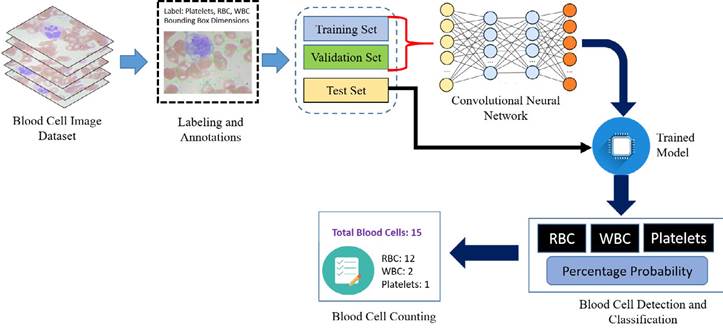
Artificial intelligence is significantly transformed with the arrival of deep learning (LeCun et al., 2015; Krizhevsky et al., 2017). This technology is a part of machine learning that is utilized to solve complex problems with state-of-the-art performance on computer vision and image processing (Alom et al., 2018). Deep learning models have been widely used on medical images, giving high results in detection, segmentation, and classification tasks. Proper annotation and labeling are performed on collected blood cell images by using the “LabelImg” application, which is further divided for training, validation, and test ing set. The dataset images are trained with convolutional neural networks (CNN) to generate a model to perform detection of different blood cells from the test blood cell images and perform the counting of the recognized blood cells. An overview of the proposed work is shown in Figure 2 for the detection and counting of the blood cells.
CNN is named after a mathematical operator known as convolution. In the CNN architecture with multiple numbers of layers stacked on it, the convolution layer extracts features from the input image dataset by applying filters on it. Computational performance is enhanced with a max-pooling layer that reduces the dimensionality of layers. The final layer for performing classification tasks is known as the fully connected layer. CNN consists of these layers, and to perform classification and detection tasks, internal parameters of these layers are adjusted.
Instead of developing a deep learning model from scratch, a more coherent approach is to design the architecture utilizing already established CNN models. Therefore, Darknet-53 architecture is used for this study as a backbone network that increases the speed of object detection from the input image. Darknet-53 has 53 layers trained
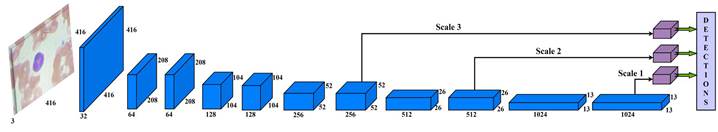
on ImageNet datasets (Krizhevsky et al., 2017). Then, these layers were stacked with 53 more layers of YOLO-v3 algorithm to perform the detection task. The proposed work has a state-of-the-art architecture design for blood cells detection. Figure 3 shows the schematic diagram of the proposed work with processed data.
The input blood cell images are divided into N X N grids. Grid cells are responsible for detecting objects if the centers of the objects lie in those grid cells: they predict bounding boxes and determine the confidence score associated with those boxes. YOLO-v3 calculates bounding boxes on three different scales like features pyramid network (Lin et al., 2017), and these prediction results are more significant for detecting minor-sized blood cell targets. The algorithm was already trained on COCO datasets (Lin et al., 2014) and implemented using pre-trained weights.
The input blood cell images are divided into N X N grids. Grid cells are responsible for detecting objects if the centers of the objects lie in those grid cells: they predict bounding boxes and determine the confidence score associated with those boxes. YOLO-v3 calculates bounding boxes on three different scales like features pyramid network (Lin et al., 2017), and these prediction results are more significant for detecting minor-sized blood cell targets. The algorithm was already trained on COCO datasets (Lin et al., 2014) and implemented using pre-trained weights. Predictions were made on three different scales in the proposed work, as shown in Fig. 3. Thus, an input smear image of 416 x 416 dimension was divided into grids of 13 × 13, 26 × 26, and 52 × 52 for the respective stride values of 32, 16, and 8. The confidence score describes the confidence of the model that the object lies in the box and the accuracy of the box it predicted. Each grid in the input image predicts B bounding boxes with confidence scores and C class conditional probabilities. The confidence score formula is given in equation 1:

where  represents the common value between predicted and reference bounding box and pred(Obj) = 1, if the target is in the grids, otherwise it would be 0.
Experiment and Results
A convolutional neural network needs to be trained and tested to develop a framework for blood cell detection. For this purpose, an Intel Xenon processor with 64 GB RAM and an NVIDIA Quadro P600 graphics processing unit (GPU) with 24 GB graphics memory are used. Image pre-processing, training, and testing are done on Anaconda3 (Python 3.7), and other libraries, such as TensorFlow and OpenCV, required to train the model. The statistics of the number of images in the datasets are given in Table 1.
A dataset from all sources is divided for training, testing, and validation in 70%, 15%, and 15%, respectively. The deep learning model is trained with blood cell images containing 4888 cells for several iterations until the loss becomes saturated. Generated trained models are analyzed with multiple images in test datasets to obtain overall performance. Yolo-v3 based convolutional neural network is trained for 400 epochs with an initial learning rate of 10-3 and IoU of 50%.
The training is done for different batch sizes of 4, 8, and 16 images. Its steps in each epoch are 512, 256, and 128 while training in a batch size of 4, 8, and 16, respectively. Once trained, models are tested with never-seen blood cell smear images. Some of the tested results are shown in Figure 4, where various blood cells are detected with a higher percentage using the proposed framework.
Average precision (AP) is a measure that integrates recall and precision for good results. It splits into 4 kinds to perform a binary classification on the image: true positive TP, false negative FN, true negative TN, and false positive FP, according to the fusion of predicted class and labeled class of the proposed model. Average precision is the mean of the precision scores after every significant document is retrieved. The formula to calculate precision and mean average precision is given in equation 2:


where Q is the number of queries. Table 2 shows the AP value of trained objects.
Table 1 Dataset description.
| Parameters | Original Dataset | Training Set | Validation Set | Test Set |
| Number of Images | 364 | 256 | 54 | 54 |
| Blood Cells | 4888 | 3437 | 651 | 800 |
| RBC | 4155 | 2910 | 552 | 693 |
| WBC | 372 | 263 | 54 | 55 |
| Platelets | 361 | 264 | 45 | 52 |
Note: derived from research.
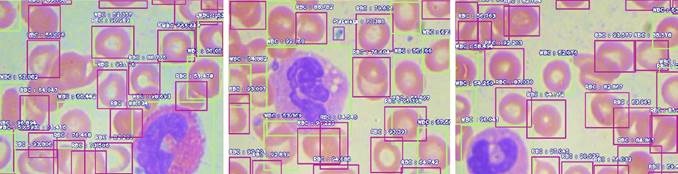
Table 2 Result of maps from different cells.
| Blood Cells | Average Precision (IoU = 0.5) | ||
| Batch Size = 4 | Batch Size = 8 | Batch Size = 16 | |
| RBC | 0.6729 | 0.7133 | 0.7024 |
| WBC | 0.9753 | 0.9933 | 0.9919 |
| Platelets | 0.8164 | 0.8504 | 0.8662 |
| Mean Average Precision | 0.8215 | 0.8523 | 0.8535 |
Note: derived from research.
Different batches achieve the highest accuracy for different cells. Batch size 8 gives the highest AP for WBC and RBC. Instead, batch 16 returns the highest AP for platelets and the highest mAP value that is 85.35% on 0.5 IoU. The performance of the deep learning model depends on the detection and counting of different cells from the input blood cell image. The statistical analysis is done to count different blood cells where the counting of RBC, WBC, and platelets is compared with the ground truth value of different samples. For WBC counting with all three trained CNN models, accurate results reached 100%. The counting range for RBC is -6 to 7 for different batches. Table 3 shows the counting error (CE) for different blood cells in various error ranges; it also displays most test images that gave zero errors.
The performance of model trains in a batch size of 16 gives the best result with the least counting errors and the highest mAP value with 85.35% higher than the models used in (Alam & Islam, 2019).
The computation time to process the image frames having dimensions of 640×480 pixels is 0.111 seconds, and about 9 frames can be processed per second using the NVIDIA Quadro P600 GPU. Blood cell detection and counting can be done fast and accurately.
The YOLO-v3 detects the blood cells in three different scales. The system can work in real time and give accurate outputs, especially WBCs. This system can help pathologists and medical professionals with rapid analysis to provide recommendations and consultation to patients based on the generated report.
Conclusion
This paper proposes the robust and fast detection and counting of different blood cells. The images of different blood cells with respective labels are provided to train the deep learning model with multiple parameters. The trained model is analyzed on different parameters. The results show high accuracy while detecting and counting the blood cells.
Table 3 Counting errors using different trained models.
| Parameters | Batch Size = 4 | Batch Size = 8 | Batch Size = 16 | ||||||
|---|---|---|---|---|---|---|---|---|---|
| RBC | WBC | Plat. | RBC | WBC | Plat. | RBC | WBC | Plat. | |
| Range | -10 to 5 | 0 | -1 to 1 | -6 to 6 | 0 | -1 to 2 | -6 to 7 | 0 | -1 to 2 |
| CE = 0 | 7 | 54 | 38 | 7 | 54 | 40 | 10 | 54 | 36 |
| 0 < CE ≤ ± 1 | 11 | 0 | 16 | 17 | 0 | 12 | 13 | 0 | 17 |
| 0 < CE ≤ ± 2 | 23 | 0 | 16 | 23 | 0 | 14 | 27 | 0 | 18 |
| CE > ± 2 | 24 | 0 | 0 | 24 | 0 | 0 | 17 | 0 | 0 |
Note: derived from research.
The proposed framework can scan the image in three different scales, making it easy to detect the small-sized blood cells in an input image frame. Average precision ranges from 0.70 to 0.991 with a mean average precision value of 0.8535. The input images frames were processed very fast; the resulting count of different cells can be utilized by doctors to find disorders based on that report. The complete framework is automatic, and multiple images frames can be processed subsequently to generate the report. The proposed automated framework is significantly more accurate and faster than the traditional methods used by pathologists.
Author contribution statement
All the authors declare that the final version of this paper was read and approved. Total contribution by the authors towards conceptualization, preparation, drafting, and editing of this article is as follows: R.C.J. 25%, S.Y. 25%, M.K.D. 25%, and C.M.T.G. 25%.
Data Availability Statement
Data sharing is not applicable since no new data was created or analyzed in this study. The data supporting the results of this study will be made available by the corresponding author, M. K. Dutta, upon reasonable request.
Ver anexo
