


 English (pdf)
 Article in xml format
 Article references
 Send this article by e-mail
 Cited by SciELO
  Similars in
SciELO
Similars in
SciELO 
 Permalink
Introduction
The University of Costa Rica (UCR) is one of the five public universities in Costa Rica, and it is the only one that offers a dentistry degree. The requi- rements for admission to the UCR are Bachelor's Degree in Secondary Education, or its equivalent, recognized and equated by the Superior Council of Education when the student comes from a high school or a secondary education center abroad. In addition, to apply, the Academic Aptitude Test (AAT) must be passed, and from 2007 to 2015 another specific aptitude test had to be carried out by the School of Dentistry (1).
The applicant who competes for the first time must obtain the established admission average to enter the university. This grade results from the linear combination of the result obtained in the AAT and the average of the grades in the subjects of high school or a secondary education previously defined by the UCR, or its equivalent in the case of foreign schools. Each of these components has a weight of 50% (2). The admission average is standardized on a scale of 200 to 800 and is established as a basic requirement to enter the UCR, which is in the range of 442 to 800 (3).
Applicants can request two career options in the admission process, in which the career is assigned through an algorithm based on the average obtained in the process. If an applicant requests as a first option a career that achieves the maximum quota established by the Academic Unit with people with higher admission grades, the second option is assigned if there is space available (3). If a student has previously been admitted to a UCR career, but wants to opt for a transfer to another, they have the option of doing so by admission grade, academic performance, or academic excellence, where the maximum quota for this process it is less than the quotas for those who apply for the first time, and it is also establis- hed by the Academic Units.
Due to these characteristics of the admission process, the student population that enters the Dentistry career is heterogeneous, so knowing the profile of the students that enter can allow the design and implementation of policies that guarantee comprehensive training (4,5). In this aspect, knowledge of the sociodemographic environment of students is fundamental when planning interventions that improve the processes of transition and adaptation to higher education, which will favor the permanence of students and academic success (6).
Currently, there is no evidence on studies that establish the admission profile of the students of the Faculty of Dentistry at the UCR, so the objective of this study was to determine the socio-demographic and academic characteristics of the students who entered the career of Dentistry in the period 2007 to 2014 and establish whether there is a difference between the income grades according to the sociodemographic variables studied.
Methodology
Participants
This research is a descriptive, retrospective, and cross-sectional study with a conclusive quantitative character that is part of the first stage of a research on "Terminal efficiency, lag and dropout in the cohorts of students who entered the Dentistry career of the University of Costa Rica in the years 2007 to 2014". The study population is the 778 records of the students who obtained their admission to the Dentistry career of the UCR from 2007 to 2014. The exclusion criterion was file with incomplete information.
Data collection
The sociodemographic and academic varia- bles correspond to data on the first day of admission to the UCR. From the Student Applications System (SAE) the following variables were obtained: sex (male or female), age of entry (age in completed years), nationality (Costa Rican or foreign), place of origin (within the Greater Metropolitan Area (GMA) or outside the GMA), school of origin (public, private, subsidized by maturity or school abroad) and admission exam grade. Data from the Civil Registry was obtained from the digital documents of the Supreme Electoral Tribunal of Costa Rica (7), such as marital status (single or married) and having children (yes or no).
Statistic analysis
The data was entered into an Excel database (Microsoft, Inc., Redmond, WA, USA), reviewed, and corrected for inconsistencies to be analyzed. Descriptive statistics were performed, establishing the absolute and relative frequency of the varia- bles, as well as measures of central tendency and variability. The Kolmogorov-Smirnova test was performed to evaluate the normality function, which was not present, so the Mann-Whitney test was used to determine if there were statistically significant differences between the admission test and the categories evaluated (p<0.05, 95% CI). All analyzes were performed using SPSS version 23.0 (SPSS Inc., Chicago, IL, USA).
Results
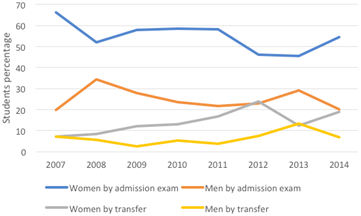
The complete data of 673 students of the total of 778 files were obtained, the above because in the SAE subjects cannot be in two conditions: people who obtain the note to enter the career, but do not consolidate their enrollment or students who are pursuing a postgraduate degree in the UCR. Most of the subjects correspond to the female sex, with a total of 462 (68.4%). In 2010, the largest number of women entered (71.3%), and in 2013 the lowest (58.9%) (Figure 1).
The general mean admission age was 18.4 years (SD=2.41). When performing the analysis of age according to admission modality, there was a statistically significant difference (p=0.001), since the average age of the students who entered through the admission exam was 17.9 years (SD=1.56), while the students who were admit- ted through transfers had an average age of 20.1 years (SD=3.38). In all the years analyzed, the minimum age was lower in students who entered through an admission exam (Table 1).
Concerning to nationality, 99.0% of all students were Costa Ricans, there were 7 foreign students who entered through an admission exam, 6 women and 1 man.
Regarding marital status, 99.3% of all students were single; only 4 women (3 who were admitted by admission exam and 1 by transfer) and 1 man who was admitted by transfer were married. 99.1% of the subjects did not have children, only 4 females who entered through an admission exam, and another 2 women who did so due to transfer had children at the time of starting the degree.
According to the admission method, the largest number of students entered by admission exam (78.9%): the year 2010 was the one with the highest number of admissions (77 subjects) while the year 2007 was the year with the lowest number of students entered by admission exam (61 subjects). On the other hand, if the students admitted by transfer are considered, the year 2012 was when more students entered (29 subjects) while in the years 2007 and 2008 it was when the fewest number of students (10 subjects) (Table 2).
Considering the school of origin, 50.7% of the students studied at a public high school followed by a private school with 32.3%. In 2012 it was when more public high school students entered (58 subjects) while in 2008 only 35 subjects were admitted. The subsidized high schools in all cohorts contributed 16.0% of students, the 2009 cohort was the year where more students entered (27 subjects) (Table 2).
Table 1 Admission age in years according to the admission method.
| Admission method | - | - | - | - | - | - | - | - | - |
|---|---|---|---|---|---|---|---|---|---|
| - | Admission exam | - | - | - | Transfer | - | - | - | - |
| - | Average age | DS | Minimum age | Maximum age | Average age | DS | Minimum age | Maximum age | p |
| 2007 | 17.52 | 0.65 | 16 | 19 | 19.30 | 2.21 | 18 | 25 | 0.001 |
| 2008 | 17.98 | 1.34 | 17 | 23 | 19.10 | 0.99 | 18 | 21 | 0.001 |
| 2009 | 17.83 | 1.46 | 16 | 27 | 19.25 | 1.36 | 16 | 21 | 0.001 |
| 2010 | 18.11 | 1.79 | 17 | 29 | 19.80 | 2.26 | 17 | 27 | 0.001 |
| 2011 | 17.90 | 1.28 | 16 | 25 | 20.06 | 4.43 | 18 | 36 | 0.001 |
| 2012 | 18.08 | 1.07 | 17 | 21 | 19.86 | 1.57 | 18 | 23 | 0.001 |
| 2013 | 18.30 | 2.46 | 15 | 33 | 20.91 | 3.72 | 18 | 33 | 0.001 |
| 2014 | 18.09 | 1.54 | 17 | 25 | 20.83 | 5.77 | 18 | 46 | 0.001 |
Table 2 Distribution according to sex and high school of origin.
| Admission method | - | - | - | - | - | - | - |
|---|---|---|---|---|---|---|---|
| - | Admission exam | - | - | Transfer | - | - | Total sample n (%) |
| - | Male n (%) | Female n (%) | Total n (%) | Male n (%) | Female n (%) | Total n (%) | - |
| 2007 | - | - | - | - | - | - | - |
| Public | 11 (78.6) | 21 (44.7) | 32 (52.4) | 1 (20.0) | 3 (60.0) | 4 (44.4) | 36 (5,3) |
| Private | 2 (14.3) | 18 (38.3) | 20 (32.8) | 4 (80.0) | 2 (40.0) | 6 (66.6) | 26 (3,9) |
| Subsidized | 1 (7.1) | 8 (17.0) | 9 (14.8) | 0 (0) | 0 (0) | 0 (0) | 9 (1,3) |
| By maturity | 0 (0) | 0 (0) | 0 (0) | 0 (0) | 0 (0) | 0 (0) | 0 (0) |
| From abroad | 0 (0) | 0 (0) | 0 (0) | 0 (0) | 0 (0) | 0(0) | 0 (0) |
| Total | 14 (100) | 47 (100) | 61 (100) | 5 (100) | 5 (100) | 10 (100) | 71 (10,5) |
| 2008 | - | - | - | - | - | - | - |
| Public | 12 (48.0) | 16 (42.1) | 28 (44.4) | 2 (50.0) | 5 (83.3) | 7 (70.0) | 35 (5,2) |
| Private | 8 (32.0) | 12 (31.6) | 20 (31.8) | 1 (25.0) | 1 (16.7) | 2 (20.0) | 22 (3,3) |
| Subsidized | 5 (20.0) | 10 (26.3) | 15 (23.8) | 1 (25.0) | 0 (0) | 1 (10.0) | 16 (2,4) |
| By maturity | 0 (0) | 0 (0) | 0 (0) | 0 (0) | 0 (0) | 0 (0) | 0 (0) |
| From abroad | 0 (0) | 0 (0) | 0 (0) | 0 (0) | 0 (0) | 0(0) | 0 (0) |
| Total | 25 (100) | 38 (100) | 63 (100) | 4 (0) | 6 (100) | 10 (100) | 73 (10,8) |
| 2009 | - | - | - | - | - | - | - |
| Public | 12 (52.2) | 14 (29.2) | 26 (36.6) | 1 (50.0) | 9 (90.0) | 10 (83.3) | 36 (5,3) |
| Private | 7 (30.4) | 18 (37.5) | 25 (35.2) | 1 (50.0) | 1 (10.0) | 2 (16.7) | 27 (4,0) |
| Subsidized | 4 (17.4) | 16 (33.3) | 20 (28.2) | 0 (0) | 0 (0) | 0 (0) | 20 (3,0) |
| By maturity | 0 (0) | 0 (0) | 0 (0) | 0 (0) | 0 (0) | 0 (0) | 0 (0) |
| From abroad | 0 (0) | 0 (0) | 0 (0) | 0 (0) | 0 (0) | 0(0) | 0 (0) |
| Total | 23 (100) | 48 (100) | 71 (100) | 2 (100) | 10 (100) | 12 (100) | 83 (12,3) |
| 2010 | - | - | - | - | - | - | - |
| Public | 9 (40.9) | 32 (58.2) | 41 (53.2) | 2 (40.0) | 9 (75.0) | 11 (64.7) | 52 (7,7) |
| Private | 8 (36.4) | 15 (27.3) | 23 (29,9) | 2 (40.0) | 2 (25.0) | 4 (23.5) | 27 (4,0) |
| Subsidized | 5 (22.7) | 8 (14.5) | 13 (16.9) | 1 (10.0) | 1 (0) | 2 (11.8) | 15 (2,2) |
| By maturity | 0 (0) | 0 (0) | 0 (0) | 0 (0) | 0 (0) | 0 (0) | 0 (0) |
| From abroad | 0 (0) | 0 (0) | 0 (0) | 0 (0) | 0 (0) | 0 (0) | 0 (0) |
| Total | 22(100) | 55 (100) | 77 (100) | 5 (100) | 12 (100) | 17 (100) | 94 (14,0) |
| 2011 | - | - | - | - | - | - | - |
| Public | 8 (47.1) | 23 (50) | 31 (49.2) | 0 (0) | 7 (53.8) | 7 (43.7) | 38 (5,6) |
| Private | 7 (41.2) | 14 (30.4) | 21 (33.3) | 1 (33.3) | 3 (23.1) | 4 (25.0) | 25 (3,7) |
| Subsidized | 2 (11.7) | 9 (19.6) | 11 (17.5) | 2 (66.7) | 3 (23.1) | 5 (31.3) | 16 (2,49 |
| By maturity | 0 (0) | 0 (0) | 0 (0) | 0 (0) | 0 (0) | 0(0) | 0 (0) |
| From abroad | 0 (0) | 0 (0) | 0 (0) | 0 (0) | 0 (0) | 0(0) | 0 (0) |
| Total | 17 (100) | 46 (100) | 63 (100) | 3 (100) | 13 (100) | 16 (100) | 79 (11,7) |
| 2012 | - | - | - | - | - | - | - |
| Public | 15 (71.4) | 23 (53.5) | 38 (59.4) | 2 (28.6) | 18 (81.8) | 20 (69.0) | 58 (8,6) |
| Private | 5 (23.8) | 12 (27.9) | 17 (26.5) | 5 (71.4) | 4 (18.2) | 9 (31.0) | 26 (3,9) |
| Subsidized | 1 (4.8) | 8 (18.6) | 9 (14.1) | 0 (0) | 0 (0) | 0 (0) | 9 (1,3) |
| By maturity | 0 (0) | 0 (0) | 0 (0) | 0 (0) | 0 (0) | 0 (0) | 0 (0) |
| From abroad | 0 (0) | 0 (0) | 0 (0) | 0 (0) | 0 (0) | 0 (0) | 0 (0) |
| Total | 21 (100) | 43 (100) | 64 (100) | 7 (100) | 22 (100) | 29 (100) | 93 (13,8) |
| 2013 | - | - | - | - | - | - | - |
| Public | 12 (46.2) | 13 (31.7) | 25 (37.3) | 8 (66.7) | 8 (72.7) | 16 (69.6) | 41 (7,0) |
| Private | 10 (38.5) | 21 (51.3) | 31 (46.3) | 4 (33.3) | 2 (18.2) | 6 (26.1) | 37 (5,5) |
| Subsidized | 3 (11.5) | 6 (14.6) | 9 (13.4) | 0 (0) | 1 (9.1) | 1 (4.3) | 10 (1,5) |
| By maturity | 0 (0) | 0 (0) | 0 (0) | 0 (0) | 0 (0) | 0 (0) | 0 (0) |
| From abroad | 1 (3.8) | 1 (2.4) | 2 (3.0) | 0 (0) | 0 (0) | 0 (0) | 2 (0,3) |
| Total | 26 (100) | 41 (100) | 67 (100) | 12 (100) | 11 (100) | 23 (100) | 90 (13,4) |
| 2014 | - | - | - | - | - | - | - |
| Public | 8 (44.4) | 23 (46.9) | 31 (46.3) | 6 (100) | 10 (58.8) | 16 (69.6) | 47 (7,0) |
| Private | 7 (38.9) | 16 (32.7) | 23 (34.3) | 0 (0) | 5 (29.4) | 5 (21.7) | 28 (4,2) |
| Subsidized | 2 (11.1) | 8 (16.3) | 10 (14.9) | 0 (0) | 1 (5.9) | 1 (4.3) | 11 (1,6) |
| By maturity | 1 (5.6) | 1 (2.0) | 2 (3.0) | 0 (0) | 1 (5.9) | 1 (4.3) | 3 (0,4) |
| From abroad | 0 (0) | 1 (2.0) | 1 (1.5) | 0 (0) | 0 (0) | 0 (0) | 1 (0,1) |
| Total | 18 (100) | 49 (100) | 67 (100) | 6 (100) | 17 (100) | 23 (100) | 90 (13,4) |
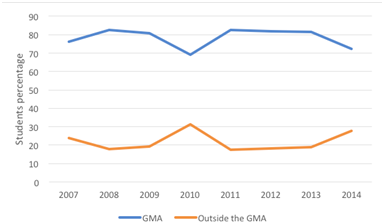
A total of 528 (77.9%) students had their residence in the GMA. The year 2010 was when the smallest difference appeared: 68.7% belonged to the GMA while 31.3% lived outside the GMA (Figure 2).
The average admission grade during the period studied was 613.8 (SD=49.95). If analyzed according to the place of residence, the students from the GMA were 615.2 (SD=50.13), while the subjects with residence outside the GMA had an average of 608.9 (SD=49.19). There was no statistically significant difference regarding the admission exam grade and residence or sex, however, there was a difference between the grade of the admission exam between students from public and private schools (Table 3).
Table 3 Association between sex, address, high school of origin, and the admission exam grade.
| - | Average | DS | IC 95% | - | - |
|---|---|---|---|---|---|
| Sex | - | - | - | - | 0.140 |
| Male | 617.13 | 49.62 | 610.47 | 623.78 | - |
| Female | 612.21 | 50.09 | 607.63 | 616.79 | - |
| Domicile | - | - | - | - | 0.298 |
| GMA | 617.17 | 50.13 | 610.89 | 619.46 | - |
| Outside the GMA | 608.87 | 49.19 | 600.94 | 616.81 | - |
| School | - | - | - | - | 0.011 |
| Public | 609.0ª | 47.29 | 603.8 | 614.2 | - |
| Subsidized | 619.2ªᵇ | 52.37 | 608.9 | 629.4 | - |
Values with the different superscript letters indicate significant differences (p‹.05).
Discussion
This research establishes for the first time the profile of admission of several years of students to the Faculty of Dentistry, where there is evidence of a predominance of female students. This situation has already been mentioned in some research at the university level where a slight inclination towards the female sex has been reported, ranging between 53-55% (8,9,10), however, in health careers, the percentage is higher specifically in dentistry, several investigations have reported that the proportion of women is around 70.0% (11,12,13). This high choice of women for careers in the health area has been associated with the fact that they are professions that are characterized by the care and well-being of other people and allow them to continue fulfilling domestic and child- rearing tasks (11,14). In Costa Rica, the offer of these careers has been increasing over the years and women consider that they have the aptitudes and intellectual capacities necessary to succeed in such demanding careers from an academic point of view, as well as that the labor market allows working in an independent profession, with expectations of high economic income (15).
The age of entry has been considered a significant factor to remain in the University, those who do it with 20 years or less have a higher survi val rate (16). In this study, there was a statistically significant difference in the average age according to the admission method, the students who entered by admission exam were younger than those who did it by transfer. The foregoing is since in Costa Rica, most high school students take the entrance exam to the University as soon as they finish their secondary education studies, while the subjects who enter the Faculty of Dentistry by transferring from another career have already been at least one year enrolled in the University, so it is expected that they are older.
With regard to the nationality of the students, the results of this study indicate that the majority are Costa Ricans, a situation that is a little different from what was reflected in the X National Population Census and VI Housing 2011 (17) where it is reported that the foreign-born population represents 9% of the total population of the country, the above could be due to the fact that born outside of costa Rica and who not been nationalized are considered foreigners. At the level of South America, the presence of foreigners in universities is also low: in research carried out at the University of Zulia in Venezuela only 3.4% of the students were foreigners (18), similarly, another study carried out in Colombia indicates that 100% of the students were Colombian (9).
Concerning marital status, almost all the students were single, a percentage that is similar to that of single students who participated in a study conducted in 2021 with first-year dentistry students from the Universidad Santo Tomás de Bucaramanga (12). However, the high predominance of single students was not so noticeable in research conducted at the Autonomous University of Mexico where it was reported that 87.5% of first-time students were single (10). Marital status has been considered a variable that can influence educational indicators. An investigation carried out at the Faculty of Natural and Exact Sciences of the Universidad de Playa Ancha Chile identified that the change in the marital status of a student, which goes from single to married can increase the chances of dropping out (19). Being a single student is an aspect that allows greater dedication to study, as they do not have responsibilities such as those required by establishing a family (15).
A variable that is not frequently included in studies is maternity or paternity status; in this research only six women had this condition, a very low percentage compared to what was reported by the National Institute of Statistics and Censuses for 2011 where 2.34% of women under 19 years of age were mothers (20). In contrast also to the results obtained, two investigations carried out in Colombia indicate that the presence of university students with children was between 37.0% and 18.1% (9,10). Motherhood is an important factor to consider since it has been cited as one of the factors that can influence student dropout, students with children may present problems regarding regular attendance at university classrooms (21,22,23).
Regarding the admission method to the UCR, each year the Vice Rectory for Teaching of the UCR issues a resolution regarding the rules and procedures for students who participate in the contest of transfer or admission to campus and undergraduate career and degree of the RCU (24). This resolution establishes the modalities of the contest for admission to the degree (by admission grade and by transfer, either for academic excellence or for academic performance) and the maximum admission capacity. During the years 2007 to 2014, the defined quota for admission by admission exam was 76-77 students and by transfer it varied between a minimum of 12 in the year 2007 and a maximum of 32 in the year 2012. Since there are established quotas, it is expected that the number of students who enter through an admission exam will be greater than that established for students who enter through a transfer from other careers.
Regarding the grade of the admission exam in Dentistry, the average grade in the years of study was 617.1 for the male sex and 612.2 for the female sex; no records of average admission grades for other careers at the UCR were found. However, when consulting the historical courts by the modalities of Admission of the Office of Registration and Information of the UCR, the degree in Dentistry had its minimum in 547.29 in 2009 and its maximum in 667.43 in 2010. It is striking that, during the study period, as happened in Dentistry, in 2009, the Bachelor of Medicine and Surgery as well as the Bachelor of Microbiology and Clinical Chemistry obtained the lowest cuts: 687.77 and 642.93 respectively, being the two careers with the highest entry grade (25).
In relation to the domicile of university students, the majority of UCR Dentistry students come from the GMA (main urban agglomeration of Costa Rica, includes areas of high population density that surround the capital, and in which the Faculty of Dentistry is located), which coincides with the data from the 2011 Census where it is indicated that Costa Rica has gone from being a country with a predominantly rural population to having an urban population that exceeds 72% and even more, this urban population is concentrated in the GMA slightly exceeding 50% (26). This high percentage of students residing in urban areas also coincides with the Fourth Report on the State of Education in costa Rica in 2013, where it is repor ted that 88.4% of the population at the university level was fundamentally urban (27). Similarly, a research carried out at the same UCR with students of the Library Science career indicated that 83.0% of the students come from the urban area and at the Central American level, a study carried out in El Salvador in six Higher Education Institutions indicates that only 33.0% of the students come from rural areas (28,29). The residence of the students is a variable that deserves consideration, in research carried out at the National University of Luján in Argentina it was shown that the dropout rate was lower for students who lived in the same city where the University was located than in those who resided in cities that were located at a greater distance from the educational campus (30). Another study carried out in the general mathematics course (one of the first at the university level for students from different careers at UCR) obtained as a result that students from outside the GMA presented a lower percentage of approval and a higher percentage of failure if compared with those who come from the GMA (31).
According to the school of origin, half of the students of all cohorts come from public schools, this is far from what is reported in the Reports on the State of Education in Costa Rica, since in the third report of 2011 and in the fifth report of 2015, it is mentioned that of the total number of new admissions in the four public universities at the time, 79% and 75%, respectively, corres- pond to students who completed their studies in a public school (32,33). At an international level, the results of the different investigations on the type of school from which dental students come are diverse: in the Faculty of Dentistry of the University of the Republic in Montevideo the percentage of students from public schools was 70.0%, while in the University of Concepción Chile it was 24.5% and in the Santo Tomás University of Bucaramanga it was 44.9% (11,12,34). It is important to mention that the results show that students from private high schools had higher scores in the admission exam, this relationship was also established in a descriptive study of the academic aptitude test of the Technological Institute of Costa Rica where the results showed that students from private high schools and semi-public had an advantage in the math and verbal components compared to subjects from public high schools (35). This trend reflects a certain change in the results of the UCR admission exam in 2022 since 5 of the 10 best averages belong to students from public high schools (36).
Characterizing the population of the first admission in a university career is of great importance to be able to adapt teaching strategies and resources tending to improve the possibilities of adaptation of the students to the university environment and prevent situations of lag or abandonment of studies, for which one of the strengths of this research is that it is the first time that the admission profile of dental students is determined, which will allow the generation of strategies that contribute to meeting the needs of the student body. However, one of the limitations was that the SAE system does not contain information on the socioeconomic level of the students, the educational level of the parents, nor does it keep track of the subjects who work while they study, important factors to consider since they can influence the educational indicators namely terminal efficiency, backwardness, and university desertion. It is due to the above, that in the future it is planned to carry out an investigation that covers the variables not contemplated in this study. Another limitation was that very few articles were found referring to the profile of entry in the different careers of the UCR to be able to conclude if the population of dentistry is similar to the population of other careers.
Conclusion
This research shows that the group of students who enter to train as Dentists at the University of Costa Rica has an average age of entry of 18.4 years, predominantly female, Costa Rican, single, without children, coming from geographical areas within the GMA, graduates of public schools and with an average admission exam grade of 612.2.
Author contribution statement
Conceptualization and design: C.C.S., A.G.F. and N.G.M.
Literature review: C.C.S., A.G.F., N.G.M. and A.L.S.
Methodology and validation: C.C.S., A.G.F. and N.G.M.
Formal analysis: C.C.S., A.G.F. and N.G.M.
Investigation and data collection: C.C.S., A.G.F. and N.G.M.
Resources: C.C.S., A.G.F. and N.G.M.
Data analysis and interpretation: C.C.S., A.G.F., N.G.M. and A.L.S.
Writing original draft: C.C.S., A.G.F., N.G.M. and A.L.S.
Writing review and editing: C.C.S., A.G.F., N.G.M. and A.L.S.
Supervision: C.C.S., A.G.F. and N.G.M.
Project administration: C.C.S., A.G.F. and N.G.M.
Funding acquisition: Not applicable for this study.

