


 English (pdf)
 Article in xml format
 Article references
 Send this article by e-mail
 Cited by SciELO
  Similars in
SciELO
Similars in
SciELO 
 Permalink
1. Introduction
Pedestrians are the most vulnerable road users and important victims in road safety. According to the WHO Global status report on road safety 2018, about 26 % of all road casualties are pedestrians (1). Furthermore, the percentage of pedestrian traffic deaths in Costa Rica was about 17 % between January 2021 and February 2022, down from about 25 % in 2012 (2).
Even though signalized crossings offer protection to pedestrians, most pedestrian crashes occur at those facilities. For example, in Tokyo, a 60 % of pedestrian crashes occurred at signalized crossings (3) and in China more than 50% (4). This is expected since these crossings concentrate significant pedestrian and traffic volume which increases the chance of conflicts. However, this does not mean these numbers cannot be reduced by improving signalized pedestrian crossings.
Previous studies have reported that red-light violation by pedestrians (i.e. pedestrians crossing the road illegally) is one of the main causes for pedestrian crashes at intersection areas (5), (6) and (7). Furthermore, King et al. (8) found that pedestrian illegal crossing was involved in over 58 % of police-reported crashes at intersections in Queensland, Australia from 1996 to 2006 increasing the relative crash risk 8 times.
Several studies have analyzed pedestrian illegal crossings in countries like Germany (6), United States (9), Turkey (10), India (11), and China (7). However, it is well known that the behavior of pedestrians is influenced by several factors including environment, traffic, personal and social characteristics (12). Therefore, it is important to study pedestrian behavior at signalized crossings in different regions and under different social environments; however, as far as the authors know, there are not examples of such a study in Latin-American countries.
The purpose of this paper is to add to the growing body of literature on pedestrian behavior by modeling pedestrian illegal crossing at signalized mid-block crossings in Costa Rica, using logit models to evaluate different human and road factors. This paper is organized as follows: first the most relevant literature is reviewed, then the data and methodology are presented, next the main results of the research are discussed and finally the main conclusions and recommendations for future research are outlined.
2. Literature Review
Several studies have analyzed the variables affecting the decision process that encourage pedestrians to violate the crossing signal. Illegal crossing decisions could be influenced by several elements such as trip purpose or time of the day, as found by Zhang et al. (7). The authors also found that some pedestrian attitudes such as the individual perception of defects on the road or his or her urgency to cross, could affect pedestrian behavior at the intersection. Vehicular volume affects decision making as well. For example, Onelcin and Alver (10) found that vehicle speed is the most determinant variable in gap perception and crossing time. Lipovac et al. (13) observed that the increase in traffic volume decreased the number of pedestrian offenders. Similarly, Dommes et al. (14) noted that higher traffic density appears to influence the way pedestrians look toward the scene before and while crossing, but it may also have contradictory effects; if waiting time increases, it may encourage pedestrians to violate the crossing light. However, opportunities to cross between the traffic are rare, which can reduce the number of violations.
Characteristics in the surrounding environment and infrastructure also influence pedestrian behavior. Onelcin and Alver (10) showed a statistically significant smaller number of offenders at pedestrian crossings with countdown display than at pedestrian crossings without the countdown display. The authors also found that there was a statistically significant larger number of pedestrian offenders at a signalized pedestrian crossing with the countdown display than a pedestrian crossing without a countdown display during the red light’s 44–40 seconds interval. Furthermore, Lipovac et al. (13) determined that the length of the pedestrian red light influences the distribution of offences, which is consistent with the results from Koh et al. (15), who found that a person is more likely to violate the traffic signal when the crossing length decreases. Brosseau et al. (16) suggested that the presence of a pedestrian signal of any type significantly decreases the probability of dangerous crossings and violations. They also found that a 10 % increase in waiting time before light changes is associated with increases in the probability of violation (no risk) and dangerous violation (risk related) in 7.9 % and 2.1 %, respectively. De Lavalette et al. (17) suggested that the environment has to be interpreted in terms of its physical characteristics (topographical features, infrastructure and control system) but also within the context of the pedestrians’ primary task (i.e. going to school, going to work, leisure). Cinnamon et al. (18) observed that the presence of a travel generator such as public transit hub, commercial and residential areas, schools, and others, could encourage a pedestrian to commit a violation.
The effect that pedestrian individual characteristics have in the probability of illegal crossing has been studied in several papers. Zhang et al. (7) did not find statistical significance for variables such as gender, age, education, living, or income. On the other hand, Lipovac et al. (13) found significant differences in the pedestrians’ behavior at different age groups. Pedestrians between 18-40 years of age violated the red light more often than other ages. Furthermore, Koh et al. (15) observed that male groups are more likely to violate the red light than female pedestrian groups who have higher compliance to the red light according to Dommes et al. (14). According to Brosseau et al. (16) pedestrian behavior differs when pedestrians walk in groups. Group size and pedestrian flow decrease the probability of violations being committed; reducing either variable by 10 % separately will decrease the probability of violations by a maximum of 0.9 % and 0.6 %, respectively. Also, Koh et al.(15) observed that a person was found to be 246 % less likely to violate the pedestrian light if he or she was with a companion compared to when he or she was alone.
Ren et al. (4) analyzed pedestrian rate of compliance in terms of signalization and conditions while crossing the street. They found that male pedestrians are more observant to traffic regulations when crossing, elderly pedestrians are found to be the most abiding group but young pedestrians are more likely to obey traffic law than middle-aged, and pedestrians in group tend to cross on red more often than individual or paired pedestrians. The compliance rate was found lower when the crosswalk was short. It also increases as the green light time increases or pedestrians’ volume increases. Finally, they found the main reason for crossing violations is ''to save time and for convenience'' while a small percentage of results attribute the violations to an unreasonable configuration of pedestrian facilities.
3. Data and Methods
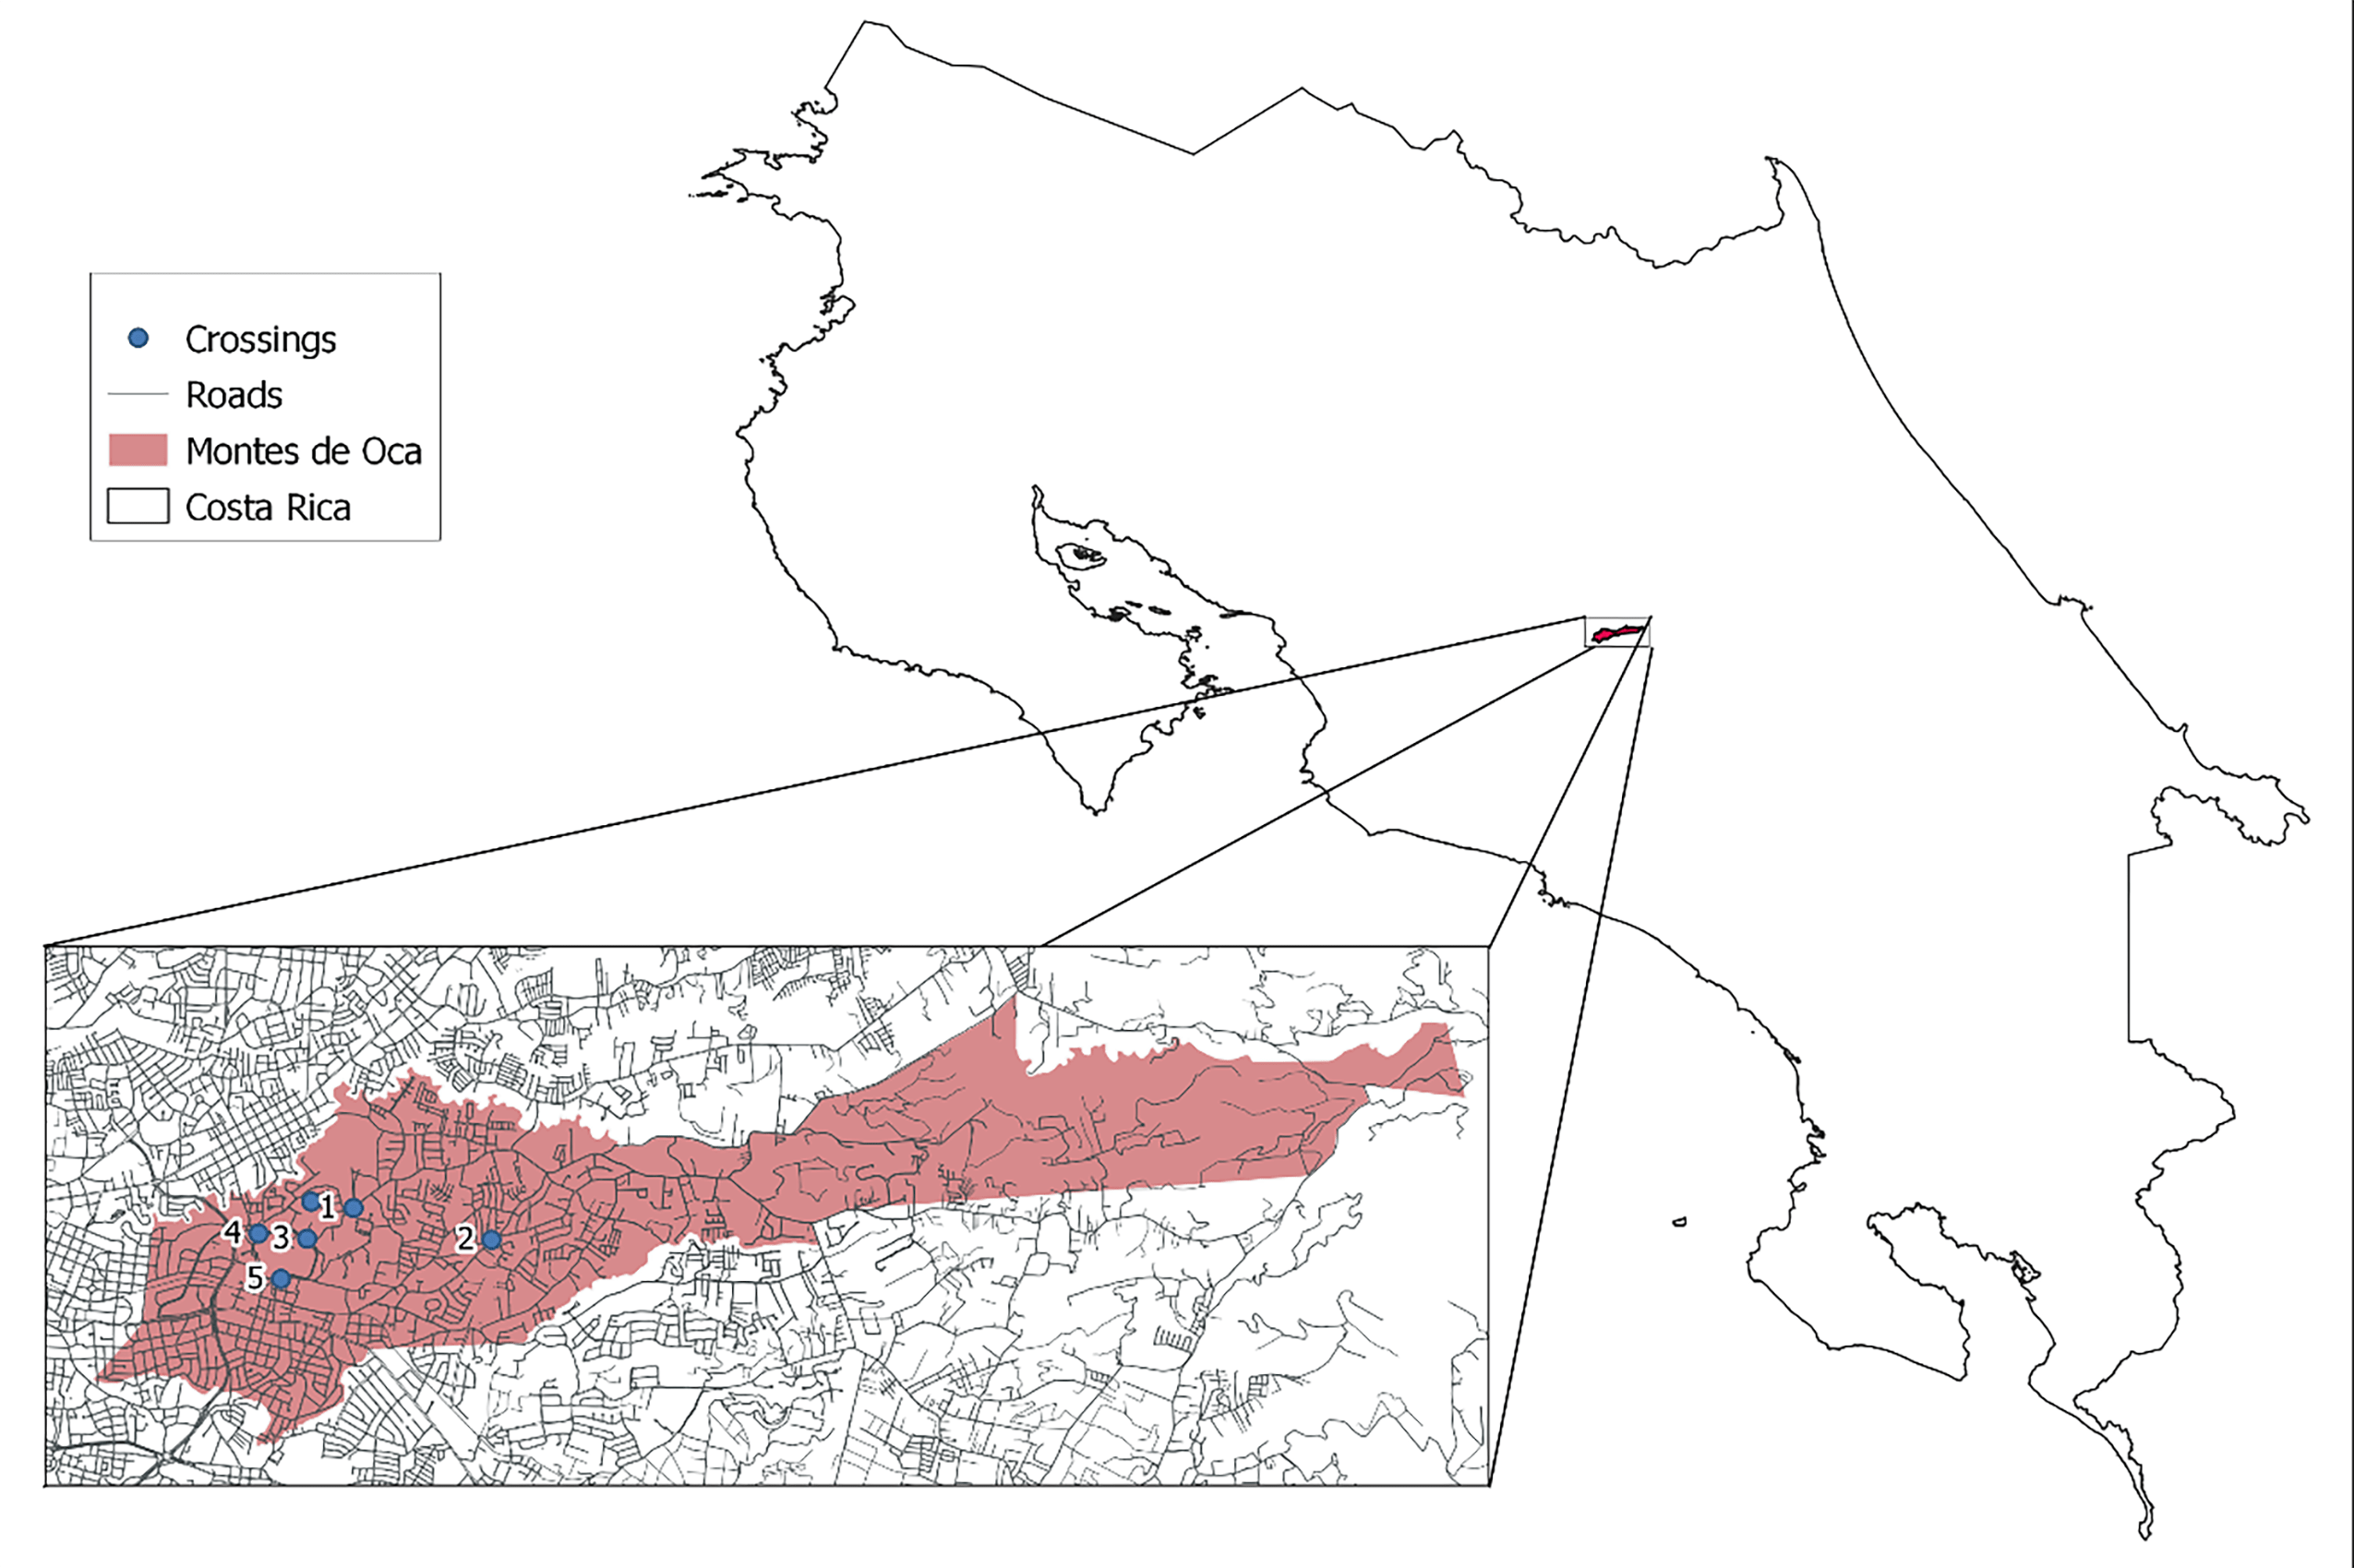
There are 15 pedestrian signalized mid-block crossings in Montes de Oca, six of which were selected for analysis due to time and budgetary constraints. This selection was based on the observed pedestrian flow, crossing characteristics, environment, and vehicle volume. The selected signalized mid-block crossings allow for a wide range of pedestrian and vehicular volume while also providing different geometric and operating characteristics of interest in the study. The location of the analyzed crossings is shown in Table I and Fig. 1.
Table I Description of signalized mid-block crossings analyzed
| ID | County | District | Description |
| 1 | Montes de Oca | Mercedes | Sports Facilities University of Costa Rica, in front of Aqua Matic Laundry |
| 2 | Montes de Oca | San Pedro | Perimercado Supermarket at Vargas Araya, Chicago Bar, Pollos La Granja Restaurant |
| 3 | Montes de Oca | San Pedro | Entrance to Agronomy Faculty University of Costa Rica |
| 4 | Montes de Oca | San Pedro | Faculty of Modern Languages University of Costa Rica |
| 5 | Montes de Oca | San Pedro | 07 Avenue - 61 y 63 Street (General Studies Faculty, Saprissa Building) |
| 6 | Montes de Oca | Mercedes | Distance State University (UNED), in front of Beta Plaza, Amanda’s Coffee |
3.1 Data Collection
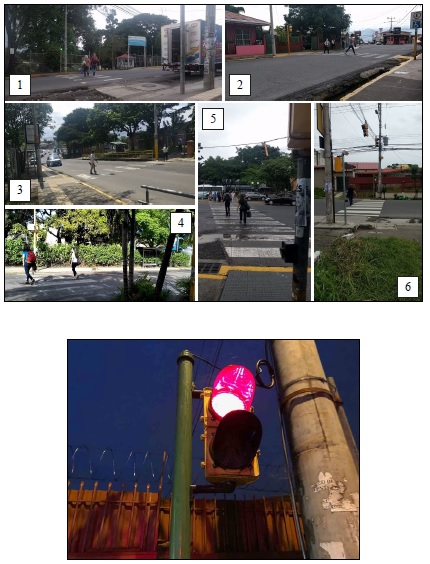
Pedestrian and driver behavior were documented during one hour in each of the selected locations, using a video camera. All videos were recorded during business hours (between 8 a.m. and 5 p.m.). The order of the locations was randomly selected and recording in rainy days was avoided to remove any possible bias related to the weather conditions. Fig. 1 shows the midblock crossings modeled in this study. Fig. 2 presents a standard pedestrian crossing signal in Costa Rica. The signal has two lights, a solid red light that indicates ''do not cross'' and a green ''walking person'' that indicates ''cross''.
The camera location was selected to allow the recording of pedestrian behavior on each side of the road while also enabling the counting of vehicles. After the videos were recorded on each location, analysis was performed to quantify all variables selected for the study. The same person coded all the data from the videos to avoid inter-rater reliability issues.
For this study, a red-light violation is recorded when a pedestrian begins to cross the road after the pedestrian light has changed to red. This definition is consistent with the legal definition of pedestrian traffic violation in Costa Rica, but it might be different in other countries and regions. Similarly, a driver red-light violation is recorded when the car crosses the pedestrian crossing zone while the traffic light is red.
3.2 Selected Variables
The variables selected for the analysis are those that could be measured in the field or obtained through video observation. The study design was observational non-intrusive; hence, no questionnaire was applied, and the location of the camera was selected to be as non-conspicuous as possible. The purpose of this design was the capture a behavior of pedestrians as natural as possible. The variables included in the analysis are:
Pedestrian gender: pedestrians were classified by gender, according to the estimation of a single video observer. There were 1707 observations in total, with 823 corresponding to male and 884 to female pedestrians.
Vehicle volume: all video recordings were one-hour long. The hour was divided into 15 minutes segments for vehicle volume estimation. The number of vehicles counted on each 15-minute interval was multiplied by four to obtain the number of vehicles per hour, which was linked to all the pedestrians that cross during those 15 minutes.
* The number corresponds to the location shown in Table I and Fig. 1
Fig 2. Pedestrian signalized mid-block crossings analyzed in the study*. Typical pedestrian traffic light.
Age: The population sample of this study was separated by age, which allowed analyzing how likely they were to illegally cross according to variables such as maturity, walking speed and perception of danger. Pedestrians were grouped into four age groups according to the estimation of a single video observer:
Less than or equal to 18 years old.
Between 19 and 40 years old.
Between 41 and 60 years old.
More than 60 years old.
Younger pedestrians tend to walk faster and might not perceive danger properly. Older-age pedestrians walk slower, and their perception of danger can be more realistic, which makes them cautious users. Among the less than 18-year old group there are young children, who mainly walk together with an adult. Children were considered an independent observation only when walking, not when they were being carried.
Vehicular traffic-light violation: the number of vehicles that went through the pedestrian crossing while the vehicular light was red. Every vehicle running a red light was considered an individual instance of vehicular illegal crossing for each pedestrian crossing at the same time.
Push-button activated: If the user pressed the traffic light button, it is considered as push-button activated. If the pedestrian did not push the button but crossed in green it is also considered a push-button activated, since there was no need to push the button. If the person did not press the button and crossed during pedestrian red light, it is counted as no push-button not activated.
Group Crossing: this variable indicates if the person crossed alone or accompanied. Group Crossing was defined by two or more pedestrians crossing together.
Pedestrian crossing length: this is the specific marked length of the pedestrian crossing, from curb to curb.
Pedestrian Green Time: It is the amount of time the pedestrian green light is on.
Pedestrian Red Time: this is the minimum time that traffic light stayed on red for pedestrians. The pedestrian crossing lights were all actuated, meaning that the light stays green for the cars and red for the pedestrians until it is activated or actuated by pushing the light button. All actuated traffic lights have minimum cycle lengths determined by the minimum green light for the main flow, in this case the main flow is the vehicular flow and the minimum green time for the vehicles is the same as the minimum red time for pedestrians or ''pedestrian red time''. This time was measured by pressing the button immediately after it went from green to red light. The longer the pedestrian red time, the longer pedestrians must wait.
Minimum Response Time: the time the pedestrian traffic light takes to change to green after it has not been activated for a time equal or longer than a complete traffic light cycle (pedestrian green + red time), in other words, it is the response time to change to green after a long period on red (for pedestrians). The longer the minimum response time, the longer pedestrians must wait.
Waiting Time: this variable represents the time that pedestrians waited since arriving to the crossing point. It is measured from the moment the pedestrians stop at the crossing to the moment they begin to cross the street. This time was recorded for both legal and illegal crossing cases. In group crossings, the time was measured from the moment the first pedestrian of the group arrived at the crossing point. Therefore, all group crossing observations had the same waiting time as the first pedestrian who arrived at the crossing point.
3.3 Data Analysis
The previously discussed variables were included in the analysis either as categorical or as continuous variables. Explanatory variables were used to statistically predict, using a logit model, the probability of illegal crossing at mid-block
3.4 Statistical Method
Given the binary nature of the response variable, pedestrian illegal crossings, a Logit model was proposed. For the model, legal crossings (pedestrians that begin crossing the road while the pedestrian light was green) are coded as zeroes and illegal crossings (pedestrians that begin crossing the road while the pedestrian light was red) are coded as ones; hence, the model results show the actual probability of illegal crossing (Pi). In the logistic regression equation, the natural logarithm of the odds represents a logit transformation, where the Logit is a function of the covariates (19):

where Yi is equal to zero if the pedestrian crossed legally and one if the pedestrian crossed illegally, Pi is the probability of illegal crossing, β0 is the model constant and the β1, … βk are the unknown parameters corresponding with the explanatory variables Xi,k. The unknown parameters were estimated using maximum likelihood methods through R statistical software (20).
4. Results
4.1 Demographic Characteristics
TABLE II presents the demographic characteristics of the sample studied. Of the 1,707 observations collected, 48.2 % were men, mostly between 19 to 40 years. From the 181 pedestrian crossing violations reported, 53.6 % corresponded to men, which shows that men are overrepresented on crossing violations.
4.2 Characteristics of mid-block pedestrian crossings
The characteristics of the crossings analyzed in this study include data related to length, pedestrian green time, pedestrian red-time and minimum response time to change phase. These characteristics are summarized in TABLE III. All the crossings were located in two-lane roads, one in each direction which present mostly passenger vehicles and buses.
Table III Descrptive statistics
| Continuous variables | mean | S.D. | max | min |
| Crossing length (m) | 11.93 | 4.64 | 20 | 7 |
| Pedestrian Green Time (s) | 19.17 | 3.31 | 22 | 15 |
| Pedestrian Red Time (s) | 56.17 | 5.64 | 65 | 50 |
| Minimum Response Time (s) | 13.67 | 4.08 | 21 | 11 |
| Waiting Time (s) | 38.18 | 14.40 | 60 | 0 |
| Vehicles/hour | 1065.30 | 279.44 | 640 | 1620 |
| Categorical variables | percentage | |||
| Illegal crossings | 10.60 | |||
| Male | 48.21 | |||
| Female | 51.79 | |||
| Group crossing | 95.14 | |||
| Vehicle traffic light violation | 3.69 | |||
| Push-button activated | 92.16 |
4.3 Pedestrian and Driver Behavior
TABLE III summarizes the data on pedestrians. As shown on the table, more than 10 % of pedestrians illegally crossed the streets on the study. Also notable is the fact that a high percentage of pedestrians crossed in groups and that the mean waiting time is about 38 s, which is high. Another important result in the data is the percentage of vehicle traffic violations. In 3.7 % of legal crossings by pedestrians, vehicles encroached or crossed the pedestrian crossing area when their light was in red, and the pedestrian was crossing. This illegal crossing by vehicles clearly increases the risk of a pedestrian crash.
Of the total of pedestrians who crossed illegally, 26 % pushed the light button before they decided to cross illegally. Waiting time of pedestrians varied depending on whether they waited or not for the green light.
4.4 Statistical Model
Variables were analyzed using a logit model and considering a confidence level of 95 %. After removing the non-significant variables, the final model is shown in TABLE IV.
Table IV Logit model for illegal crossing
| Variable | Coefficient | Std. Error | Z | P>|Z|* | dy/dx | Odds Ratio | (Confidence Interval 95 %) | |
| Vehicles/hour | -2.918 | 0.737 | -3.96 | 0.000 | -0,068 | 0.997 | 0.996 | 0.999 |
| Vehicle traffic light violation | -1.373 | 0.467 | -2.94 | 0.003 | -0.032 | 0.253 | 0.101 | 0.633 |
| Group crossing | -3.054 | 0.555 | -5.51 | 0.000 | -0.071 | 0.047 | 0.016 | 0.140 |
| Length | 0.091 | 0.040 | 2.29 | 0.022 | 0.002 | 1.095 | 1.013 | 1.184 |
| Pedestrian Red Time | -0.211 | 0.072 | -2.92 | 0.003 | -0.005 | 0.810 | 0.703 | 0.933 |
| Minimum Response Time | 0.457 | 0.062 | 7.40 | 0.000 | 0.010 | 1.580 | 1.400 | 1.783 |
| Waiting Time | -0.152 | 0.010 | -15.17 | 0.000 | -0.003 | 0.859 | 0.842 | 0.876 |
| Constant | 10.789 | 3.479 | 3.10 | 0.002 | ||||
*P<0.05 to make The P variable significant.
From the model based on the data collected, the variables that were significantly correlated to the probability of illegal crossing were: vehicular volume, crossing length, minimum time from red to green light phase, red light phase time, waiting time, group crossings and vehicle illegal crossing.
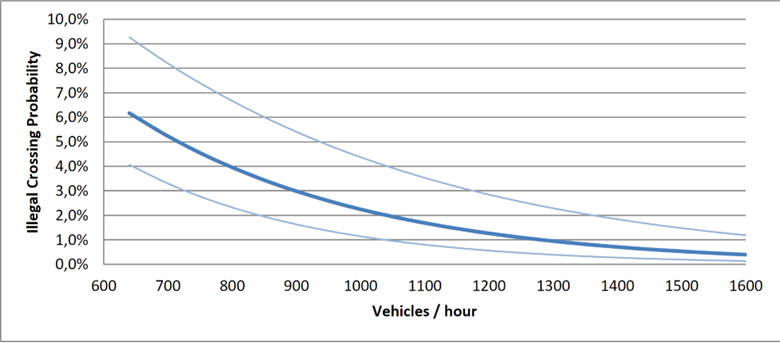
The probability of pedestrians crossing in red decreases when vehicular volume increases. The expected percentage of illegal crossings decreases 6.8 % for each increase of a thousand vehicles per hour, as shown in the marginal effects (dy/dx) column. This behavior is probably due to the higher number of vehicles travelling on the street and smaller traffic gaps available, which discourages pedestrians from crossing on red. This is consistent with the results from Lipovac et al. (13), which mentioned that pedestrian behavior is influenced by the traffic volume and the environment in which the crossing is located. In cases where pedestrian crossings are located in zones with low traffic volume, much larger vehicle gaps were experienced, so a larger number of pedestrians are expected to cross in the red phase.
Fig. 3 presents the change on probability of illegal crossing versus vehicle volume, all the other things being equal. From the figure, the effect of traffic volume is evident. The probability illegal crossing decreased significantly, even with modest increases in traffic flow. With volumes of about 1300 vehicles per hour, the probability of pedestrians violating the red light decreased to lower than 1 %. The darker line represents the expected probability of illegal crossing while the light lines represent the 95 % confidence interval.
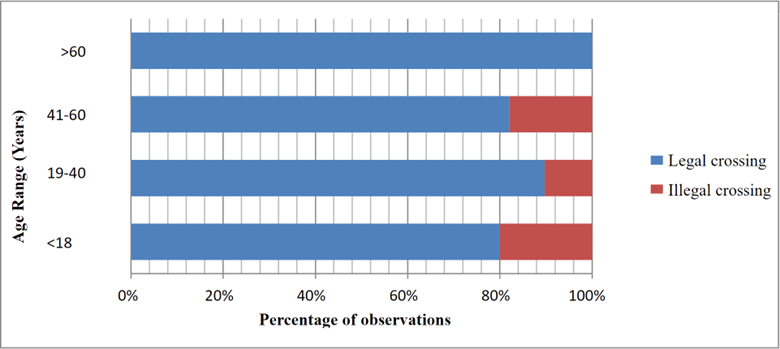
The age variable is found to be non-statistically significant to describe pedestrian compliance in the dataset. As the analyzed data was collected mostly around the University of Costa Rica, most pedestrians were between 19 and 40 years old (94 % of the sample). This data showed that only 6 % of the sample can be classified into different age ranges, therefore this variable does not have enough variability to be of statistical significance. According to (21), variables such as age and gender introduced significant variations to pedestrian behavior, particularly for young pedestrians from ages 17 to 25, who consistently appeared to violate traffic lights more often than adult pedestrians. This idea is supported by Echeverry et al. (22), who determined in their analysis that the younger group of the study (ages between 10 to 19) presented the most violations. In addition, the group older than 59 years old constituted the group with less risk of suffering an accident caused by pedestrian behavior. The study developed by Mohammed (23) showed that younger people tended to interrupt their waiting time sooner than older users, which is consistent with the aforementioned studies. Despite of the non-significance of this variable, Fig. 4 shows how this sample behavior agrees with the trend shown in those studies.
According to statistical model, it is determined that gender has no influence in pedestrian behavior related to illegal crossing for the dataset analyzed, since the variable was non-statistically significant.
Vehicles running the red light affected the probability of pedestrian illegal crossing significantly. The marginal effect shown in TABLE V demonstrated an absolute reduction of more than 3 % in the probability of illegal crossing by pedestrians or a relative reduction of more than 75 % according to the odds ratio. Pedestrians who witnessed a red light running by drivers or know that it is a recurrent behavior in that crossing were more likely to wait for the pedestrian green light.
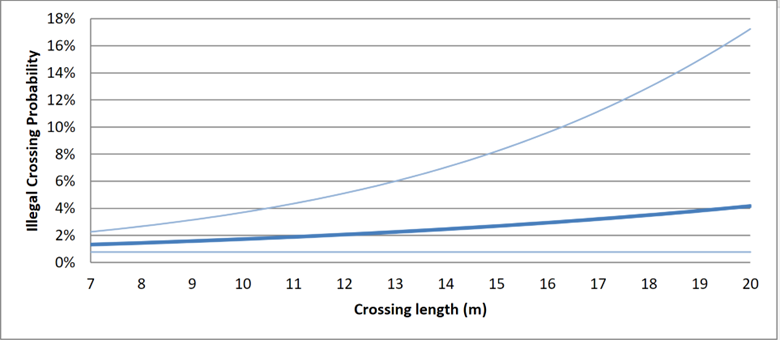
According to the model, as pedestrian crossing length increases, the number of pedestrian illegal crossings increases too. This result was contradictory from behavior expected and from results obtained in previous studies such as de Ren et al. (4) and Duduta et al. (9), since one might expect that the shorter the crossing the faster the pedestrians can cross, and more traffic gaps could be accepted. Fig. 5 shows how the probability of pedestrians violating the red light increases from about 2 % with 7 m crossings to more than 4 % with 20 m crossings. There may be some risk compensation at play here since all the crossings were two-lane and therefore the wider road might have provided space for vehicles to avoid pedestrians and pedestrians to avoid vehicles. Again, the darker line represents the expected probability while the lighter lines represent the 95 % confidence interval.
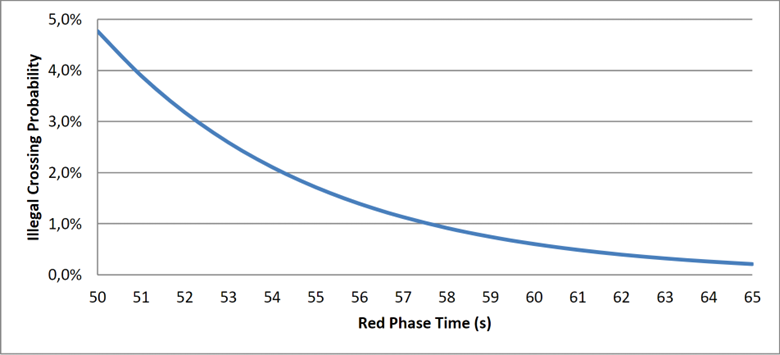
Red light phase time or red time corresponds to the possible user waiting time for the next green phase. Waiting interrupts both traffic and pedestrian flows, therefore the option of illegal crossing under moderate risk became the appealing choice to not delay the trip. The fact that the perception of time can vary among individuals, in addition to other factors such as low vehicular volume and reduced risk perception cause some users to expose themselves to cross illegally. The results show that in places with longer red pedestrian phase time there were fewer illegal crossings; however, there could be correlation between vehicular volume and red time. Fig. 6 shows the effect of red pedestrian phase time versus illegal crossing. Here the 95 % confidence interval lines are not presented since they are higher than 95 % percent and very close to zero percent due to an artifact of the logit function.
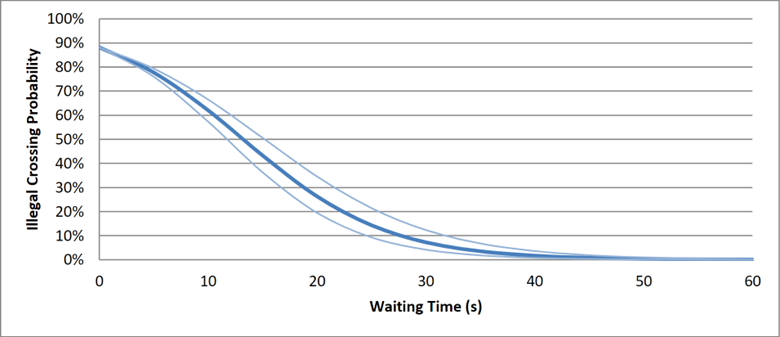
Generally, short waiting times can be directly related to illegal crossing. A user who had waited part of the red phase, had a greater probability to obey the traffic light than users just arrived at the crossing and saw an opportunity to cross with conditions that seemed relatively safe. In this analysis, the average waiting time for pedestrians who violate the red light is 17.4 s against 40.6 s for users who waited for the green light. This result was consistent with other studies, as Brusseu et al. (16) noted that users could be divided into two types, the ones who wait for the pedestrian green light and the ones who cross right after they get to the crossing spot, even if the pedestrian light is red. Previous studies noted that drivers who violate the red light are influenced by time pressure and social context (24); one can expect this to be the case for pedestrians also.
Fig. 7 shows the effect of waiting time on the probability of illegal crossing, according to the model. The figure indicates that many users who violate the traffic light usually make this decision when they get to the crossing spot; therefore, they experience no waiting time.
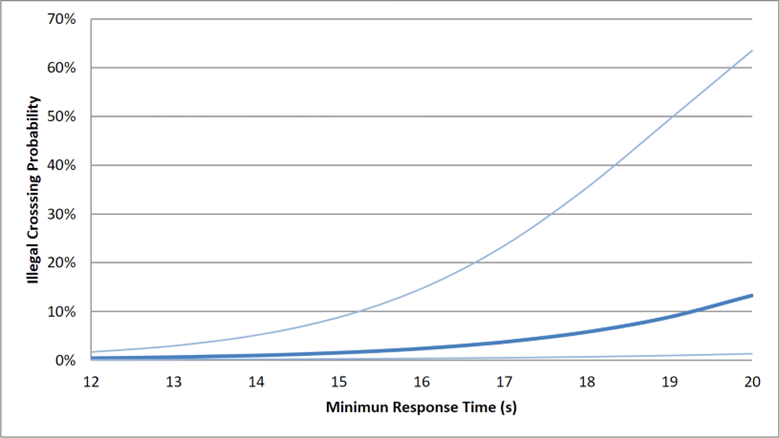
The minimum time the traffic lights take to change to green after long inactivity periods is directly related to the probability of users to make the decision to cross before time. From the analyzed locations, those that took more time to change to green light were the ones with the most occurrences of illegal crossing. Fig. 6 shows that the probability of illegal crossings increased as the minimum response time of traffic light became longer. As shown in the figure, the probability of illegal crossing increased rapidly with increases in the minimum response time. It went from less than 1 % at 12 s to more than 12 % at 20 s.
It was also found that crossing as a group reduced the probability of illegal crossing. The estimated odds ratio for group crossing was 0.047 which means that group crossing reduces the probability of illegal crossing about 95 % compared to pedestrians crossing alone. Illegal group crossing implies that all the members of the group simultaneously attempt to seize a traffic gap, which is a collective behavior difficult to achieve and therefore unlikely. Considering the data analyzed, only 27 % of illegal crossings were also group crossings.
Using the traffic light button to activate the pedestrian green light had not statistically significant effect on the probability of running the red light. Most of users that crossed during the pedestrian red-light phase did not use the button; this behavior was related to the pedestrians’ perception of a lower risk at the time of crossing likely connected to low vehicular volume. Out of 181 users who illegally cross, 74 % did not press the button.
5. Conclusions and recommendations for future research
The analysis shows that the variables correlated to illegal pedestrian crossings at mid-block crosswalks are: vehicular volume, crossing length, minimum time from red to green light phase, pedestrian red phase time, waiting time, group crosses and drivers running the red light. This indicates that the user behavior depends on both environmental and pedestrian characteristics.
Increases on vehicle volume, the number of vehicles running the traffic light on red and pedestrian red light-phase time decrease the probability of illegal crossing. Increasing crossing length and waiting time are correlated with increases on the probability of illegal crossings at the analyzed locations.
The length of the red-light phase is statistically significant, negatively correlated with illegal pedestrian crossing. The fact that red pedestrian phase time disincentives illegal crossing seems contradictory; nevertheless, it might be explained by the possible association to vehicular volume, so this factor might not be attributed to patience from pedestrians.
Differences between the age and gender are not statistically significant based on the analyzed data. Similarly, the use of the traffic light button is a variable with non-statistical significance.
Low vehicular volume induces a significant reduction of the risk perceived by pedestrians, possibly increasing the number of pedestrians violating the crossing light. In areas with low vehicular volume, there are other options to be considered instead of traffic lights, such as speed reducers with proper signalization, because existent infrastructure is underutilized.
Minimum response time is a very important variable in terms of possible engineering improvements that can be applied to mid-block crosswalks. The probability of illegal crossing increases rapidly when minimum response time increases. Hence, it is recommended to reduce the minimum response time to the lowest safe value that includes yellow (for vehicles) and all-red phases.
Crossing length was also found to be directly correlated to illegal crossing. This result has implications for engineering improvements. The crossing length can be shortened using curb extensions which will both encourage pedestrians to comply to the traffic light and drivers to reduce the speed. Also, curb extensions have the added benefit of improving the visibility for pedestrians and drivers.
It is recommended to perform similar studies considering more variability of pedestrian crossings and larger sample sizes. This way, it may be possible to achieve more data representativeness through different age groups, traffic volumes, crossing lengths and other variables that might be correlated to the probability of illegal crossing. It is also important to consider the effect of time that the intersection takes before crossing path is clearing and counting the number of pedestrians who finish crossing right after the pedestrian traffic light changed to red.
Another variable that can be further explored is time of the day, since traffic and pedestrian behavior can vary with it, especially considering peak and off-peak hours and night hours. In addition, time of the day could be a surrogate for trip purpose in an observational design as the one used in this research.
In future studies it would be important to consider the effect of refugee zones within crossing structures in pedestrian behavior. There are different studies that indicate this characteristic of the crossing structure as a modifier of pedestrian behavior.
The observational non-intrusive design of this study has the advantages of being easy to implement and reproduce but has the disadvantage of missing several important variables such as trip purpose or familiarity with the crossing. To overcome some of these shortcomings a hybrid approach can be used where the pedestrian behavior is observed and a questionnaire is then applied. However, this is a much more complex approach that requires significantly more resources and time.
5. Roles of the authors
Enoc Araya-Porras: Research, data curation, formal analysis, initial draft writing.
Andrey Mora-Calderón: Research, data curation, formal analysis, initial draft writing.Jonathan
Aguero-Valverde: Conceptualization, Formal analysis, initial draft writing, Writing - review and editing.

