


 English (pdf)
 Article in xml format
 Article references
 Send this article by e-mail
 Cited by SciELO
  Similars in
SciELO
Similars in
SciELO 
 Permalink
Introduction
The Municipality of Calimaya is part of the geographical and environmental context of the over-exploitation of hydrological and edaphic resources (Comisión Nacional del Agua, 2018a; García-González et al., 2015; Martín del Campo et al., 2014; Secretaría de Medio Ambiente y Recursos Naturales, 2016) in the Metropolitan Area of the Toluca Valley, in addition it is also one of the most populated regions of the State of Mexico with increasing urbanization and industrialization (Martín del Campo et al., 2014). The Nevado de Toluca Flora and Fauna Protection Area (APFFNT) is made up of portions of 10 municipalities, including the southwestern portion of the Municipality of Calimaya (SEMARNAT, 2016). The APFFNT has been affected by different land use and cover change (LULCC) processes such as intensive and semi-intensive agriculture, urban expansion, deforestation and livestock (García-González et al., 2015; García-González & Carreño-Meléndez, 2018; López-Corona et al., 2016; Regil-García & Franco-Maass, 2009; SEMARNAT, 2016).
LULCC are recognized as one of the most relevant drivers of biodiversity loss in ecosystems through processes such as deforestation, crop intensification, conversion to grassland, and abandonment (Rodríguez-Eraso et al., 2013). LULCC have been treated by the Intergovernmental Panel on Climate Change (IPCC) as one of the main drivers of global climate change (Penman et al., 2003). The rate of cover change proposed by Food and Agriculture Organization of the United Nations (Food and Agriculture Organization of the United Nations, 1995) are used to estimate forest loss and land use changes using satellite images and spatial analysis (Puyravaud, 2003). Therefore, due to the geographic and environmental relevance of the territory, the objective of this work was to assess the LULCC in Calimaya in the period corresponding to the years 2010 and 2019.
Material and Methods
Geographic characterization
This study was carried out in the Municipality of Calimaya, located between 19°06’57.56 and 19°13’15.92” North and 99° 44’04.97 and 99°31’49.26” West (Instituto de Información e Investigación Geográfica, Estadística y Catastral del Estado de México, 2013), which belongs to the Valle de Toluca Metropolitan Zone, State of Mexico (Sistema de Consulta de Información Geoestadística Agropecuaria, 2018). Calimaya is located on the northeast slope of the Xinantécatl volcano, a volcano that has Tertiary and Quaternary manifestations, made up of hyaloandesitic material, which is part of the Neovolcanic Axis, which extends from the Pacific Ocean to the Gulf of Mexico (Hayama & Aguilera, 1972). In Calimaya there are two types of climates according to the Köppen classification (Instituto Nacional de Estadística y Geografía, 2008), the C (w2) (w), sub-humid temperate which covers the 57.86% of the territorial surface, and the C (E) (w2) (w), sub-humid semi-cold with 44.14%. Regarding the soil types located in Calimaya, Haplic Phaeozem (54.67%) is the soil that predominates on the surface of Calimaya, followed by Andosol (Humic, 22.94%; Molic, 3.58%; Ochric 1.47%), Eutric Regosol (11.04%), Eutric Cambisol (7.72%), Eutric Fluvisol (1.25%), Pellic Vertisol (0.24%), and Lithosol (0.09%) (INEGI, 1976a, 1976b, 1976c, 1976d). The Calimaya hydrological system belongs to the “Río Lerma 1” hydrographic watershed, which has a territorial extension of 2,058.31 km2 with an average annual volume of natural runoff of 224,348 hm³, annual volume of surface water extraction of 72,880 hm³, and average annual availability deficit of 0.193 hm³ (CONAGUA, 2018b). Calimaya is part of the recharge system of the Toluca Valley Aquifer that covers a total area of 2,811.16 km2, recharge of 336.80 hm³ and extraction of 422.40 hm³, and is classified as overexploited (CONAGUA, 2018a).
Analysis and graphical and cartographic representation of the processes of land use / land change
The identification of the 2019 and 2010 land use classes was carried out in the ArcMap version 10.4 software. The current land use of 2019 was determined using the Sentinel 2 Multispectral Instrument (MSI) satellite imagery with a resolution of 10 m (13 spectral bands covering the spectral range 0.44-2.19 µm) and processed with a real colour combination of bands. To determine the land use of 2010, SPOT-5 (Satellite Pour l’Observation de la Terre) High Resolution Geometric (HRG) the satellite imagery with a resolution of 10 m (5 bands in the spectral range of 0.48 to 1.75 µm) was used. Both satellite images have atmospheric cleaning and were orthorectified, which allowed a more precise analysis. Afterwards, the supervised classification with a maximum likelihood algorithm (Liang et al., 2020) was carried out to determine land use for 2019 and 2010.
The land use classes used in this research were defined by following the methodology indicated by the IPCC (Penman et al., 2003): 1) Forest land; 2) Cropland; 3) Grassland; 4) Wetland; 5) Settlements; and 6) Other land. The category “other land” includes bare soil, rock, ice, and all unmanaged land areas that do not fall into any of the other five categories. In this work, “other land” refers to bare soil. Following the guidelines of the IPPC (Penman et al., 2003), a seventh category “mining” was also added due to the relevance of mining activity in Calimaya, referring to the extraction of sand and gravel. The analysis of land use and land cover change rates were carried out through the index proposed by FAO (1995), standardizing by Puyravaud (2003) represented in the following equation 1:
 (1)
(1)
Where, CC is the rate of cover change (%); t1 is the starting year; t2 is the current or most recent year; A1 and A2 are the land cover (km ) at time t1 and t2, respectively.
GPS checkpoints and photographs of the verified areas and landscape were taken from 7 field trips carried out between August and November of 2019. The official cartographic elements used were: INEGI topographic charts, codes E14A37, E14A38, E14A47, E14A48, scale 1: 50,000 (INEGI, 2014a, 2014b, 2015a, 2015b); charts of land use and land cover of INEGI, codes E14A37, E14A38, E14A47, E14A48, scale 1: 50,000 (1975, 1976e, 1976f, 1976g).
Results
In the period 2010-2019, the cropland covered more than 60% of the territory of Calimaya (Figure 1 and Figure 2;Table 1). In 2019 a decrease of 0.03% change in the area covered by cropland compared to 2010 (approximately 66.35 km2), mainly related to the increase of the mining and settlements land uses, and forest land cover (Figure 3;Table 1). Between 2010-2019, more than 15% of the territory of Calimaya was covered by forest land (Figure 1 and Figure 2;Table 1). In 2019, the area occupied by forest land cover decreased 1.03% compared to 2010 (approximately 17.55 km2), a change mainly related to the increase in grassland, cropland, and mine land uses (Figures 3,Figure 4 and Figure 5;Table 1). The settlements covered more than 9% of the territory of Calimaya between 20102019 (Figure 1 and Figure 2;Table 1). In 2019 an increase of 0.57% was observed in the area covered by settlements in 2010 (approximately 9.59 km2), a change mainly related to the decrease in cropland and bare soil land uses (Figure 3;Table 1). From 2010 to 2019 there was an increase of 1.19% in the area covered by mines in Calimaya, which currently occupies the 5.85% of territory (approximately 6.02 km2), a change mainly related to the decrease in the cropland area (Figure 3;Table 1). In 2019 an increase of 2.23% in the area occupied by grassland was observed compared to 2010, which is mainly related to the loss of forest land cover in Calimaya (Figure 3;Table 1).
Other land (bare soil) had a decrease of 2.58% of the surface between 2010 and 2019, mainly related to the increase in the area of settlements in Calimaya (Figure 3;Table 1). In Calimaya, the wetland surface increased 3.80% between 2010 and 2019, a change related to the loss of cropland area during the rainy season (Figure 3;Table 1).
Calimaya occupies 5.62% of the total area of the APFFNT (Table 1). The forest land cover occupies 49.55% of the APFFNT area in Calimaya, while the cropland, grassland and mine land uses together cover the remaining 50.45% (Table 1). Cropland is the predominant land use in the APFFNT with 37.63% (Table 1). Figure 3 shows the increase in the area of grassland and mine within the APFFNT in 2019 (Figure 3;Table 1).
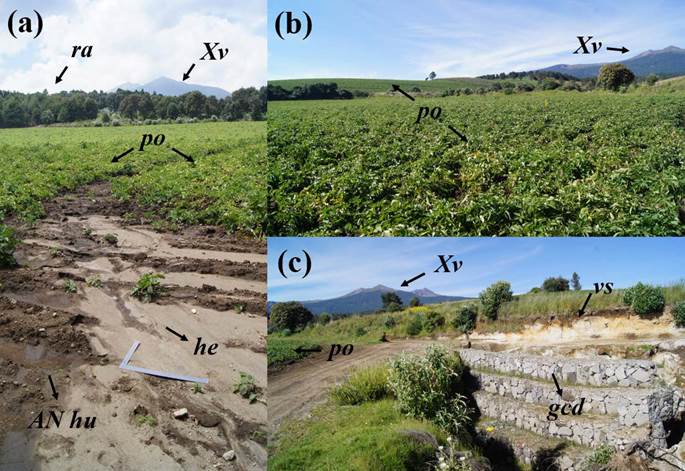
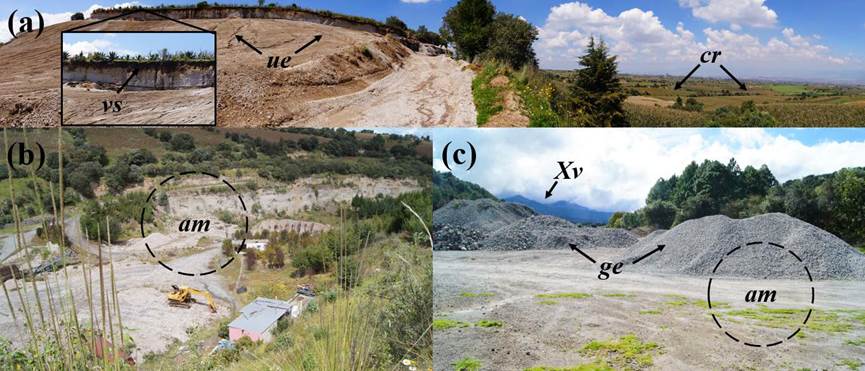
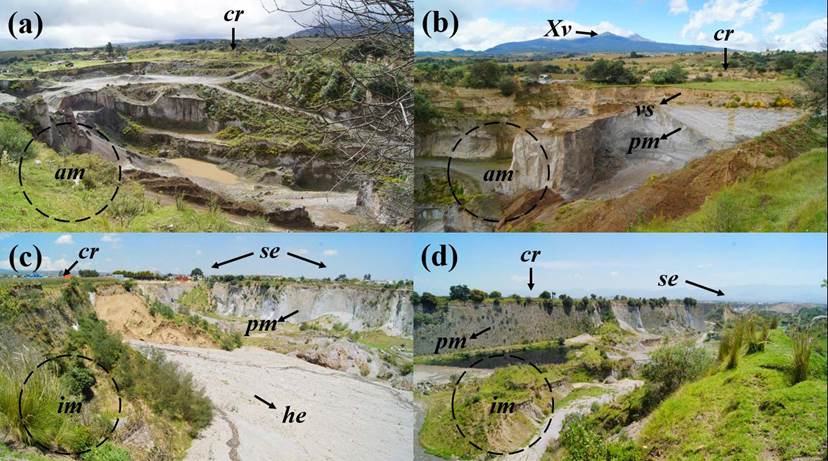
Figure 4,Figure 5 and Figure 6 provide empirical evidence that corroborates the information from the LULCC in Calimaya processes (Figures 1,Figure 2 and Figure 3). The potato cropping within the boundaries of the APFFNT continues to advance (Figure 4). The exposure of soils cropping with potato to erosive processes was observed (Figure 4a and c). There is official (Figure 5b and Figure 5c;Figure 6) and unofficial extraction of sand and gravel (Figure 5a) colliding with agricultural land. Active (Figure 5b,Figure 6a and Figure 6b) and inactive (Figure 6c and Figure 6d) mines permanently change the landscape. Predominantly, the inner walls of active and inactive mines have a slope of almost 90 degrees (Figure 6), are surrounded by crops and settlements.
Table 1 Land use/land cover change (2010-2019) in the Municipality of Calimaya, State of Mexico
| Land use and land cover1 | 2010 | 2019 | APFFNT2 | CC3 | TC4 | Net change (km2) | Losses related to the increase in other uses and cover land | |||||||
| km2 | km2 | % | km2 | CL | FL | ST | MI | GL | OL | WL | ||||
| km2 | ||||||||||||||
| Cropland (CL) | 66.3543 | 66.1799 | 11.3414 | -0.0292 | -0.1744 | Loss | -1.4066 | NA | 0.2758 | 0.3445 | 0.5936 | 0.0506 | 0.0497 | 0.0925 |
| Gain | 1.2322 | NA | -0.9278 | -0.0221 | -0.0138 | -0.2257 | -0.0167 | -0.0261 | ||||||
| Forest land (FL) | 17.5547 | 16.0061 | 14.9332 | -1.0261 | -1.5485 | Loss | -2.0163 | 0.9278 | NA | NA | 0.0313 | 1.0573 | NA | NA |
| Gain | 0.4678 | -0.2758 | NA | NA | -0.0003 | -0.1917 | NA | NA | ||||||
| Settlements (ST) | 9.5906 | 10.0882 | NA | 0.5620 | 0.4976 | Loss | -0.0256 | 0.0221 | NA | NA | 0.0001 | NA | 0.0001 | 0.0033 |
| Gain | 0.5232 | -0.3445 | NA | NA | -0.0001 | NA | -0.1775 | -0.0011 | ||||||
| Mine (MI) | 5.4100 | 6.0214 | 0.1885 | 1.1898 | 0.6114 | Loss | -0.0142 | 0.0138 | 0.0003 | 0.0001 | NA | NA | NA | NA |
| Gain | 0.6257 | -0.5936 | -0.0313 | -0.0001 | NA | NA | -0.0007 | NA | ||||||
| Grassland (GL) | 3.1056 | 3.7961 | 3.6741 | 2.2308 | 0.6905 | Loss | -0.4174 | 0.2257 | 0.1917 | NA | NA | NA | NA | NA |
| Gain | 1.1079 | -0.0506 | -1.0573 | NA | NA | NA | NA | NA | ||||||
| Other land (bare soil) (OL) | 0.7007 | 0.5556 | NA | -2.5782 | -0.1451 | Loss | -0.1949 | 0.0167 | NA | 0.1775 | 0.0007 | NA | NA | NA |
| Gain | 0.0498 | -0.0497 | NA | -0.0001 | NA | NA | NA | NA | ||||||
| Wetland (WL) | 0.1683 | 0.2368 | NA | 3.7957 | 0.0685 | Loss | -0.0272 | 0.0261 | NA | 0.0011 | NA | NA | NA | NA |
| Gain | 0.0958 | -0.0925 | NA | -0.0033 | NA | NA | NA | NA | ||||||
| APFFNT2 Calimaya | 3.01371 | |||||||||||||
| Total | 102.8842 | 102.8842 | 535.8988 | |||||||||||
1 According methodology of IPCC (Penman et al., 2003). 2 Nevado de Toluca Flora and Fauna Protection Area. 3 Rate of cover change estimated by the index proposed by FAO (1995) standardized by Puyravaud (2003). 4 Total change of land cover obtained from the geoprocessing of the satellite imagery. Not applicable (NA). Source: Prepared by the authors.
Source: Prepared by the authors.
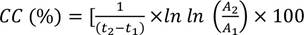
Figure 1 Land use and land cover in the Municipality of Calimaya, State of Mexico (2010).
Source: Prepared by the authors.
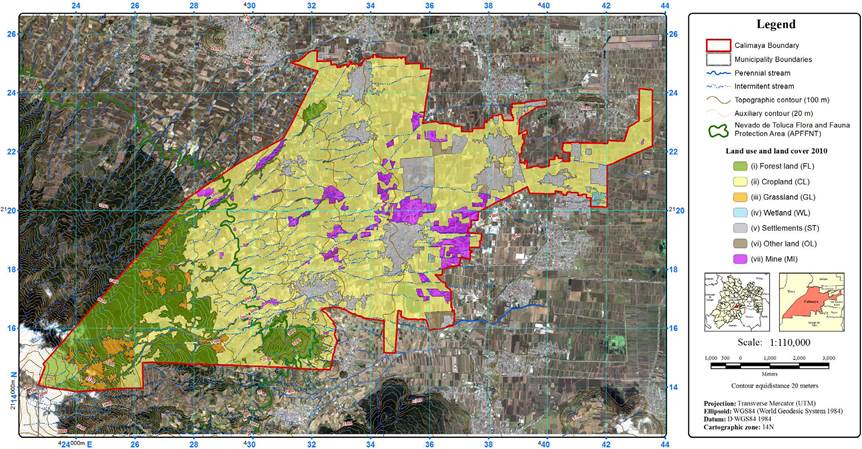
Figure 2 Land use and land cover in the Municipality of Calimaya, State of Mexico (2019).
Source: Prepared by the authors.
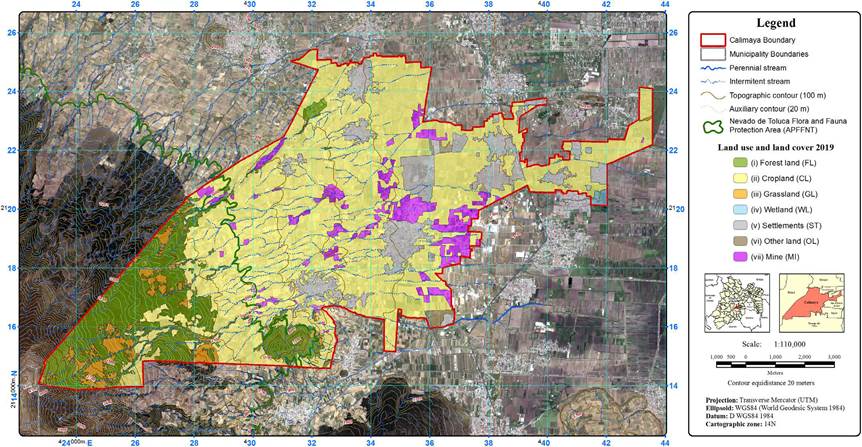
Figure 3 Changes in land use and land cover in the Municipality of Calimaya, State of Mexico (period 2010-2019).
Source: Prepared by the authors.
Figure 4 Potato crops (po) in the Nevado de Toluca Flora and Fauna Protection Area in the Municipality of Calimaya, State of Mexico (2019): Xinantécatl volcano (Xv); reforestation area (ra); humic Andosol (AN hu); volcanic soil (vs), probably Andosol ochric; gabion check dam (gcd); and, signs of hydric erosion (he). Site with approximately 3280 masl (a). Site with approximately 3040 masl (b and c, are the same site).
Source: Prepared by the authors.
Figure 5 Extraction of sand and gravel in the Municipality of Calimaya, State of Mexico (2019): active mining (am); unofficial extraction of sand and gravel (ue); Xinantécatl volcano (Xv); crops (cr), mainly maize; volcanic soil (vs). They are all different sites (a, b and c).
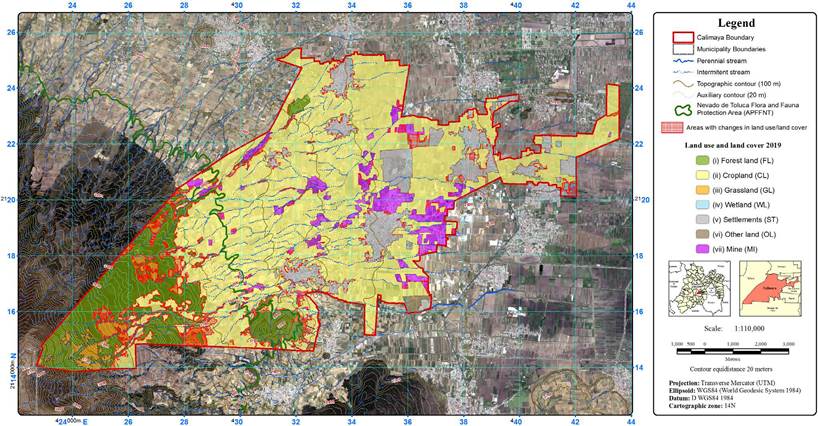
Source: Prepared by the authors.
Figure 6 Extraction of sand and gravel in the Municipality of Calimaya, State of Mexico (2019): active mining (am), the same site (a and b); inactive mining (im), the same site (c and d); Xinantécatl volcano (Xv); crops (cr), mainly maize; settlements (se); volcanic soil (vs); parent materials (underlying geological material) of volcanic ash and pumice (pm); signs of hydric erosion (he).
Discussion
In the last decade (2010-2019) cropland remained as the predominant land use in Calimaya (Figure 1 and Figure 2;Table 1), confirming the information from previous studies of the period of 2000-2013 (García-González et al., 2015; García-González & Carreño-Meléndez, 2018). The LULCC process in Calimaya related to the cropland, in which crop of maize, forage oat, faba bean and potato are predominant (Servicio de Información Agroalimentaria y Pesquera, 2019), is related to the agricultural technological level (INEGI, 2009). According to the potential use of cropland in Calimaya reported by INEGI (2009), 33.14% is suitable for continuous mechanized agriculture, 48.56% for seasonal mechanized agriculture, 12.4% for seasonal manual agriculture, and 5.9% is not suitable for agriculture. The agriculture suitability of more than 70% of the cropland territory for continuous and seasonal mechanized agriculture reported by INEGI (2009), contrasts with the predominance of soils with forestry suitability such as Haplic Phaeozem and Andosols. The agricultural suitability of potato, oats, maize and faba bean species in the APFFNT is low and never above the forestry suitability (Regil-García & Franco-Maass, 2009).
In 2000 cropland occupied approximately 75% (77.353 km2) of the territory of Calimaya (García-González et al., 2015), there was a decrease of almost 11% throughout these 20 years (Figure 2 and Figure 3). In Calimaya, the expansion of settlements (housing settlements) and mines are the main processes of change in land use related to the loss of cropland area (Figure 1,Figure 2 and Figure 3;Table 1). Some cropland areas close to the settlements were occupied by settlements (Figure 3). Some settlements complexes continue to expand the construction of houses within the already pre-established area, for this reason, the differences observed in the Figure 3 that are not computed as direct increment in the area of settlements. The process of occupation of cropland areas by settlements was more intense in the past decade (García-González et al., 2015). According to García-González et al. (2015), the urban expansion process resulting from migratory flows attracted by real estate investments promoted since the late 1990s, has transformed the dynamics of total population growth. Similarly, areas of bare soil were occupied by settlements (Figure 3). With the processing of satellite imagery, a small marginal increase in forest land cover is also noted, mainly in gallery forests (Figure 3).
According to Cruz-Ruíz et al. (2016), sand and gravel mining in Calimaya can remove layers from 1 to several meters deep, permanently altering the landscape and soil. It is common for seasonal maize cultivation to continue soon after the pumice has been removed. The unofficial extraction of sand and recordings on croplands was verified in the fieldwork (Figure 5a). From the point of view of chemical fertility, according to Cruz-Ruíz et al. (2016) these soils can take up to 4 years to start the recovery process. There are three change processes related to the expansion of mining, the expansion of official mines, the opening of new areas, and the erosion of inactive mines (Figure 3,Figure 5 and 6). There was an increase of approximately 4% in the area occupied by mining in 2019, compared to the year 2000 (García-González et al., 2015). The environmental problem that revolves around the mines in Calimaya is increasing, mainly related to the lack of measures that mitigate environmental impacts during and after the end of the extraction of sand and gravel within the mines, resulting in their abandonment (Arriaga-Rivera, 2020; Valencia-García et al., 2016). Rural and urban populations are exposed to the high risk of landslides occurrence in active and inactive mines (Figure 5 and Figure 6). The access roads such as streets and highways, where public transport circulates, pass in the middle of some active or inactive mines.
The change process in the expansion of potato crop, mainly, has increased the losses of forest land cover in Calimaya (Figure 3). The croplands, including potato crop land, were established prior to the creation of the establishments of the APFFNT (SEMARNAT, 2016), and they belong to the ejidal land tenure system, however, they continue to exceed these boundaries (Figure 1,Figure 2 and Figure 3). Evidence of physical soil degradation by water erosion processes was observed in all potato crops that are within the APFFNT boundary, as exemplified in Figure 4. The forestry suitability of the predominant Andosols in the high zone of Calimaya contrasts with the croplands. The parent material of Calimaya soils is composed of volcanic ash and pumice (Hayama & Aguilera, 1972). When this material is exposed by agriculture or mining (Figure 4), degradation processes such as water and wind erosion are accelerated. Even techniques such as the use of gabion check dam (Figure 4c ) cannot contain the devastating effects of water erosion in soils with poorly developed surface horizons. Without a soil and water conservation program in Calimaya, the intensive and semi-intensive agriculture of maize and potato, mainly, will have an anti-economic effect soon with the irreversible degradation of volcanic soils.
In addition to agricultural expansion, the main processes of forest land cover loss are deforestation that is noted with the expansion of grassland, and the opening of mines (Figure 3,Figure 4 and Figure 5). The trend is the replacement of grassland by cropland, mainly in the APFFNT. The expansion of the grassland area in Calimaya has a direct relationship with human deforestation (Figure 4). According to INEGI (2009), 81.7% of the grassland territory in Calimaya is suitable for the development of grassland, 12.4% for the use of natural vegetation other than grassland (12.4%) and 5.9% is not suitable for livestock use. Ovine, goat, porcine, bovine and equine cattle are the most common in the agricultural land area of Calimaya. Ovine cattle is an important subsistence economic activity for farmers in Calimaya. It is known that extensive grazing of native forages is not common, despite the use of some local resources in feeding, due to the most characteristic production system is semi-intensive, due to its feeding strategies with semi-confined herds (Plata-Pérez, 2016). For this reason, grassland area expansion, mainly in the APFFNT, is not directly associated with sheep farming, but rather with deforestation (Figure 5).
Calimaya only has one water body, the San Antonio La Isla Lake (Figure 3). The increase in the wetland surface is mainly related to the changes in precipitation, during the dry season the water body losses area that is later used by farmers, however during the rainy season the water body increases impeding farmers from using that specific area (Figure 3). Empirical evidence is invaluable in case studies (Brown et al., 2018), for this reason, in addition to accessing official sources and antecedent studies, through the information obtained in the field work (Figure 4,Figure 5 and Figure 6), it was possible to correctly interpret the processes of LULCC in Calimaya (Figure 1,Figure 2 and Figure 3). The environmental context of Calimaya contrasts with the LULCC processes observed in its territory. Calimaya belongs to an aquifer recharge zone (CONAGUA, 2018a), whose volcanic soils (Bloomfield & Valastro, 1974; Cruz-Ruíz et al., 2016) with forestry aptitude are overexploited with unprotected agriculture (Regil-García & Franco-Maass, 2009) and mining activities. The advance of grasslands and croplands in the APFFNT verified in the last decade 2010-2019 is worrying, because it denotes the lack of attention of the environmental authorities in relation to the processes that can degrade the soil and the water resources. In addition to its expansion between 2010-2019, mine land use, active or abandoned, borders on cropland and settlements uses, a fact that characterizes the direct exposure of the environment and the inhabitants of Calimaya to risks such as landslides.
Conclusions
In the period 2010-2019, deforestation that precedes non-conservationist agricultural production, mainly potato, was the main LULCC process in the APFFNT territory, which corresponds to the Municipality of Calimaya, State of Mexico.
Despite the decrease in cropland territory in Calimaya in the last 20 years, in this decade, there was a decrease in the process of occupation of cropland areas by settlements.
The area occupied by the mining activity showed a small increase. However, the areas already occupied show signs of abandonment, misuse such as the disposal of solid waste, and high susceptibility to erosion that exposes the population to the risk of landslides.

