


 text in
  English (pdf)
 Article in xml format
 Article references
 Send this article by e-mail
 Cited by SciELO
  Similars in
SciELO
Similars in
SciELO 
 Permalink
-
Endurance events such as half-marathon, marathon and ultra-marathon require participants to have specific high cardiorespiratory, metabolic, neuromuscular and psychological capacities to be able to compete (Del Coso et al., 2017; Lazzer et al., 2012; Millet & Millet,2012; Rapoport, 2010). Likewise, due to the race duration and the long distance that athletes need to cover, it is common for runners to use different strategies in order to maintain desired performance during the competition ( Díaz, Fernández-Ozcorta, & Santos-Concejero,2018; Renfree & Gibson, 2013). Thus, the running economy and metabolic energy of the runner seem to be fundamental ( Sawyer et al., 2010; Tartaruga et al., 2012). To achieve a correct energy economy, athletes usually apply different pacing strategies, modifying running speed and stride width ( Skorski & Abbiss, 2017).
In previous studies, it has been shown that most of the amateur athletes usually experience speed variations during the course of the marathon ( Ely, Martin, Cheuvront, & Montain,2008;, Renfree & Gibson 2013; Díaz et al., 2018). For example, during the San Diego and Las Vegas marathons, the variation in running pace recorded using electronic tracking devices (1-5 Hz) was found to be 16.9 ± 6.4% and 16.8 ± 6.6%, respectively ( Haney & Mercer,2011). In other research carried out with amateur runners, Ely et al., (2008) showed that in the first 5 km, the highest average speed was reported. After that, speed decreased and was maintained between kilometers 10 to 25. Then, from this point of the race, another decrease in running speed was evident between kilometers 25 to 40 ( Skorski & Abbiss,2017). In contrast, elite-level runners usually perform better at the end of the race between kilometers 35 to 40 (Ely et al., 2008). Moreover, during the 2009 Women’s Marathon Championship, Renfree & Gibson (2013) found that athletes who arrived at the finish line in the leading group were able to maintain a regular pace compared to the rest of the women who ran with an irregular pace strategy.
Concerning the athletes’ physiological responses, variations in heart rate are usually reported during endurance events ( Rodríguez-Marroyo, González-Lázaro, Arribas-Cubero, & Villa,2018). ( Formenti, Trecroci, Cavaggioni, Caumo, & Alberti 2014) have reported a lower average heart rate during the last 19 km in comparison with the first kilometers in a 42-km marathon. During a 35-km trail running competition, the heart rate could be influenced by running pace, terrain slope, and fatigue ( Vallverdú et al., 2017). Changes in mechanical performance as pacing and technique running could determine the heart rate responses, specifically higher cardiorespiratory load; and also cardiorespiratory capacity can determine the running pace ( Reis, Van den Tillaar, & Marques,2011).
Changes in pacing strategies and physiological responses can also be influenced by different factors such as the runner’s experience, age, sex, time to cover the distance and the environmental conditions (, March, Vanderburgh, Titlebaum, & Hoops 2011; Santos-Lozano, Collado, Foster, Lucia, & Garatachea,2014;, Trubee, Vanderburgh, Diestelkamp, & Jackson 2014). Specifically, environmental factors during long-distance events have been studied widely in recent years ( Knechtle et al., 2019; Rojas-Valverde, Ugalde-Ramírez, Sánchez-Ureña, & Gutiérrez-Vargas, 2019). One of the first works that analyzed environmental conditions in endurance races were carried out by ( Verdaguer‐Codina, Pujol, Rodriguez, & Ortiz 1995) during the Olympic Games in Barcelona 1992, in which it was indicated that the races performed under high thermal stress could lead to adverse physiological and physical effects on athletes. This is supported by recent evidence that showed serious complications when performing under hot and humid conditions (Rojas-Valverde, Olcina, Gutiérrez-Vargas & Crowe, 2019).
It is currently known that temperature, wind direction, and humidity can affect physiological (heart rate, thermoregulation) and mechanical (gait biomechanics, speed) performance of endurance runners during competition and training ( El Helou et al., 2012; Flouris & Schlader, 2015; Junge, Jørgensen, Flouris, & Nybo, 2016; Maughan Otani, & Watson, 2012). The best indicator to assess thermal stress index during sport events is Wet-Bulb Globe Temperature (WBGT) because it considers wet bulb temperature (Twb), black globe temperature (Tg) and dry bulb temperature (Tbd) to create a global temperature index ( Armstrong et al., 2007; Brocherie, & Millet, 2015). Under hot and humid circumstances, the manifestation of fatigue can be premature compared to colder and dryer environmental conditions, due to higher metabolic, neuromuscular and cardiorespiratory requirements to keep running pace ( Rapoport,2010). These weather conditions could impact neuromuscular performance affecting speed ( Del Coso et al., 2013; Wu, Peiffer, Brisswalter, Nosaka, & Abbiss,2014), likewise, increases in the thermal stress index, could cause higher internal body temperature and liquid loss (dehydration) ( Cheuvront, Kenefick, Montain, & Sawka, 2010). The aspects detailed above could generate alterations in the internal load (e.g. heart rate) leading to a decrease in muscle function and also affect negatively running performance during the marathon (Maughan, 2010; Maughan, Otani, & Watson, 2012). Other serious complications such as exertional rhabdomyolysis or acute kidney injury could occur when dehydration, heat strain and external load are presented combined ( Rojas-Valverde et al., 2019).
Understanding the evidence presented and recognizing the influence of a hot environment on running performance (internal and external load), the purpose of the present research was to analyze the variation of speed and heart rate in amateur runners during a marathon in hot conditions in Costa Rica.
Methods
Participants
Eighteen amateur runners who trained regularly at least 3 times per week (age: 35.66.9 years; weight: 67.4 11.9 kg.; height: 16810 cm; fat percentage: 20.9 7.5%, VO2max: 52.6 7ml/kg/min; leg lean mass: 17 4.2 kg., running marathon experience: 96.6 years) took part in the study. They ran a beach-side marathon (42195 m) in Guanacaste, Costa Rica with a thermal index of 27.8 ± 3.52 ºC and at an altitude of 0-80 m. No injuries or other adverse conditions were reported at least 3 months before the event that could affect neuromuscular, cardiovascular o performance testing. The experimental protocol was approved by the Master Degree Committee of the National University of Costa Rica. Before the study began, all the participants were informed of the details of the experimental procedures and the associated risks and discomforts. Each subject gave written informed consent according to the criteria of the Declaration of Helsinki regarding biomedical research involving human subjects as approved at the 64th World Medical Association General Assembly, Fortaleza, Brazil (2018).
Instruments and procedure
Anthropometric and physiological tests were performed 15 days before the event. All participants were cited at the Physiology Laboratory (PROCESA) at different schedules. Each subje ct performed the tests individually. For bodyweight an Elite Tanita-Ironman® Series BC554, with 0.1 kg sensitivity was used; height was measured using a stadiometer (Seca, Hamburg, Germany); and body composition by dual x-ray absorptiometry (DEXA) with an accuracy of ± 3% (General Electric enCORE 2011®, software version 13.6). VO2max was assessed using a gas analyzer (VO 2000, MedGraphics®) and BreezeSuite® software, with a treadmill incremental intensity protocol as described by ( Martin & Coe 2007) (i.e., 3 min warm-up, 1km/h increasing each 3 min until volitional fatigue). The gas analyzer has an accuracy of ± 3% on absolute volume ( Crouter et al.,2006).
The environmental conditions were measured using a heat stress monitor (QuestTemp 36, 3M). Thermal index was expressed by Wet-Bulb Globe Temperature (WBGT) which was estimated considering wet bulb temperature (Twb), black globe temperature (Tg), and dry bulb temperature (Tbd) by the equation: 0.7Twb + 0.2Tg + 0.1Tdb ( Armstrong et al., 2007; Brocherie, & Millet, 2015). The equipment was set 50 meters from the finish line and placed on a tripod 30 min before the start of the event. Measurements were recorded throughout the whole event each 10 min and for analysis the induvial data of each participant throughout the race was considered due to pacing differences.
Speed and heart rate (HR) were measured during the whole race. To standardize the data, the race was divided into a total of eight laps in range of 5 km as follows: 0-5 km, 6-10 km, 11-15 km, 16-20 km, 21-25 km, 26 -30 km, 31-35 km, 36-40 km. Mean speed and mean HR were calculated using raw data for every range of 5 km of the total marathon distance. The last 2195 m were excluded to standardize all laps in 5 km and considering its particularities ( Ely et al., 2008). An inertial device (SPI-PRO X II, GPSports, Canberra, Australia) was used to measure both external and internal load. These devices use a sampling frequency of 15Hz. The devices were worn by the runners in a special neoprene vest at the T2-T4 vertebrae level and in the middle line between the scapulae. Special software (V2.5.4 firmware AMS Team, GPSports, Canberra, Australia) was used to analyze the data. A heart rate monitor (T31, Polar®, Finland) was attached to the runners using a chest strap. All the information during the event was collected and linked to the inertial device software.
The percentage coefficient of variation (%CoV) of both speed and heart rate of each lap, was calculated as follows ( Haney 2010; Haney & Mercer, 2011):
Statistical Analysis
Descriptive data were reported as mean and standard deviation. Normality was explored using the Shapiro Wilk Test (p> 0.50). A parametric inferential statistic was applied using a one- way analysis of variance to explore differences between laps during the marathon. Bonferroni Post hoc analysis was performed to determine specific pairwise differences among laps. Pearson’s correlations were calculated to explore relations among individual data of WGBT with % variation of heart rate and speed. In addition, multiple stepwise regression was used to explore the variables that influence marathon finish time. Alpha was set at p.05. The Statistical Package for the Social Science (SPSS; v. 24.0; SPSS Inc., Chicago, IL, USA) was used for the statistical analysis.
Results
The event was performed under an average temperature (WGBT) of 27.8 ± 3.52 ºC and a maximum of 33.26 ºC. The average time to complete the race was 225 ± 37.61 min. Table 1 shows the descriptive data of speed and heart rate means by corresponding 5km laps of the marathon. The average speed was 10.5 ±1.4 km/h while the heart rate average was 161 ± 10.8 bpm.
Figure 1 represents the statistical differences in speed %CoV among the race laps (F= 7.179, p< 0.001). The speed %CoV was higher in the 31-35 km lap than the 5-10 km (p= 0.025), 6-10 km (p< 0.001) and 11-15 km (p< 0.001), 16-20 km (p< 0.001), 21-25 km (p< 0.001) laps. Additionally, the speed %CoV was higher in the 26-30 km lap than the 11-15 km (p= 0.014) and 16-20 km (p< 0.029) laps, and speed %CoV was higher in the 36-40 km lap than the 11-15 km (p= 0.021) and 16-20 km (p= 0.041) laps. The heterogeneity in the speed variation increases as the kilometres progress with the greatest heterogeneity a
Table 1 Descriptive data (mean ± standard deviation) of marathon speed and heart rate per lap
| Laps | 0-5 km | 6-10 km | 11-15 km | 16-20 km | 21-25 km | 26-30 km | 31-35 km | 36-40 km | 0-40 km | %CoV (0-40 km) |
| Speed (km/h) | 11.14 ±1.32 | 11.51 ±1.27 | 11.57 ±1.34 | 11.32 ±1.39 | 10.94 ±1.56 | 9.75 ±2.21 | 9.04 ±2.16 | 9.12 ±1.58 | 10.5 ±1.4 | 4.5 ±2.7 |
| Heart rate (bpm) | 157.04 ±9.43 | 163.6 ±10 | 163.29 ±10.21 | 163.7 ±10.6 | 164.64 ±12.08 | 161.09 ±16.77 | 156.2 ±17.96 | 159.26 ±12.71 | 161.1 ±10.8 | 2.1 ±0.98 |
Note: %CoV: Percentage coefficient of variation. Source: author’s elaboration
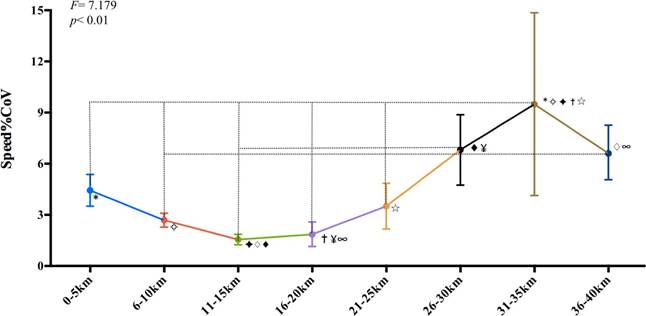
Figure 1 Mean and standard deviation of speed variation during the marathon. Significant differences (p< 0.001) between kilometer ranges marked.
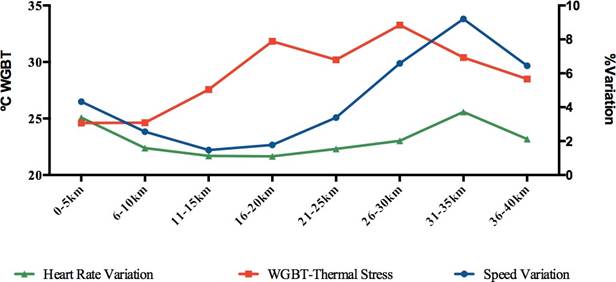
Figure 2, represents the statistical differences in the heart rate %CoV during the race laps (F= 4.069, p< 0.001). The heart rate %CoV was higher in the 31-35 km lap than the 11-15 km (p= 0.007) and the16-20 km (p= 0.006) laps; additionally, the heart rate %CoV was higher in the 0-5 km lap than the 11-15 km (p= 0.038) and 16-20 km (p= 0.033) laps. The heterogeneity in the speed variation increases as the kilometres progress with the greatest heterogeneity at kilometre 31-35. The variation of speed, heart rate and thermal index throughout the marathon is shown in Figure 3.
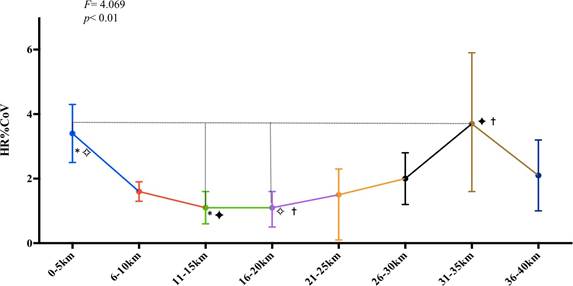
Figure 2 Mean and standard deviation of heart rate variation during the marathon. Significant differences (p<0.001) between kilometer ranges marked.
A significant correlation was found between the increase in temperature (WGBT) and the speed variation (r= 0.168; p= 0.049). Likewise, direct relationships were found between the total duration of the race and speed variation (r= 0.675; p= 0.003) and heart rate variation (r= 0.631; p= 0.007). Multiple stepwise regression showed that 61% and 37% of the finish time of the marathon was explained by the speed dynamics between kilometers 26-30 (r 2 = 0.611, β= 213.4, F= 26.165, p< 0.001) and by the heart rate variation between kilometers 31-35 (r 2 = 0.370, β= 230.9, F= 10.379, p< 0.001) respectively.
Discussion
The thermal index is a fundamental variable that could influence running performance during long-distance races (El Helou et al., 2012; Junge et al., 2016; Knechtle et al., 2019; Maughan et al., 2010). In this respect, it is necessary to study this aspect to improve the results in this difficult environmental condition. Thus, the purpose of the present research was to analyze the speed and heart rate variation in runners during a marathon in a hot environment (WGBT) in Costa Rica. Firstly, the average WGBT during the competition was 27.8 ± 3.52 ºC, reaching a maximum of 33.26 ºC. Related to sports science research, this WGBT is over the limits suggested by the American College of Sports Medicine ( Armstrong et al.,2007) (WGBT >28 °C) for safe physical exercise avoiding serious physiological complications. Therefore, it can be considered that the race was performed in an extreme environment.
Regarding the total finish time, the average value was 225 ± 37.61 min. This time was higher than those shown by Del Coso et al. (2013) who reported an average final time of 192 ± 33 min in a race of 42-km a warm environment (27°C and 27% relative humidity) and an altitude of 600-655 m. ( Trubee et al. 2014) indicate that the final marathon time for men was 255 ± 31 min and for women was 264 ± 25 min under a temperature of 26°C. It is also important to note that runners that recorded a slower average speed could have been exposed more time to a higher thermal index than the runners with a faster average speed. The first participants finished at a WGBT of 26.3 ºC, while the last participants finished at a WGBT of 30 ºC.
The coefficient of variation speed in this study was average 4.5%, which is lower than shown in previous research that found between 12-15% to 16.9 ±6.4% ( Haney 2010; Haney & Mercer, 2011). Also, a significant correlation was found between the speed coefficient of variation and the total time of the race (r= 0.675; p= 0.003), so a greater variation in speed dynamics provoked higher race finish time. In this respect, ( Haney 2010) found that the fastest runners had 20-second pace variations, while the slowest runners had near to 3-minute pace variations in 5-km periods.
More speed variation was observed in the 5-km laps after completing the half distance of the marathon, specifically in periods 26-30, 31-35 and 36-40 km. In fact, in this research, speed decreased from kilometer 26 to the kilometer 40 of the race, the running speed in the three last laps was less than 10 km/h (See Table 1). Likewise, 61% of the finish time of the marathon was explained by the speed variation between kilometers 26-30 (r 2 = 0.611, β= 213.4, F= 26.165, p< 0.001). These findings coincide with what was reported in previous studies (Ely et al., 2008; Santos-Lozano et al., 2014) where higher speed variations were observed in the last part of the competition. This dynamic is usually observed in endurance competitions such as marathons ( Ely et al.,2008; Renfree & Gibson, 2013). However, it is important to highlight that in this research, when almost all the runners completed the first half of the race (approximately 2 hours after starting the race), the WGBT exceeded the suggested limits for optimal physical performance ( Armstrong et al., 2007) (See Figure 3). Therefore, this factor may have influenced the decrease in running pace and the increase in the speed coefficient of variation of the second half of the marathon moreover to explain the slight correlation between an increase in speed coefficient variation with an increase in the thermal index (r= 0.168, p= 0.049).
Related to heart rate responses, the runners’ mean were found between 156 and 164 bpm, this is similar to those reported by ( Formenti et al. 2014) with 160 ± 5 bpm during a marathon cross-country skiing race of 42-km. Heart rate coefficient of variation in this research was 2.1 ± 0.9 % that is lower than the value obtained in 10 runners during a marathon with a heart rate CoV over 7% ( Billat, et al., 2009). It was also found that the variation in heart rate was related to a longer time to finish the competition (r= 0.631; p= 0.007). Heart rate may be associated with variations in running intensity and running technique during these stages of the race that cause changes in metabolic and cardiac responses ( Reis et al., 2011; Tartagura et al., 2012). Likewise, Figure 2 shows a greater variation in heart rate in the latter 5-km periods of the race in comparison with the earlier ones, specifically, after 21-km the heart rate CoV increased, showing this a similarity concerning the above-mentioned speed variation after the half-marathon. Environmental conditions such as humidity and heat, can cause cardiorespiratory alterations, these variations in heart rate affect performance during the event, mainly in the second half of the marathon ( El Helou et al., 2012; Flouris & Schlader, 2015; Junge et al., 2016; Maughan et al., 2012).
Both, the physical and physiological demands that these events imply for runners ( Del Coso et al., 2017; Lazzer et al., 2012; Millet & Millet,2012;, Rapoport 2010), combined with the high environmental conditions in which the race was carried out may cause manifestation of premature fatigue in the middle of the event. Dehydration is one of the main negative effects of long-distance running and its incidence is higher under hot environments. The loss of essential fluid and minerals (eg. sodium, potassium, and calcium) can cause neuromuscular dysfunction, specifically in speed nerve impulses and effective muscle contractions and therefore affects running speed ( Cheuvront et al., 2010; Maughan, 2010). Besides, blood biomarkers such as creatine kinase (CK), myoglobin, lactate dehydrogenase (ALT) are affected; these substances are released as a result of the damage suffered by muscle fibers ( Del Coso et al., 2013; Gutiérrez-Vargas et al., 2020; Rojas- Valverde et al., 2019). All these responses cause the runners to experience central and peripheral fatigue by decreasing their performance ( El Helou et al., 2012).
Finally, in races with a high thermal index, it is recommended to control the pace, with a slower start speed to maintain or increase it at the end of the race ( Trubee et al., 2014). The most common dynamic during a marathon is: (a) to run the first 5 km as fast as possible avoiding fatigue, then (b) decrease pacing to a speed that could be maintained between kilometers 10 and 25, then (c) decelerate slowly until kilometer 35th, and finally (d) increase speed in the last 5-7 km ( Diaz et al., 2018; Ely et al., 2008; Skorski & Abbiss, 2017).
Conclusion
A high thermal index is an important factor in running performance, especially in long- distance races and during endurance events due to the high mechanical and physiological load. Extreme temperature and humidity conditions provoke a higher variation in running pace and heart rate, and a decrease in performance reflected in the final finish time. Besides, the greatest variations in speed and heart rate were found in the last half of the race due to the influence of fatigue. Assessing internal load and pacing performance between kilometers 26 to 35 seems to be fundamental in marathon running.
Practical applications
From the results obtained in the present study, different practical applications should be considered:
Maintaining a certain pace throughout the race produces better performance in the marathon.
It is advisable to train with the same temperature and humidity conditions as those where the marathon will be held to delay the fatigue effect.
A “J” strategy (start at a lower speed and finish at a faster speed) is recommended to complete the race in optimal conditions.
Some strict fluid and food intake protocols should be performed before, during and after a race made under hot conditions to reduce internal and external load.
After-race recovery protocols may be effective to avoid serious complications when running under hot conditions.

