


 English (pdf)
 Article in xml format
 Article references
 Send this article by e-mail
 Cited by SciELO
  Similars in
SciELO
Similars in
SciELO 
 Permalink
1. Introduction
The banana is a tropical fruit that is grown in more than 130 countries. It is the second most-frequently produced fruit after citrus, contributing about 16% of world fruit production, and is the fourth most important food crop after rice, wheat, and corn (Alzate-Acevedo et al., 2021). Statistics show that 119.83 million tons were produced worldwide in 2020 with India (30.46 Mt), China (12.00 Mt), Indonesia (7.28 Mt), Brazil (6.81 Mt) and Ecuador (6.58 Mt) are the top five producers (Statistica, 2020). According to the United Nations' Food and Agriculture Organization (2020) report, banana production has grown significantly, and in Ecuador, whole bananas and their derivatives represent 51% of the agricultural output and 1.91% of the total Gross Domestic Product (GDP) (Corporación Financiera Nacional, 2022). The nation's companies reported two billion dollars in revenue from January to July 2019 (Ibarra-Velásquez, 2020).
This activity requires the use of large tracts of land and has negative impacts on soil, air, and water resources. It is, therefore, necessary to apply sustainable production methods with which to combat the adverse effects of agriculture on the different ecosystems (Ramos-Ramos et al., 2020). It has been suggested that an excellent way in which to deal with the environmental damage and overuse of natural resources caused by current economic growth is by means of a ''circular economy'' (CE) (Lieder et al., 2017). The CE has been adopted in order to counter the linear economic model, and focuses on transforming how products are designed and consumed (Khanna et al., 2022).
According to Sehnem et al. (2019) , this concept of the CE manages raw materials sustainably. However, as argued by McDonough and Braungart (2010) , its conceptual basis goes beyond building a systemic approach, and it also contributes to maximizing environmental, economic and social benefits. It even addresses significant current challenges, such as the scarcity of resources, the loss of biodiversity, and increasing waste and pollution (Khanna et al., 2022). Circular approaches promote the "3 Rs" in order to combat these challenges: reduction (demand and/or consumption of resources, materials, and products), reuse, and recycling (return of materials to another life cycle) (Diéguez-Santana et al., 2021; Reichel et al., 2016). The CE focuses on how products and services can be reintroduced into the system as biological or technical resources (Acosta-Pérez et al., 2020). This is a strategic model that allows the reduction of both the input processes of virgin materials and the production of waste, thus closing the "loops" or economic and ecological flows of the resources necessary for production (Carrillo-González & Pomar-Fernández, 2021; Diéguez-Santana et al., 2020).
In the framework of agri-food chains, EC approaches have been widely discussed in the scientific community (Esposito et al., 2020; Hamam et al., 2021). Although it is complex to establish a single CE model, the analysis of different material and energy cycle flows has been deployed at three circular levels (enterprise, regional, and societal) (Kyriakopoulos et al., 2019). At the national level, research has focused on various agri-food chains. For example, Bravo Mendoza et al. (2020) identified opportunities for improvement within the CE in various agri-food chains in the province of Manabí. Recently, Diéguez-Santana et al. (2022) proposed perspectives for progress based on the CE for the agri-food chain of the pitahaya sector in Ecuador, focused on reducing and valorizing food losses and waste. Challenges and possible solutions for banana production stages have been addressed by Gehring et al. (2020) , who examined the most critical strategies that could be applied in order to introduce the circular economy approach into the Piura region (Peru). In addition, the literature has highlighted the need for reliable metrics to validate circular strategies, measuring the degree of circularity (Stillitano et al., 2022). Also, it has emphasized the barriers to the implementation of circular supply chains, pointing out the lack of knowledge about the circular approach (Shang et al., 2022).
In this wide and complex context, this research provides to scientific community with an empirical study about the evaluation of circularity in an agri-food chain, from the exhaustive diagnosis of the chain, to the generation of prospective improvements based on the use of the waste. In this sense has been created a framework for an optimized economic cycle that can conserve resources and minimize farmers' capital investments while increasing production, with a focus on the waste and by-products of the process. For this, Section 2 describes the methodology used. Section 3 provides the main results, which include the diagnosis of the banana chain in Ecuador, the prediction of the level of circular economy, the comparative analysis with other similar chains and the prospect of improvement. Finally, the conclusions are provided in Section 5.
2. Methodology
The CE tool described in Diéguez-Santana et al. (2021) was used to calculate the CEL for the complete chain and each of its j actors (CEL j ), where j=1…46. The other variables considered in the study are shown in Figure 1.
Let E j be the nominal variable that indicates the link in the chain to which actor j belongs and takes values from 1 to 4 in order to identify the links Supplier, Producer-Collection Center, Manufacturer, and Commercialization-Sales, respectively. Furthermore, let D 1j , D 1j , D 2j … D 9j be the ordinal variables that determine the median of the items that make up each dimension i of the instrument discussed previously.
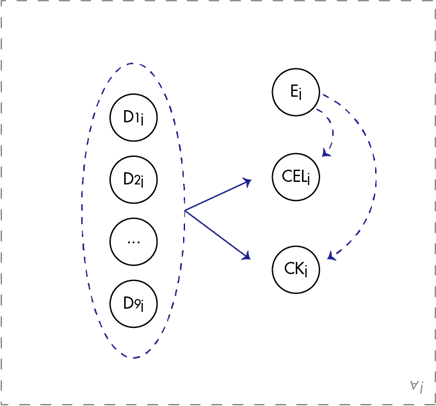
Expressions 1 and 2 were then used to discover the variables CEL j and CEL. In this case, CEL was the average of the performances of all the actors in the supply chain.
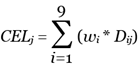 (1)
(1)
 (2)
(2)
The specific weights of each dimension within the CEL variable (w i ) were determined using the Hierarchical Analysis Process (HAP) (Saaty, 1987). The comparative scale from 1 to 9 suggested by this method was considered (Leal, 2020; Saaty, 1987). The inconsistency ratio does not exceed the value of 0.10. Otherwise, the opinions and judgments should be reevaluated (Osorio-Gómez & Orejuela-Cabrera, 2008).
In addition, the variable Ck j was added as a nominal variable indicating the cluster to which actor j belonged. The variables D 1j , D 1j , D 2j … D 9j were used to form clusters. First, the number of seats to be formed was explored using a hierarchical procedure, whose analysis focused on the Clustering History tables resulting from combining different clustering methods and different distance measures. The most significant jump in clustering coefficients was detected, suggesting the number of clusters formed. A non-hierarchical procedure, the k-means approach, was subsequently applied in order to determine the membership clusters for the actors (IBM, 2020; Martino et al., 2019). This procedure considered the history of iterations, the centers of the final sets, and the number of actors per cluster. The Kruskal-Wallis (k > 2 clusters) and Mann-Whitney (k = 2 clusters) non-parametric tests were used to validate the clusters formed.
It is presumed that the link to which the actors (E j ) belong has an impact on the level of circular economy (CEL j ). This was developed by employing the non-parametric Kruskal-Wallis test.
First assumption: There were no significant differences among the medians calculated for the variable CEL j as regards the links in the agri-food chain (E j ).
Also, this result was validated by assuming that E j affects cluster formation (Ck j ).
Second assumption: The variables E j and Ck j are independent of each other.
The contingency table procedure was used, in which Pearson's chi-square statistic was used to assess freedom, and Cramer's V statistic was used to determine the strength of the relationship (Akoglu, 2018; Cramér, 2016). This procedure was carried out in order to control for compliance with the assumption that the number of expected frequencies was less than five and was not greater than 20% of the total frequencies in the table (Cochran, 1952; Pardo-Merino & Ruiz-Díaz, 2005). The Monte Carlo method was used to discover the significance levels of the statistics. This method is accurate even when the data does not meet all of the typical assumptions of the asymptotic method (i.e., a sufficiently large sample size, a balanced or sparse table) (IBM, 2020).
The prediction of CEL was then determined using MLTs. SVM and NN were specifically used to predict the level of circular economy: SVM regression (radial, linear and polynomial kernel) and NN, according to Muñoz et al. (2020) .
3. Results
3.1 Diagnosis of the circular economy level
The checklist was then applied to identify the level of circular economy of the chain under study. The value of the chain indicator was found to have a medium level with a metric of 2.69. Some of the variables with the most flaws are the source or supply of materials (with a mean of 2.63), followed by design (with a mean of 2.66), the economic circle (with a mean of 2.68), collection (with a mean of 2.69), distribution and sales (with a mean of 2.72), manufacturing (with a mean of 2.83), and design (with a mean of 2.88).
The CEL for the agri-food chain was 2.69, which was evaluated as being a medium value. The main descriptive statistics for this variable are shown in Table 1, which illustrates a shift toward low performance by the actors in the chain. The standard deviation, minimum, and maximum values show how different the versions were.
Table 1: Displays descriptive statistics for CEL variable.
| Statistic | Mean | Median | Standard deviation | Minimum | Maximum |
|---|---|---|---|---|---|
| Value | 2.69 | 2.88 | 0.69 | 1.00 | 4.26 |
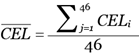
When the CEL variable was filtered by chain link, it was found that the links behaved similarly in terms of mean values, with the Supplier link attaining the greatest diversity as regards the performance of the actors owing to its high variability (Figure 2).
The Kruskal-Wallis non-parametric test yielded a sigma value of 0.887, which suggested that there were no significant differences between the medians in terms of CEL (Table 2). The similarity of ranks demonstrates this decision, corroborating the analyses performed using the box plots above.
Table 2: Results of the Kruskal-Wallis Test.
| Link | n | Average rank | Kruskal-Wallis test | ||
|---|---|---|---|---|---|
| CEL | Supplier | 11 | 24.45 | Kruskal-Wallis test H | 0.641 |
| Producer-Gathering Center | 20 | 22.00 | gl | 3 | |
| Transformer | 6 | 23.00 | Asymptotic sig | 0.887 | |
| Marketing-Sales | 9 | 26.00 |
The results of the hierarchical procedure in cluster formation are summarized in Table 3. It was deduced that combinations of various clustering methods with different distance measures coincided in suggesting two and three clusters.
Table 3: Summary of the hierarchical procedure for cluster formation.
| Clustering Method | Distance measure | Number of clusters |
|---|---|---|
| Nearest neighbor | Euclidean distance squared | 4 |
| Blocks | 5 | |
| Nearest neighbor | Euclidean distance squared | 2-3 |
| Blocks | 2-3 | |
| Ward's linkage | Euclidean distance squared | 2-3 |
| Blocks | 2-3 |
The non-hierarchical k-means procedure was then used to form two and three clusters (K=2 and K=3). The results for two sets indicated that convergence was reached quickly in the third iteration. The number of players was 28 and 18 for clusters 1 and 2, respectively (Table 4). Cluster 1 was determined to be composed of stakeholders with a superior performance when compared to those in Cluster 2, with the exception of the sustainability dimension, which did not contribute to discriminating between these two clusters.
Table 4: Summary of the hierarchical procedure for cluster formation.
| Iteration history | Final centers of the clusters | Actors by cluster | |||||
|---|---|---|---|---|---|---|---|
| Iteration | Change in cluster centers | Variable | Cluster Variable | ||||
| 1 | 2 | 1 | 2 | 1 | 2 | ||
| 1 | 3.137 | 3.308 | Source of supply | 3 | 2 | 28 | 18 |
| 2 | 0.075 | 0.111 | Design | 3 | 2 | Total=46 actors | |
| 3 | 0.000 | 0.000 | Manufacturing | 3 | 2 | ||
| Economic circle | 3 | 2 | |||||
| Distribution and sales | 3 | 2 | |||||
| Consumption | 3 | 2 | |||||
| Reuse | 3 | 2 | |||||
| Remanufacturing | 3 | 2 | |||||
| Sustainability | 3 | 3 |
The non-parametric Mann-Whitney U test revealed that the two clusters formed differ significantly in terms of medians in all survey dimensions.
The results for three clusters indicated that convergence was reached quickly in the third iteration (Table 5). Cluster 1, which was composed of low-performance actors, was identified as having scores of between 1 and 2. Cluster 2, which contained medium-performance actors, obtained median scores of 2 and 3. Cluster 3, which obtained scores of 3 in all dimensions, was consequently that which performed best. All of the above was obtained for 5, 17, and 24 actors per cluster, respectively.
Table 5: Summary of the k-means procedure for three clusters (K=3)a.
| Iteration history | Final centers of the clusters | Actors by cluster | ||||||||
|---|---|---|---|---|---|---|---|---|---|---|
| Iteration | Change in cluster centers | Variable | Cluster variable | |||||||
| 1 | 2 | 3 | 1 | 2 | 3 | |||||
| 1 | 2.318 | 3.239 | 2.822 | Source of supply | 1 | 2 | 3 | 5 | 17 | 24 |
| 2 | 0.518 | 0.214 | 0.073 | Design | 1 | 3 | 3 | Total=46 actors | ||
| 3 | 0.000 | 0.000 | 0.000 | Manufacturing | 2 | 2 | 3 | |||
| Economic circle | 1 | 2 | 3 | |||||||
| Distribution and sales | 2 | 2 | 3 | |||||||
| Consumption | 2 | 2 | 3 | |||||||
| Reuse | 1 | 2 | 3 | |||||||
| Remanufacturing | 1 | 2 | 3 | |||||||
| Sustainability | 2 | 3 | 3 |
The non-parametric Mann-Whitney U test revealed that the three clusters formed differ significantly in terms of medians in all survey dimensions.
The contingency table procedure was repeated for two and three clusters in order to determine a relationship between the membership cluster variables and the chain-link variable. Table 6 showed that the clusters formed are not linked to the supply chain link variable.
Table 6: Contingency table procedure.
| Statistic | K=2 | K=3 | ||||
|---|---|---|---|---|---|---|
| Value | df | Sig. Monte Carloa | Value | df | Sig. Monte Carloa | |
| Pearson's chi-square | 3.738 | 3 | 0.315 | 2.545 | 6 | 0.886 |
| Likelihood Ratio | 4.298 | 3 | 0.263 | 3.140 | 6 | 0.791 |
a Based on 10,000 sample tables with a starting seed of 329836257.
The above results are equivalent to each other and allow us to conclude that the performance of the actors in terms of CEL does not depend on the link in the chain in which the actor is located. Hence, the strategy to be designed will be general for the entire chain, but not specific by each link.
3.2 Predicting the circular economy
Two prospective techniques were used in order to predict the level of the economy that the chain being studied would have: SVM and NN. The former identified the input variables (the nine variables) and output variables (CEL). It took 70% of the data to test the model, and another 30% of the data to validate it.
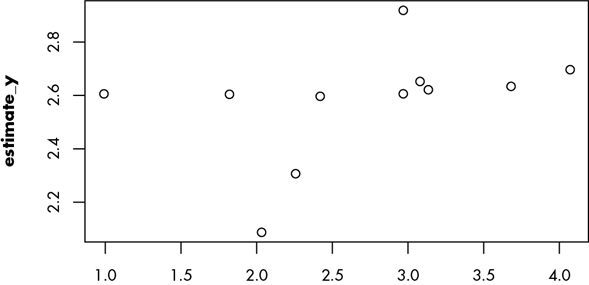
SVM Regression Radial Kernel: The execution time of the SVM learning algorithm was 3 seconds. This demonstrated the performance of the second with regard to time. The estimated results of the resulting variable indicated that the vector model would perform better estimates of the input variables in the initial layer. In order to evaluate the SVM model, 30% of the data, which was not part of the machine training, was used. This model was then employed to estimate the values using the process described above. The Spearman correlation coefficient was calculated to ensure that the data were as similar and as close as possible. These estimators were then compared to the real values. With regard to the correlation, the chain results were 0.405, which is low (Figure 3).
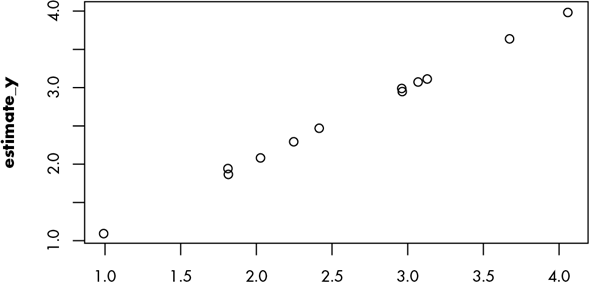
SVM regression - Linear Kernel: The application conditions of the technique were similar. With regard to the correlation of the SVM-Linear Kernel model, the result of the chain was 0.999, which is high (Figure 4).
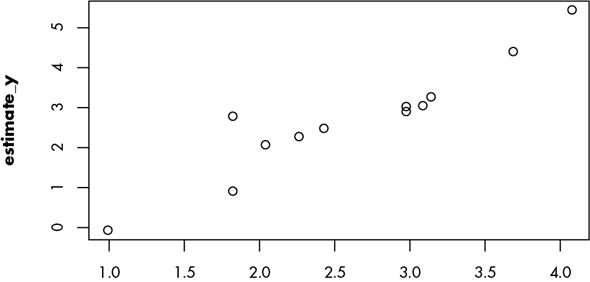
SVM Regression Polynomial Kernel: The application conditions of the technique were similar. With regard to the correlation of the SVM for the Regression-Polynomial Kernel model, the chain result was 0.931, which is high (Figure 5).
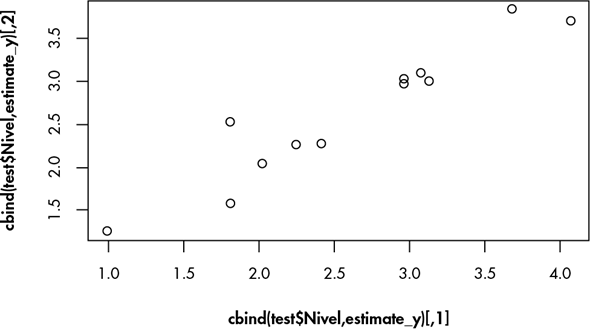
The data in which each of the variables is passed to each input neuron is known as the output. This calculation was performed for each NN neuron. The real and estimated values corresponded to 30% of the data used to test the model. There were some negative estimators, which were preliminary results, and the ranges had to be adjusted. With regard to the correlation of the NN model for regression, the chain results were 0.953, which is high (Figure 6).
These four estimation tools were applied, which made it possible to obtain Spearman's correlation coefficients (ρ) (Table 7).
Table 7: Results of the correlation coefficients of the methods.
| Methods applied | ρ |
|---|---|
| SVM Radial Kernel | 0.405 |
| SVM Linear Kernel | 0.999 |
| SVM Polynomial kernel | 0.931 |
| NN | 0.953 |
Of the four estimation tools, three are robust, as stated by Muñoz et al. (2020) , because they have a value higher than 0.90. However, the strongest is the SVM for the regression-Linear Kernel, which has a coefficient closer to 1, which is the highest of all. This implies that the most reliable predictions are related to this model.
3.3 A comparative analysis of the application of the circular economy to other production chains
Table 8 shows the analysis of the evaluation results of the CE when compared with other cases of the application of the tool to agri-food chains. These studies focus on other sectors in Ecuador and Mexico, such as the conventional cocoa (Diéguez-Santana et al., 2021), the organic cocoa chain (Bravo-Mendoza et al., 2020), the coconut chain in Ecuador (Camacho-Vallejo et al., 2022) and the pitahaya chain, which was recently studied in the Amazon, Ecuador (Diéguez-Santana et al., 2022). The overall results (total of the nine indicators) presented in this production chain (2.69) are higher than those of the organic cocoa and coconut chains in the province of Manabí, and than the evaluation of the pitahaya chain in the Amazon, Ecuador, although lower than the evaluation carried out for the cocoa chain in Mexico, which recorded a value of 2.98.
The values for each indicator are slightly higher than those for the chains above, which have lower values. However, the sustainability indicator is higher for the cocoa in the Mexican and Ecuadorian chains. The source or supply (2.63) and re-manufacturing (2.93) indicators are also higher than in previous studies. However, these are still low values, with no indicator scoring 3 out of 5 points. Furthermore, the design criterion is exceeded in the Manabí cocoa chain (2.69 vs. 2.66). With regard to distribution and sales, the cocoa chains (Manabí and Mexico) exceed the indicator results (3.23 and 2.98 vs. 2.72 points).
Although some indicators have attained better results than in other studies, there are many difficulties in the activity that must be analyzed in order to improve income and environmental sustainability. Some strategies with which to boost the CE in banana crops in the province are presented in the following section.
Table 8: Comparison of the results of this study with other cases in which the CE in agri-food chains was evaluated.
| No | Criteria | Conventional cocoa chain, Mexico | Organic cocoa, Manabí, Ecuador | Coconut chain, Manabí | Pitahaya, Ecuador | Banana, Manabí |
|---|---|---|---|---|---|---|
| Reference | (Diéguez Santana, Rodríguez Rudi, et al., 2021) | (Bravo Mendoza et al., 2020) | (Camacho-Vallejo et al., 2022) | (Diéguez Santana et al., 2022) | This work | |
| 1 | Source of supply | 2.54 | 2.06 | 1.09 | 1.72 | 2.63 |
| 2 | Design | 2.25 | 2.69 | 1.4 | 1.93 | 2.66 |
| 3 | Manufacturing | 2.8 | 1.3 | 1.81 | 2.6 | 2.83 |
| 4 | Economic circle | 3.5 | 2 | 2.39 | 2.45 | 2.68 |
| 5 | Distribution and sales | 3.23 | 2.98 | 1.39 | 1.75 | 2.72 |
| 6 | Consumption | 3.22 | 1.19 | 1.46 | 2.2 | 2.69 |
| 7 | Reuse | 2.94 | 1.64 | 1.3 | 2.1 | 2.88 |
| 8 | Remanufacturing | 2.8 | 1 | 1.01 | 1.75 | 2.93 |
| 9 | Sustainability | 3.5 | 4.03 | 2.21 | 2.75 | 2.94 |
| - | Total (9 indicators) | 2.98 | 2.1 | 1.56 | 2.14 | 2.69 |
3.4 Prospective for improving CE in Ecuador's banana production chain
The difficulties encountered in the evaluation of the CE make it necessary to address strategies with which to improve the production chain of the banana sector in Ecuador. It is necessary to transform the waste and by-products of the process into value-added products, and options by which to increase the value of waste could, therefore, be strategies to consider with the CE approach. This includes the application of emerging technologies since, as argued by Negroiu et al. (2021) , increasing the value of residues through the use of technologies does not lead to the destruction of nutrients or other valuable components and they can, therefore, transformed into value-added products, thus minimizing losses by converting them into resources.
In the case of bananas, the entire production process, from the agricultural stage to processing, leaves fractions of unused waste. For example, in the processing plants where bananas are sorted and packed, fruit that has not reached an optimal state of maturity and adequate size, or has slight bumps or bruises, insect bites, and stains, is discarded and added to the losses of the harvesting process (Bhushan et al., 2019). Other significant fractions in the banana industry include waste, including the loss of roots, stems, leaves, or any other part of the plant that is not used during processing. These are made up of lignin, cellulose, pectin, and hemicellulose (Velasteguí et al., 2017). Table 9 shows the chemical composition of the main residues derived from the process.
Table 9: Chemical composition of banana processing wastes.
| Components | Peel | Pseudostem | Rachis | Banana pulp |
|---|---|---|---|---|
| % In Dry basis | ||||
| Starch | 0.78 | 18.4 | ||
| Protein | 4.77 | 4.3 | 3.1 | |
| Lipids | 1.15 | 0.62 | ||
| Lignin | 6-12 | 5.2% | 6.0 | |
| Cellulose | 7.6-9.6 | 35.3% | 35.3 | 0.8 |
| Hemicellulose | 6.4-9.4 | 24.9% | 17.9 | |
| Carbon(C) | 38.3 | |||
| Hydrogen(H) | 3.88 | |||
| Sulfur(S) | 0.58 | |||
| Calcium(Ca) | 0.36 | |||
| Phosphorous (P) | 0.23 | 0.13 | ||
| Zinc(Zn) | 0.17 | |||
| Ash | 1.71 | 28.3 | 28.5 | 0.53 |
| Reference | (Mahindrakar & Rathod, 2018) | (Alzate Acevedo et al., 2021) | (Florian et al., 2019) | (Martins et al., 2019) |
All these fractions generated in the banana industry contain essential nutrients for incorporation into value augmentation processes. Some of them range from biofuels, organic fertilizers, biomaterials for wastewater treatment, and bioplastics, including the production and application of nanomaterials, which can be implemented using a circular economy approach. Table 10 shows the main recovery processes that can be applied to each type of waste from the banana industry.
Table 10 Recovery processes applied to banana industry waste.
| Type of waste | Type of product | Scale of study | Relevant results | Reference |
|---|---|---|---|---|
| Organic fertilizers | ||||
| Pine sawdust and mango peel and Musa spp. | Bokashi | Pilot | Waste in piles (1:1:1 ratio) were turned daily for the first ten days to maintain the temperature of 70 °C. The decomposition process lasted 21 days. Bokashi had an electrical conductivity of 8.97 mhos/cm, potassium content of 4.3 mg/kg bokashi and sodium content of 161.0 mg/kg | (Mendivil-Lugo et al., 2020) |
| Fruit peel, Pseudostem and leaves of Musa Paradisiaca | Vermicomposting | Industrial | The earthworm Eudrilus eugeniae was introduced into the shredded waste. The best result as regards the chemical composition of the prepared vermicompost was N-17.21% , P-10.24%, K-48.32% and a C/N ratio of 29. | (Mahmud et al., 2019) |
| Municipal waste, peel, and pulp of Musa spp. | Compost | Pilot | Microorganisms were inoculated with cow dung and 2 cm waste in 170 L containers with 50 kg of solid waste. The final product had nutrient values of N-2.13%, P-0.57%, K-7.68%, Ca-16,000 mg/kg, Mg-14,600 mg/kg, Fe-113 mg/kg, Cu-89 mg/kg and Zn-154 mg/kg. | (Devi & Mugilvannan, 2018) |
| Municipal waste, peel and pulp of Musa spp. | Black soldier fly composting | Pilot | Pretreatment of banana peel with Hermetia illucens. The peel was homogenized and mixed with ethanol, methanol, chloroform, and nitrogen. The mixture containing nitrogen produced the highest final larval weight (134 mg). | (Isibika et al., 2019) |
| Biofuel | ||||
| Banano Cavendish rachis and peel | Bioethanol | Laboratory | Banana peel and rachis subjected to an alkaline hydrolysis process with NaOH were fermented. The ethanol obtained had an average pH of 4.16 and a Brix of 3.75, with a concentration of 29 degrees alcohol and a distillate flow rate of 8.3 mL/s. | (Adrianzen-Fiestas, 2018) |
| Musa acuminata pseudostem, rachis. | Biogas | Laboratory | An anaerobic bioreactor was fed with ripe banana peel. After 8 h, 1 L of gas was obtained in the sampling system. (CO2 concentration of 99.97%). | (Romero et al., 2017) |
| Pilot plant | Residues (pseudostem and rachis) underwent anaerobic digestion followed by steam explosion pretreatment. A yield of 363.29 L of CH4 /kg of residue was obtained. | (Durán-Hernández, 2020) | ||
| CáscaradeplátanoytallodeMusaspp | Biodiesel | Laboratory | Cryptococcus sp. was grown on pretreated banana peel, and its lipid accumulated up to 34.0%. The lipid had a high degree of monounsaturation, which gave the resulting biodiesel better quality | (Han et al., 2019) |
| Musa paradisiaca Peel | Hydrogen | Laboratory | Banana peel and brewery wastewater in a batch bioreactor. The maximum hydrogen production yield (408.33 mL H2 /L wastewater) was achieved from the substrate, consisting of 50% of the weight pretreated with 1 g/L plantain peel for two hours and 50% medium standard. | (Al-Mohammedawi et al., 2019) |
| Cavendish peel | Biochar | Laboratory | Slow pyrolysis (T=356.1 °C and heating rate of 14.7 °C/min). The biochar yield was 58.8 % (O/C ratio 0.289). | (Te et al., 2020) |
| Biomaterials for wastewater treatment | ||||
| Musa Acuminata peel | Coagulant | Laboratory | The dried husks were soaked with distilled water and agitated at 120 rpm for one hour. The coagulant was highly effective at removing turbidity from synthetic wastewater, with a removal efficiency of 88% at pH 1.0 conditions and a dosage of 100 mg/L. | (Mokhtar et al., 2019) |
| Musa AAB Pseudo stem | Biofilters | Laboratory | The biofilter was made from cellulose and holocellulose extracted from pseudo stem. The biofilter was able to remove organic contaminants with an efficiency of between 70.4 and 84.2%. | (Zaman et al., 2020) |
| Musa paradisiaca rachis | Activated carbon | Laboratory | Charcoal from banana rachis had a chromium removal efficiency of 99.8% at pH 6.7. In addition, the biological oxygen, biochemical, chemical oxygen demand, and chloride reduction efficiencies were 97%, 93% and 60%, respectively. | (Payel et al., 2018) |
| Musa spp peel | Biosorbent | Laboratory | The husk was ground to a particle size of 2 mm and dried. An oil removal efficiency of over 96% was achieved from the wastewater. | (Okologume & Olayiwola, 2019) |
| Musaspp peel | Ceramic membrane | Industrial plant | The husk was ground, mixed in a mold subjected to 88 MPa and screened at 150 µm. Tanning contaminants, turbidity, dye content, suspended solids, and BOD were reduced. | (Mouiya et al., 2019) |
| MusaSapientunPseudo stem | Biosorption | Laboratory | Dried pseudo stems achieved removals of oxygen demand of 88%, ammonia nitrogen 84%, suspended solids 83%, turbidity 75%, color 67%, and oil and grease 68%. | (Daud et al., 2017) |
| Bioplastics | ||||
| Musa spp Pseudo stem | Cellulose/ biodegradable film | Laboratory | Cellulose film decomposed in soil in four weeks, indicating excellent biodegradability when compared to polystyrene (PE) plastic films. | (Ai et al., 2021) |
| Musa Paradisiaca peel | Starch/ biodegradable planting bag | Laboratory | The biodegradable plastic degraded quite rapidly, with an average percentage weight loss of 65.1 % in eight weeks. | (Huzaisham & Marsi, 2020) |
| Musa Paradisiaca peel | Starch/ Polyhydroxyalkanoate (PHA) | Laboratory | Banana starch was added to potential PHA producers. Geobacillusstearothermophilus accumulated 84.63% PHA in 96 h. Bacillus subtilis accumulated 71.78% PHA in 24 h of incubation. Bacillus siamensis accumulated 77.55% and Staphylococcus aureus had about 70.02% PHA in 24 h of incubation. | (Rayasam & Kumar, 2018) |
| Musa Paradisiaca peel | Starch/ Bioplastic | Laboratory | The bioplastic film can support a weight of close to 2 kg with sufficient traction and strength. The fabricated bioplastic can be used as a packaging material or for transportation. | (Chandarana & Chandra, 2021) |
| Production and application of nanomaterials | ||||
| Musa balbisiana Leaves | Silver nanoparticles/ Microwave assisted biosynthesis | Laboratory | The particle size was 80 to 100 nm and was crystalline. The nanoparticles were effectively used in anticancer study activities. | (Mohammadlou et al., 2016) |
| Musa balbisiana Leaves | Silver nanoparticles/ Green Synthesis | Laboratory | Silver nanoparticles synthesized by the green method exhibited an absorption maximum of 410 nm. Nanoparticle micrographs indicated spherical silver nanoparticles with a size range of 20 to 300 nm. | (Khan et al., 2019) |
| Musa spp. shells and pseudostems | Nanosilica/composite polymer | Laboratory | Banana fibers (5 wt.%) with 0.1 wt.% nanosilica fillers were used. The polymer had a density of between 0.8 and 1.5 g/cm3 and a hardness of 50 to 92 on the Rockwell scale. | (Rahul et al., 2017) |
As can be seen, the conventional processes in Table 10 show that different types of organic fertilizers can be implemented, such as Bokashi, Vermicomposting (which can include various types of worms), conventional composting processes, or the use of the Black Soldier Fly. The high content of carbohydrates and cellulose in some fractions facilitates the occurrence of these processes, coupled with the availability of waste that is sometimes high. Another application is focused on the production of biofuels. These include biochemical (alcoholic fermentation, anaerobic digestion), chemical (transesterification), or thermochemical (gasification, pyrolysis) routes, the main products being bioethanol, biogas, and biodiesel, hydrogen, and coal, among others. With regard to their use as biomaterials for wastewater treatment, as shown in Table 10, the main benefits include coagulants (coagulation-flocculation), filter beds (biofilters), and adsorption/biosorption (activated carbons, biosorbents), or systems with membrane separations (ceramic membrane). This shows the diversity of applications in this context that could be implemented in order to increase the value of the waste produced by this agri-food chain.
Furthermore, the high content of organic compounds that are rich in carbon (polysaccharides) allows fractions such as banana peel to be used to obtain bioplastics. Similarly, the fibrous composition of banana pseudo stem reduces the biodegradation time required for the processes employed to obtain bioplastics. Moreover, the leaves of the plant have been used to produce biodegradable packaging and utensils. The composition of these process fractions (leaves, rachis, pseudo stems, and banana peel) has recently attracted the attention of those interested in nanotechnological processes, mainly in the production of green nanoparticles (e.g., the biosynthesis of silver nanoparticles). As shown, banana residues have a high potential for utilization and can be sources of raw materials to be reused in various value-increasing processes. In addition, it closes production cycles and reduces the amount of banana industry waste that builds up, because it can be used in many different ways, which helps the circular economy grow.
4. Conclusions
In this research, the banana agri-food chain was selected as a case study with which to evaluate the potential of implementing the CE. Plantain production in the province of Manabí is one of the main economic activities in the coastal region of Ecuador. Bananas are a primary staple food and are one of the main dishes in the traditional cuisine. Key actors in the implementation of CE concepts in this system could, therefore, play an essential role in the agri-food chains on the Ecuadorian coast.
The result of CE of this study was medium (2.67 points out of 5), which indicates that there are several difficulties in the chain in the region and that improvements are required in the agri-food management of the sector. All nine indicators had a medium level (≥2.6 points). In addition, four MLT were applied: an SVM for regression (radial, linear, and polynomial kernels), and an NN. SVM Regressions with linear and polynomial kernels and NN were demonstrated to be reliable and produce robust predictions (Spearman correlation coefficient > 0.9). The results are comparable with other studies on the application of the evaluation tool, and the results obtained were superior to those obtained for the organic cocoa and coconut chains in Manabí and pitahaya in Morona-Santiago, Amazon, Ecuador. However, they were lower than those for the cocoa chain evaluated in Mexico.
Also, some options are proposed in order to take advantage of the large amounts of waste generated in the banana production system. These could be used in various value-increasing processes, ranging from organic fertilizers, biofuels, materials for wastewater treatment, and the production of bioplastics and nanoparticles, and could be implemented using the circular economy approach. However, many of them require further research focused on the conditions of cultivation in the province. This will hopefully help people better understand the concept of CE in the sector, and biomass value-increasing methods should be used to help the country grow and become more environmentally friendly.
Finally, this study may be of interest to researchers, entrepreneurs, and government agencies. The research contributes with an empirical study, whose results and methodology can be used by government institutions for the development of policies aimed at strengthening the concepts of circular economy in the value chains of the region and the country. The results can be used by other researchers and entrepreneurs who wish to establish alternatives for the recovery of banana residues or other similar products, based on an exhaustive diagnosis of the current situation.

