


Services on Demand
Journal
Article
 English (pdf)
 Article in xml format
 Article references
 Send this article by e-mail
Indicators
-
 Cited by SciELO
 -
 Access statistics
Related links
-
 Similars in
SciELO
Similars in
SciELO
Share

 Permalink
Revista Geológica de América Central
On-line version ISSN 0256-7024Print version ISSN 0256-7024
Rev. Geol. Amér. Central n.52 San Pedro de Montes de Oca Jan./Jun. 2015
Application of "shallow-water" numerical models for hazard assessment of volcanic flows: the case of titan2d and Turrialba volcano (Costa Rica)
Aplicación de modelos numéricos de "aguas someras" para el análisis de peligros de flujos volcánicos: el caso de titan2d y el volcán Turrialba (Costa Rica)
Abstract
This paper introduces Titan2D, a depth averaged model of an incompressible Coulomb continuum for "shallow water" granular flows. Titan2D has been used successfully at many volcanoes to predict inundation by block-and-ash flows and debris avalanches. It can be run as a stand-alone program or through Vhub, a cyber-infrastructure platform. Practical considerations of choosing appropriate user inputs and the basics of running the model are discussed herein. Both synthetic and natural terrain examples are presented, including simulations of a block-and-ash flow generated from the gravitational collapse of a synthetic dome at Turrialba volcano (Costa Rica). These results suggest that the model should be limited to simulate cases of dense volcanic granular flows, like those produced by gravity-driven dome collapse events, but cannot be used to simulate dilute pyroclastic density currents. Finally, estimation of the Ti-tan2D resistance terms by using empirical relationships provides a good method for reducing model input uncertainties.
Keywords: Numerical modeling, Titan2D, Turrialba volcano, shallow-water equations, volcanic hazards, hazard assessment, debris avalanche, block-and-ash flows.
Resumen
Este artículo introduce Titan2D, un modelo de aguas someras para flujos granulares incompresibles tipo Coulomb. Titan2D ha sido utilizado extensamente para predecir la inundación de flujos block-and-ash y avalanchas de detritos. Puede funcionar como un programa separado o en la plataforma computacional Vhub. Aquí se discuten consideraciones prácticas para escoger valores de entrada apropiados y las bases para correr el modelo. Se presentan ejemplos de terrenos sintéticos y naturales, incluyendo simulaciones de un flujo block-and-ash generado en el volcán Turrialba (Costa Rica). Los resultados sugieren que el modelo debe ser utilizado en la simulación de flujos granulares densos, como aquellos producidos por eventos de colapso gravitacional de domos volcánicos, pero no puede ser ocupado para simular corrientes de densidad piroclástica diluidas. Finalmente, la estimación de los términos de resistencia de Titan2D ocupando relaciones empíricas constituye un buen método para reducir incertezas en los parámetros de entrada del modelo.
Palabras clave: Modelación numérica, Titan2D, volcán Turrialba, ecuaciones de aguas someras, peligros volcánicos, análisis de peligros, avalancha de detritos, flujos block-and-ash.
Introduction
Numerical simulation of volcanic gravity currents such as pyroclastic flows and lahars is fundamental to better understand the key conditions that control flow behavior and to improve the hazard assessment. Since fully three-dimensional models of granular gravity currents are severely limited by computational resources and knowledge of the physics of granular material, other approaches are required to simulate these flows. The shallow-water equations are derived from the Navier-Stokes equations under the assumption that the horizontal length scale is much greater than the vertical length scale, i.e. the fluid flow develops as a thin layer spreading horizontally over distances that are one or more orders of magnitude greater than its depth. The derivation of the shallow-water equations is made through a depth-averaging procedure of the equations of continuity and momentum of an incompressible fluid, which entails a hydrostatic pressure distribution, uniform horizontal velocities, and neglects vertical velocities (e.g., Benque et al., 1982; Huppert, 1998). This approximation permits the modeling of an essentially three-dimensional flow in two dimensions.
Recent advances have been made in creating computational models of gravity-driven flows using the shallow-water approximation for the purpose of hazard mitigation (e.g., McEwen & Malin, 1989; Takahashi & Tsujimoto, 2000; Denlinger & Iverson, 2001; Patra et al., 2005). Applications of these models have been used for block-and-ash flows at several volcanoes including Colima, El Chichon and Nevado de Toluca volcanoes in Mexico (Bursik et al., 2005; Patra et al., 2005; Saucedo et al., 2005; Rupp et al., 2006; Macias et al., 2008; Sulpizio et al., 2010); Mount Taranaki, New Zealand (Procter et al., 2010); Tungurahua, Ecuador (Kelfoun et al., 2009); Galeras and El Chichon Volcano, Columbia (Stefanescu et al., 2009; Murcia et al., 2010); Arenal Volcano, Costa Rica (Berrocal & Malavassi, 2006); Soufrière Hills Volcano, Montserrat (Hidayat et al., 2007; Ogburn, 2008; Ogburn et al., in press); and Merapi Volcano, Indonesia (Itoh, 2000; Charbonnier & Gertisser, 2009, 2012).
As the complexities of the flow mechanics and interactions are far from being fully understood, shallow-water models rely upon simplified rheological laws that have been tested in both the laboratory and natural examples (e.g., Denlinger & Iverson, 2001; Patra et al., 2005; Kelfoun et al., 2009). Such models are either based on frictional (Mohr-Coulomb) behavior (the Titan2D model developed at the University at Buffalo, USA) or other rheological laws (e.g., constant shear). Other computer models such as VolcFlow (developed at the Laboratoire Magmas et Volcans, Clermont-Ferrand, France) and DAN3D (developed at University of British Colombia, Canada) also provide the functionality to enter user-defined rheological laws. Section 2 summarizes the different rheological models used in the literature to simulate granular flows. Section 3 discusses the fundamentals of numerical simulations of dense volcanic granular flows with Titan2D, before focusing on the different processing steps required to: (1) reduce uncertainties in objectively defining the different input parameters; and (2) correctly evaluate the output variables of the model. Both synthetic and natural terrain examples are presented in section 4, including Titan2D simulations of a block-and-ash flow generated from the gravitational collapse of a synthetic dome at Turrialba volcano (Costa Rica), and followed by some discussions of the different results obtained (section 5).
Rheological Models
Frictional model
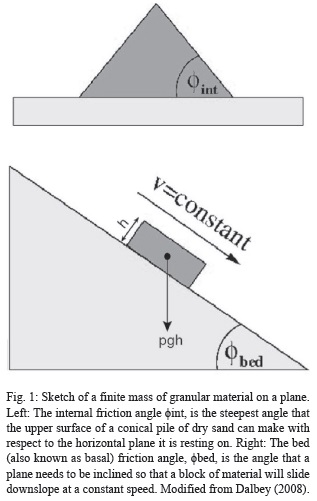
The simplest form of the frictional model, also known as Mohr-Coulomb model (Fig. 1), states that the resistive shear stress xr is a function of both the normal stress o and the friction angle ϕ: τr = σtanϕ (1). The frictional stress is thus rate independent. A block with a frictional behavior which is subjected to both a normal (σ) and a shear stress (τd) stays at rest whilst τd < σtanϕ . When the shear stress exceeds the threshold (τd > σtanϕ ), the block accelerates. A block at rest on a slope a is submitted to a driving stress τr = pghsina and a retarding stress τr = σtanϕ = pghcosatanϕ , where p, h and g are respectively the density of the block, its thickness and gravity (Fig. 1). It thus begins to slide when the driving stress exceeds the retarding stress τd >τr , i.e., when the slope exceeds the friction angle, α > ϕ. Note that for the following, this threshold is independent of the thickness of the block.
Savage and Hutter (1989) introduced a consistent set of equations of motion for a translating, deforming granular mass based on a Coulomb frictional resistance term. Their model was based on the common fluid dynamic technique of integration of properties throughout the range of the least-extensive spatial variable occupied by the flowing material, assuming that the variations of flow properties in that dimension are either self-similar or otherwise have a minor effect on the overall behavior. For flows that are much less deep than they are wide or long, this process is known as depth averaging. In the case of relatively shallow flows this originally one-dimensional theory was later generalized to two dimensions by the same authors, by introducing a simple curvilinear coordinate system with orthogonal directions being set by the maximum slope (x-axis), the normal to the local surface (z-axis) and a cross-slope axis normal to the other two (Savage and Hutter, 1991). However, these equations are not frame invariant (but dependant of some topographic conditions) and hence unsuitable for modeling flows over general terrain. Iverson & Denlinger (2001) derived depth-averaged, frame-invariant equations for fluidized granular masses on three-dimensional terrain and included the effect of interstitial fluid using a simple mixture theory approach. These equations form a system of hyperbolic conservation laws, referred to as the debris flow equations. Using a topography-linked coordinate system, with x and y parallel to the local ground surface and h perpendicular, the depth-averaged equations of mass (Eq. 2) and momentum (Eqs. 3 and 4) conservation are:
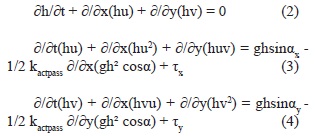
where h(x, y, t) is the layer thickness perpendicular to the local slope, u = (u, v) is the velocity vector with u and v depth-averaged velocities parallel to the local bed in the x and y direction respectively, a is the ground slope with ax and ay the slope angles along the x and y axes respectively, τ is all the retarding stresses that slow down the flow with τx and τy the stresses in the x and y direction respectively, and g is the gravity (9.8 m s-2). The parameter kactpass is the earth pressure/ L actpass L coefficient, the ratio of ground-parallel to ground-normal stress (Savage & Hutter, 1991). Its value is a function of the bed and the internal friction angle, ppbed and (pint, respectively, and is defined by Iverson & Denlinger (2001):
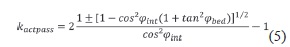
This expression is only valid if φbed ≤ φint. The sign ± is negative (and kactpass active) where the flow is locally divergent (spreading of the intial mass in x and y directions) and is positive (and kactpass passive) where the flow is locally convergent (shrinking of the intial mass in x and y directions). An isotropic stress is defined by φint = 0 and kactpass = 1 . The terms on the right-hand actpass side of the equations for momentum conservation indicate, from left to right, the stresses due to the weight, the pressure gradient and the retarding stress which depends on the rheological model chosen. For a dry frictional material, the retarding stress x is of the form:
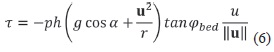
The term u2/r takes into account the "overweight" due to the centrifugal acceleration on the topographic curvature (Savage & Hutter, 1991). The term allows the x-component of the retarding stress in the direction opposed to the displacement to be calculated. This expression commonly used for granular flows is based on a constant bed apparent friction angle φbed implying a constant ratio of shear stress to normal stress at the base of the sliding mass.
Pouliquen (1999) and Pouliquen and Forterre (2002) showed with laboratory experiments that if the granular material flows on a rough slope, in which a slope element has the size of a typical grain, simple depth averaging using a constant basal friction angle no longer works. They proposed an empirical basal friction coefficient μ = tanφ as a function of the mean velocity u and the thickness h of the flow:
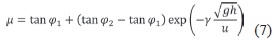
where φ1, φ2, γ are empirical characteristics of the material. Small thicknesses or high velocities are slowed down by high basal friction angles (maximum basal friction angle φ2), whereas large thicknesses are subject to smaller basal friction angles (minimum basal friction angle φ1). γ is a di-mensionless parameter empirically related to the mean grain diameter (Pouliquen, 1999). Recent studies by Heinrich et al. (2001) on Montserrat and Le Friant et al. (2006) on Montagne Pelée (Martinique) have shown that the emplacement of debris avalanches can be well-modeled by a Coulomb-type behavior law with a variable apparent basal friction angle using this relationship. Moreover, this approach seems to merge in some respects the two different classes of models proposed in the literature for dense volcanic flows, either frictional or thickness-dependent models.
For rapid granular flows at low bed friction angles and on steep slopes, depth-averaged, Coulomb models match both velocity and runout lengths of laboratory flows, even over somewhat irregular topography (e.g., Savage & Hutter, 1991; Gray et al., 1999; Denlinger & Iverson, 2001; Pudasaini & Hutter, 2007). Reasonable results have also been obtained for flows with an interstitial fluid (Denlinger & Iverson, 2001). In terms of strong internal shocks, the full Coulomb models are able to reproduce complex features of granular flows (Gray et al., 2003), such as the shocks themselves and "dead zones" where particles come to rest and accumulate. Comparisons of numerical implementations of Coulomb models with natural pyroclastic flows have also shown some success (e.g., Pitman et al., 2003; Rupp et al., 2006; Macias et al., 2008; Ogburn, 2008; Ogburn et al., in press; Charbonnier & Gertisser, 2009, 2012).
Constant shear models
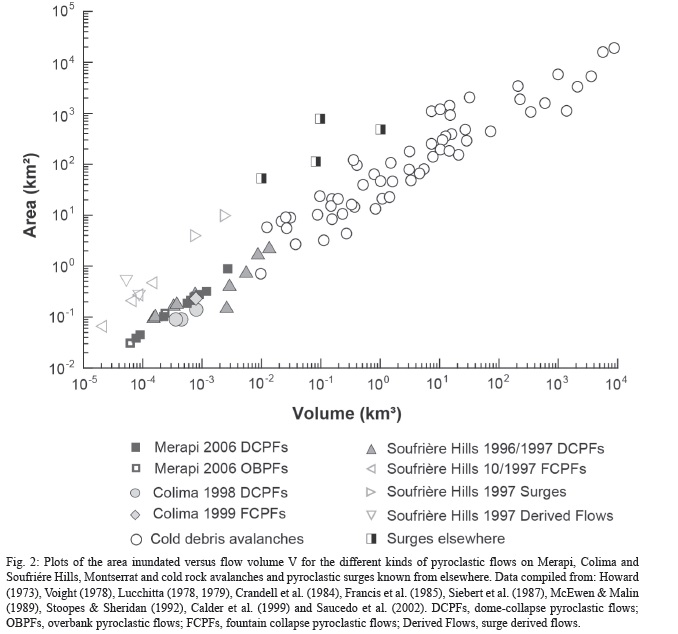
A model assuming a constant resisting shear stress to flow spread (Dade & Huppert, 1998) has seemed to some to produce a better similarity collapse for a number of geological flows. Results show that for a given type of flow, runout is controlled by a constant stress condition and not by a constant slope condition, as assumed by the Coulomb friction model. Moreover, similarity collapse on area A versus volume V (Fig. 2) suggests that each type of flow thins to characteristic thickness, implying that thickness-dependent models of behavior are most appropriate. These two different views on the main flow regimes and rheological behavior that govern the dynamics of geological mass flows has led to the incorporation of different stress relationships into recent numerical models, with the other terms used to define flow dynamics remaining the same for different flow types.
Some authors recently showed that the use of a single empirical law, a constant retarding stress, also called yield strength, is more appropriate than frictional behavior and enabled the main features of debris avalanche and pyroclastic-flow deposits to be reproduced (Kelfoun & Druitt, 2005; Kelfoun et al., 2009). This empirical law simply states that the retarding stress is constant, independent of the velocity, thickness or any other parameter of the flow:

Kelfoun et al. (2009) argued that the constant retarding stress would be the result of an increase in the angle of friction towards the surface of the flows. For thick flows, the retarding stress is related to the low friction of the interior, while for thin flows the stress depends on the high friction of the surface. The factional stress is thus approximately constant, the angle of friction increasing as the thickness decreases probably in response to segregation and an increase in porosity towards the surface (Kelfoun et al., 2009).
To conclude, considerable progress has been made in the understanding of the physics of dense volcanic granular flows and several approaches have improved our knowledge by trying to describe their complexities. While the factional model seems to be the most promising approach that has been adopted by many authors to simulate granular flows, recent studies suggest that a more thorough understanding of stresses resulting from particle interactions is probably needed to produce numerical models adaptable over a wide range of natural conditions typical of such flows.
Titan2D
The Titan2D computer program (Pitman et al., 2003; Patra et al., 2005) was designed by the Geophysical Mass Flow Modeling Group at University at Buffalo, USA, to simulate dry granular avalanches over digital representations of natural terrain. The program is built on a depth-averaged model for an incompressible Coulomb continuum, a "shallow water" granular flow, based on the work of Savage & Hutter (1989), Iverson (1997), Iverson & Denlinger (2001), Denlinger & Iverson (2001) and Mangeney-Castelnau et al. (2002). This assumption is grounded on the fact that compared to the entire area over which a long-run-out mass flow travels and deposits, its thickness in comparison is small. It combines numerical simulations of a flow with digital elevation data of natural terrain supported by a Geographical Information System (GIS) interface. The conservation equations for mass and momentum are solved with a Coulomb-type friction term for the interactions between the grains of the media and between the granular material and the basal surface (Savage & Hutter, 1989; Pitman et al., 2003).
Model equations and numerical solution
Using the suitable boundary conditions and depth averaging, Patra et al. (2005) obtained a system of equations governing the flow of dry avalanches on arbitrary topography in terms of conservative variables, in vectorial form as:
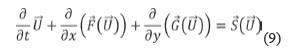
where:
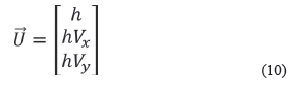
is the vector of conserved state variables (with h = flow depth, hVx = x-momentum, hVy = y-momentum).
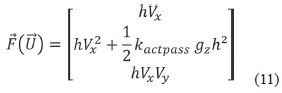
is the mass and momentum flux in the x-di-rection (with hV = mass flux in x-direction, hVx2 + 1/2 kactpass gzh2 = x-momentum flux in x-direction and hVxVy = y-momentum flux in x-direction.
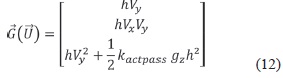
is the mass and momentum fluxes in y-direction (with hVy = mass flux in y-direction, hVxVy = x-momentum flux in y-direction; hVy2 + 1/2 kactpass gzh² = y-momentum flux in y-direction.
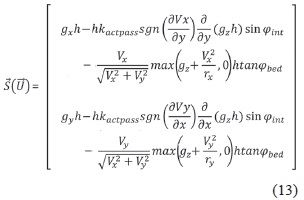
is the vector of driving and dissipative source terms (with gxh = driving gravitational force in x-direction, -hkactpass sgn(∂Vx/∂y)∂/∂y(gzh)sinφint = dissipative internal friction force in x-direction, -(Vx/ √(Vx2 + Vy2))max (gz + (Vx2)/rx ,0)htanφbed = dissipative bed frictional force in x-direction; similar terms for y-direction). The term used for the dis-sipative bed frictional force is slightly modified from Iverson & Denlinger (2001), where sgn(Vx) was used instead of Vx / √(Vx2 + Vy2). Patra et al. (2005) indicate that in cases where the momentum in the x and y directions differ significantly (e.g., flow down a channel) this relationship provides the necessary scaling in each coordinate direction. With this modification, the friction mobilized is in proportion to the velocity in that direction.
The resulting hyperbolic system of equations is solved using an explicit Euler scheme for the differential equation, with right hand side given by the vector of driving and dissipation source terms and a parallel, adaptive mesh, Godunov finite volume solver for the remaining system of hyperbolic conservation laws. Background information on these methods can be found in Davis (1988), Toro & Billett (1997) and Hirsch (1990). In brief, the dependent variables are considered as cell averages, and their values are advanced by a predictor-corrector method: the source terms are included in these updates, and no splitting is necessary. Slope limiting is used to prevent unphysi-cal oscillations. More details about the solution techniques used in Titan2D are found in Pitman et al. (2003) and Patra et al. (2005). The Message Passing Interface (MPI) (http://www.unix.mcs.anl.gov/mpi/) Application Programmers Interface (API) allows for computing on multiple processors, increasing computational power, decreasing computing time, and allowing for the use of large data sets. A principal feature of the code is the incorporation of topographical data into the simulations and grid structure. A pre-processing routine allows digital elevation data to be imported. These data define a two-dimensional spatial box in which the simulation will occur. The raw data provides elevations at specified locations. By using this data and interpolating between data points where necessary, a rectangular, Cartesian mesh is created. The elevations provided on this mesh are then used to create surface normals and tangents, ingredients in the governing equations. Adaptive gridding allows for the concentration of computing power on region of special interest. Mesh refinement captures the complex flow features at the leading edge of the flow, as well as locations where the topography changes rapidly. Mesh un-refinement is applied where solution values are relatively constant or small to further improve computational efficiency. Finally, the grid data are written out for use, together with simulation output, in post-computation visualization.
User interaction
The standalone version of Titan2D operates in a LINUX environment via a Python scripted graphical user interface (GUI). Terrain data are entered into the simulation via the GRASS (Geographic Resources Analysis Support System; US Army Corps of Engineers' CERL) GIS format, which is an open-source software for data management, spatial modeling, image processing and visualization. Simulations on real terrain usually require a large amount of pre-processing and resampling of the original digital elevation model (DEM) to generate a new grid. This is avoided in Titan2D by integrating the model with GRASS GIS and adaptive gridding.
Before attempting to simulate a flow with Titan2D, data regarding its physical nature must be gathered. The main ways in which a user controls simulations using the Titan2D user interface are by:
(1) Providing a 3D grid containing topographic information (x, y, z; e.g., a DEM for the simulation area). DEMs with a spatial resolution of 30m or better are desirable. Some sources of DEMs can be found in Table 1. The effect of DEM interpolation and sampling schemes on model outputs is discussed in Stefanescu et al. (2009);
(2) Defining dimensions of an initial ''pile'' of material or a flux source which adds mass over a specified time period and area at a specified rate, both including shape, footprint, height, volume, position and initial velocity (if required);
(3) A variable that represents the angle of internal friction of the granular pile, which must be higher than the chosen bed friction angle. Analysis of input sensitivity and experience has shown that flows are relatively insensitive to the internal friction angle (Dalbey & Patra, 2008);
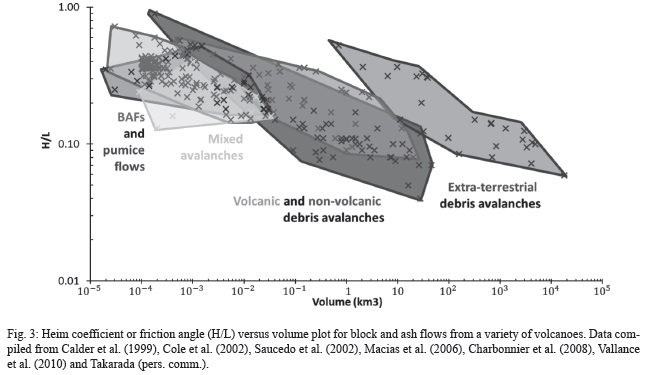
(4) A variable that represents the angle of bed friction between the granular pile and the substrate. This value is somewhat volume dependent (large volume flows require lower basal friction angles) and can be initially estimated from the Heim coefficient (height-dropped over runout or H/L) angles measured from natural deposits for a particular volcano, or taken from a H/L vs. volume plot as in figure 3. Using H/L vs. volume curves works well for simple channels, and provides a range of reasonable basal friction angles. For more complex terrain, 'calibrating' Titan2D by replicating natural deposits through trial and error, or employing material maps of varying friction may be required (Stinton et al., 2004; Charbonnier & Gertisser, 2009, 2012). Material maps can account for changes in roughness due to substrate type (Table 2). Simulated flow inundation is sensitive to the basal friction angle, and a range of inputs should be used to capture natural variability and uncertainty;
(5) A GIS-based classified material map, which matches the area covered by the DEM, can be used to define zones in the region where pronounced changes in the topographic surface (e.g., different substrates, slope breaks and channel confinements and morphologies) result in a change in the bed friction angle;
(6) Stopping criteria to halt the simulation (normally a limit on ''real time'' or the number of computational time steps).
Some of Titan2D's outputs are flow depth and momentum over the whole computational domain (or DEM) at specified times, which can be used to compute field observable variables during the flow such as run-up height, inundation area, velocity and time of flow. The Titan2D User Guide (http://vhub.org/resources/300) contains a detailed description of the TITAN2D model and some information on the preparation of the inputs for the standalone version of the code.
Titan2D online simulation tool on Vhub
Vhub (http://vhub.org/) is a virtual organization and community cyberinfrastructure for volcanology research and risk mitigation (Palma et al., 2014). Funded by the U.S. National Science Foundation since 2010, the overarching goal of VHub is to provide a mechanism for globally collaborative research and development of computational models of volcanic processes and their integration with complex geospatial, observational, and experimental data. VHub promotes seamless accessibility of appropriate models and data to organizations around the world charged with assessing and reducing risk, reaching across resource levels and cultural boundaries.
VHub supports computer simulations and numerical modeling at two levels: (1) some models can be executed online via VHub, without needing to download code and compile on the user's local machine; (2) other models are not available for online execution but for offline use in the user's computer. VHub also provides a mechanism for collaborative efforts at code development, verification, validation, and benchmarking. To take advantage of these capabilities the user must be registered on VHub (at no cost) and logged in to their account (Palma et al., 2014).
As of March 2014, the Titan2D toolkit on VHub fronts numerical simulations but it does not prepare the necessary DEM input that Titan2D relies upon, which is a prerequisite. Vhub offers an online conversion tool for putting a DEM in a format that the model can read and use; this tool is available at http://vhub.org/resources/dem4titan. A tutorial is available at http://vhub.org/resourc-es/761 and describes how to (1) enter the different input parameters for running a Titan2D simulation on Vhub, (2) run the simulation and (3) visualize the results using the Vhub's Titan2D viewer (available at http://vhub.org/resources/titanview). Within the Vhub environment, Titan2D and its Java-based GUI are already installed, along with the supporting software packages. The actual execution of the code can occur either within the limitations of the VHub server (local execution in the GUI job submission tab), or remotely on a large cluster (the Hub-submit option in the GUI). For more information on how to use Titan2D on Vhub, any registered member is welcome to join the Titan2D Users group (https://vhub.org/ groups/titan2dusers).
Program improvements and applications
Titan2D has been applied to and evaluated against small-scale pyroclastic flows, block-and-ash flows and rock avalanches, including those at Colima Volcano, Mexico (Bursik et al., 2005; Saucedo et al., 2005; Rupp et al., 2006; Capra et al. 2011), El Misti, Peru (Delaite et al., 2005) and Little Tahoma Peak, Washington, USA (Stinton et al., 2004; Sheridan et al., 2005). The outcomes of these studies have highlighted the uncertainties in objectively defining model input parameters for realistic simulation of local flow conditions. Recently, major contributions and advances have been implemented to the "one-phase" version of the model (in the dry limit without interstitial fluid) that mitigates these problems. These updates are fully described in Dalbey (2008) and Yu et al. (2009) where they present a multi-faceted approach that includes: (1) several improvements to the accuracy of Titan2D's physical and numerical modeling capabilities, (2) a quantification of the uncertainty in geophysical flow simulation output and (3) the development a systematic methodology to aid volcanologists in incorporating simulator output into the production of hazard maps. The release of a new version of the Titan2D code in 2007 (Titan 2.0.0) included the following advances:
(1) Adding the capability to vary the bed friction angle by terrain region;
(2) Implementing a mass flux model to represent material emerging out of or raining down onto the ground;
(3) Developing an approximate physics-based criterion to determine when the flow should be coming to rest and devising a scheme to bring it to rest: the Savage-Hutter equations model the flowing granular material as an "equivalent fluid". Here the word "equivalent" indicates that the fluid's rheological properties are chosen so as to approximate the desired bulk behavior. The equations were derived assuming that the material is already in motion and as such cannot (without augmentation) bring the flow to rest. Instead, the material continues to flow with a small but non-negligible velocity after it should have come to rest, and the true final extent of the flow is obscured. A different mechanism of stopping is described by each stopping criterion. The first stopping criterion, a global "dimensionless" velocity, V*1, is only dependent upon the average velocity, gravitational forces and the height of the initial pile. The second stopping criterion, a global ''stopping'' velocity, V*2, incorporates average velocity, gravitational forces, initial pile height, aspect ratio, internal friction angle, and bed friction angle. The third stopping criterion, a local stopping velocity v, examines force balances in each computational cell. One can refer to Yu et al. (2009) for detailed explanations. The results of these numerical experiments suggest that reasonable estimates of runout distance for geophysical flows can be obtained by using the stopping criterion with values of V*2 = 0.03 for flows both on open slopes and in channels;
(4) Developing a multi-faceted approach that mitigates the numerical "thin-layer problem" common to depth-averaged models: historically, the numerical solution of the Savage-Hutter (and similar "shallow-water") equations has been plagued by several interrelated numerical difficulties which are collectively characterized by a non-physically thin-layer of fluid extending large distances from the main body of the flow. In the best-case scenario, this "thin-layer problem" means a "no flow" boundary line must be arbitrarily drawn at some given depth contour. In the worst-case scenario, it can cause severe numerical instability that prevents any simulation of a particular event. The implementation of the thin-layer control strategy in the two-phase version (with an interstitial fluid) of Titan2D has not yet been completed.
The work of Dalbey (2008) is a major step in quantifying parameter uncertainties and improving Titan2D's physical and numerical modeling capabilities. Future efforts on the development of the model will focus on (1) developing new systematic approaches to better quantify other parameter uncertainties and variability from the digital elevation maps to the initial conditions and estimates of friction angles and (2) enhancing the quality of the two phase model to enable it to better deal with fluidized mixtures. For the latter, a first step has been taken by Pitman and Le (2005), but more work is required (Cordoba, pers. comm., 2009).
Expamples of Titan2D simulations
This section presents examples of simulations performed by Titan2D on a channel of constant slope and on a natural terrain. The first set of examples is intended to illustrate the choice of bed and internal friction angles, which are parameters that characterize the properties of the flow in the mathematical model, and thus play a role in the velocity, thickness and runout of the material. The next example shows the simulation of a dense volcanic granular flow generated from a lava dome collapse at Turrialba volcano (Costa Rica).
Channelized flow down a slope
Simulation set up
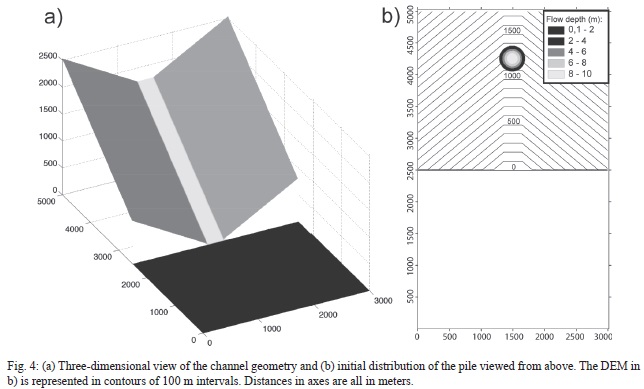
The surface geometry in this set of examples consists of a 300 m wide flat channel surrounded by a 30 degrees slope on both sides (Fig. 4). This configuration extends for 2,500 m, starting at an elevation of 1,750 m and ending at zero elevation, creating a constant slope of 35 degrees. At the bottom of the channel there is a flat surface that extends for another 2,500 m. The width of the channel configuration and flat surface is 3,000 m. Owing to the procedure that the current version of Titan2D applies to define and adapt the grid where the variables are calculated (which is different to the grid with the elevation data), part of the edges of the surface or DEM is lost in the final output; for instance, one can compare the limits of the geometry in Figures 4a and 4b. This limitation needs to be taken into account when defining the limits of the DEM that will be used for the simulations.
Three simulations were performed using the same geometry and initial conditions but different friction angles. The values of the friction angles chosen represent typical values used in studies of the runout of block-and-ash flows (e.g., Ogburn et al. in press; Charbonnier & Gertisser, 2009, 2012). The first two examples have an internal friction angle (i.f.a) of 30 degrees, whereas the bed friction angles (b.f.a.) are 26 and 16. The third example has a b.f.a. of 16 and an i.f.a. of 20. The pile is a symmetrical dome-shaped mass centered at the (X,Y) coordinates 1500 m, 4250 m, with a maximum depth of 10 m and a radius of 200 m (Fig. 4b). The volume of the pile is calculated with the formula:
V = 0.5 * π * Rmajor * Rminor * hmax
where Rmajor and Rminor are the radii of the longest and shortest axes in the elliptical dome, respectively (in our case both radii are the same), and hmax is the maximum depth of the pile. This yields a volume of 6.3x10⁵ m3. Initially the pile is at rest and it starts moving due to gravity, according to their b.f.a. lower than the slope angle, as soon as the simulation begins.
Results
The three examples were run for 90 seconds, even though the piles stopped moving after 6070 seconds. Changes in maximum depth and average speed with time of the first two examples are shown in figure 5, and snapshots of their flow depths at distinctive times are shown in Figure 6. After the release of the material both piles elongate downslope while they increase their velocity. The pile with b.f.a. 26 experiences a constant acceleration of 1.7 m/s and the pile with b.f.a 16 exhibits a constant acceleration of 3.2 m/s. Because of the elongation of the piles, when the two flows reach their maximum speed they also show a low in their maximum depth (Fig. 5). This occurs when the piles encounter the flat surface, which leads to an immediate deceleration of the flow (figures 6a and 6d). It is noteworthy that during the accelerating phase the pile with b.f.a. 26 exhibited a larger deformation and decrease in flow depth than the pile with b.f.a 16. Subsequently, on the flat surface (with a slope much lower than their b.f.a.) the lower speed of the flow front causes the accumulation of material and increase in flow depth. There is a clear difference in the runout of the two piles that is only dependent upon the different bed friction angle. Whereas the pile with b.f.a. 26 quickly loses momentum and becomes deeper, the pile with b.f.a. 16 increases in depth for a short period of time until most of it has moved onto the flat surface, and continues flowing and elongating for another ~1,000 m before it stops. The piles with b.f.a. 26 and 16 decelerate at 3.6 m/s and 2.8 m/s, respectively, until they reach a non-zero but very low average speed (<1m/s) at 60 and 66 seconds after the beginning of the simulation. At this moment the piles can be considered to have stopped moving although they continue spreading laterally, as shown by the continuous and apparently asymptotically decrease in maximum depth of the piles.
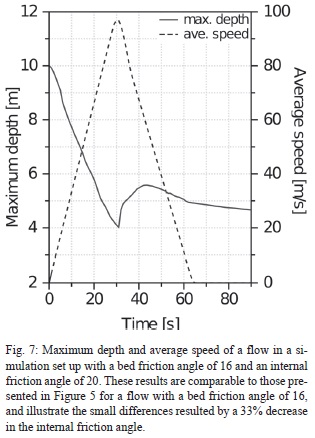
The third example, (b.f.a. 16, i.f.a. of 20), varied only in the i.f.a. from the second example and exhibited a similar evolution of its maximum depth (Fig. 7). The only difference between these examples is the maximum depth reached at about 40 seconds, which in the third example was 5.58 m at 43 seconds, whereas in the second example (i.f.a. 30) it reaches 4.9 m at 39 seconds (Fig. 7).
Measuring the runout distance of the piles after 90 seconds of simulation we can calculate the Heim coefficient (height dropped over runout or H/L) in each case. All the piles started at a ground elevation of 1225 m and the flat surface where they stopped is at zero elevation. The front of the final dome-shaped deposits for experiments with b.f.a of 26 and 16 are at the Y coordinates 1960 and 700 m, respectively, which yields Heim coefficients of 0.535 (28 degrees) and 0.345 (19 degrees). These values are greater than those set in the experiments and correspond to 212 and 722 meters shorter runouts compared to what is expected for flows with H/L of 26 and 16 degrees, respectively. Although different, the Heim coefficient of a natural deposit over simple terrain (smooth slopes and simple channels) is a first order approximation to the bed friction angle used in a Titan2D simulation.
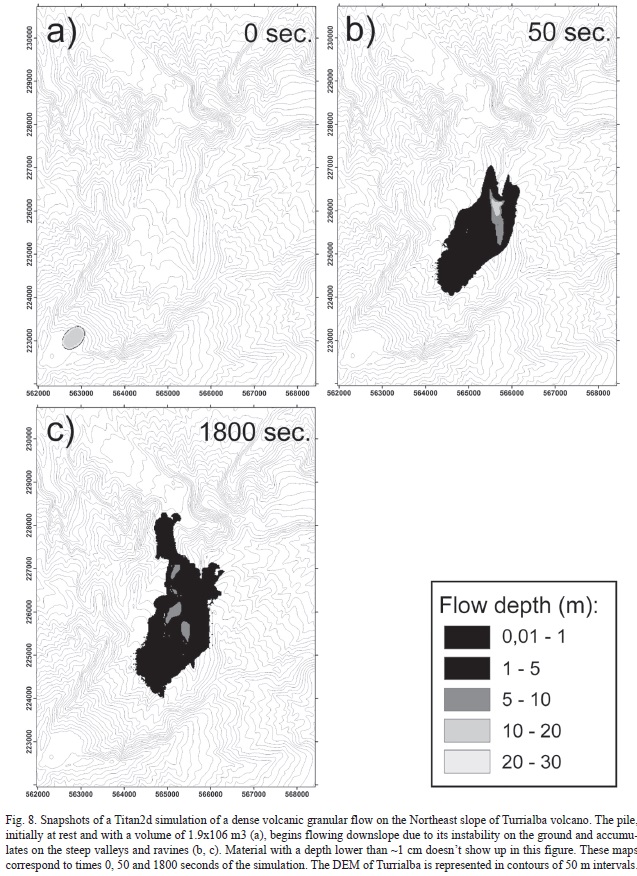
Example of a dense volcanic granular flow at Turrialba volcano
This example shows the generation and run out of a dense volcanic granular flow of 1.19x10⁶ m3 in volume that flows on the Northeast flank of Turrialba volcano (Fig. 8). Turrialba, the easternmost of Costa Rica's Holocene volcanoes, is a large vegetated basaltic-to-dacitic stratovol-cano located across a broad saddle NE of Irazu volcano overlooking the city of Cartago. Three well-defined craters occur at the upper SW end of a broad 800 x 2200 m wide summit depression that is breached to the NE (Reagan et al., 2006). Most activity at Turrialba originated from the summit vent complex, but two pyroclastic cones are located on the SW flank. Five major explosive eruptions have occurred at Turrialba during the past 3500 years (Reagan et al., 2006). A series of explosive eruptions during the 19th century were sometimes accompanied by pyroclastic flows. Fumarolic activity recently increases at the summit craters.
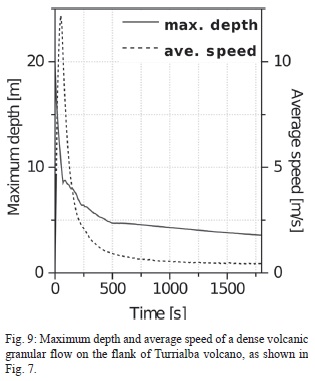
The simulation presented in this example is not necessarily intended to represent a real world scenario of a flow developed in the past, or a potential pyroclastic flow that may be generated in the future, but may correspond to a block-and-ash flow generated from the collapse of a dome located on the Northeast side of the crater area. The horizontal resolution of the DEM used is 20 m. The initial pile had a dome shape with a maximum depth of 20 m, with the base having a major and minor axes extent of 300 and 200 m, respectively. Starting at rest, the granular material collapses and accelerates downslope until it reaches its maximum speed after 50 seconds (~12.2 m/s) (figures 8 and 9). The internal and bed friction angles are 30 and 16, respectively. The material quickly follows the drainage and fills the ravines, and as the slope decreases the velocity of the material and its maximum depth decrease as well. Because of the low basal friction angle and the complexity of the terrain, rapid changes in the velocity of the flow may take place locally as portions of the material encounter changes in slope along the runout path. This contributes to the long duration of the simulation. The average speed of the flow starts to decrease rapidly after a minute or so of simulation. After about 10 minutes of simulation most of the material has been emplaced on its final deposit location, which has been deforming and flowing according to the steepness of the slope and because of the lack of a stopping criterion in the numerical simulation (Figure 9).
Discussion and Conclusions
Titan2D is a freely available geophysical flow model that has been used to simulate block-and ash-flows and debris avalanches with success. It uses a depth averaged model for "shallow water" granular flows and combines numerical simulations of a flow with digital elevation data of natural terrain supported by a GIS interface. The conservation equations for mass and momentum are solved with a Coulomb-type friction term for the interactions between the grains of the media and between the granular material and the basal surface. Titan2D takes user inputs of an internal and bed friction, initial velocity, and starting geometry parameters (which can include a mass flux). Basal friction angles can also be supplied by using a 'material map', a raster containing friction values (e.g., Stinton et al., 2004; Charbonnier & Gertisser, 2009, 2012). Model outputs include flow inundation, thickness, and velocity.
The Turrialba example is intended to show the capabilities of Titan2D to model dense volcanic granular flows on natural terrain, rather than replicate or predict an actual flow. In this regard, it is worth mentioning some limitations of numerical modeling with Titan2D on the simulation of specific types of volcanic flows. As explained in previous sections, Titan2D is based on rheologi-cal laws governing the deformation and flow of dry granular material. Moreover, because of the depth-integrated form of the equations, there are constraints on the vertical velocities developed within the flow and its vertical expansion. These two aspects of the numerical model mean that flows such as lahars (mixture of water and solids) and certain types of pyroclastic density currents (surges and column-collapse flows) cannot be realistically modeled; also high vertical gradients in the topography may impose unrealistic scenarios for the model. For instance, Kelfoun et al. (2009) showed that the Mohr-Coulomb behavior is not appropriate for modeling column-collapse pyroclastic flows at Tungurahua volcano. Block-and-ash flows, however, have been satisfactorily modeled with Titan2D (e.g., Rupp et al., 2006; Charbonnier & Gertisser 2009, 2012; Procter et al., 2010; Sulpizio et al., 2010) but simulation results are limited to the dense basal part of such flows, and do not include the overlying dilute ash-cloud surge component.
To conclude, the results presented in this paper suggest that the application of 'shallow-water' numerical models like Titan2D for hazard assessment of volcanic flows can be used as predictive tools in future eruptions, but should be limited to the field of dense volcanic granular material, like those produced by gravity-driven dome collapse events. Therefore, these models cannot be used to simulate any dilute pyroclastic density currents generating by vertical column collapse, total dome disruption and directed blast scenarios. Moreover, validations of the model so far have re-vealed a rather empirical use of the friction parameters that allow adjustment of the model to different runout situations. The Heim coefficient can provide reasonable input parameters that can be used as guidelines for choosing appropriate basal friction angles based on flow volume (see Fig. 3). Calibration of these resistance terms by using well-constrained flow mobility parameters calculated from field observations provides a good method for encompassing and compensating for the lack of uncertainty around the potential of future events. However, such an approach lacks a general procedure for the systematic use of these models in predicting probabilities of different outcomes, given distributions of inputs. Such a methodology with the use of Titan2D has been recently developed by several authors (e.g., Dalbey & Patra, 2008; Sheridan et al., 2010). By combining numerical simulations using freely available models, probability modeling and statistical methods for defining best-fit input parameters, a systematic approach provides one basis for estimating the areas and levels of hazard associated with dense volcanic granular flows and for improving disaster mitigation plans.
Acknowledgments
The authors would like to thank the organizers of the PASI workshop held in San Jose, Costa Rica, 2011 (http://www.geo.mtu.edu/~raman/ PASI2011/Welcome.html): Michigan Technological University and University of Costa Rica. This work was greatly facilitated by the cyberinfrastructure and support staff of Vhub. We would also like to thank the work of the Geophysical Mass Flow Group at SUNY at Buffalo for their work on Titan2D development. We are also grateful to Gerardo Soto for providing the DEM of Turrialba volcano. JLP acknowledges support from NSF Grant 0940831. SJC would like to thank the University of South Florida for its financial support. SEO acknowledges support from the NSF IGERT GI Science program, and NSF grants 1070229 and 1073422.
References
BENQUE, J., LABADIE, G. & RONAT, J., 1982: A new finite element method for Navier-Stokes equations coupled with a temperature equation.- En: KAWAI, T. (ed.): Finite element flow analysis.- Proc. Fourth Int. Symp. Tokio: 295-302. [ Links ]
BERROCAL, M. & MALAVASSI, E., 2006: TITAN2D models of Arenal pyroclastic flows.- Cities on Volcanoes 4th Conference, Quito, Ecuador: 25. [ Links ]
BURSIK, M. PATRA, A., PITMAN, E., NICHITA, C., MACIAS, J., SAUCEDO, R. & GIRINA, O., 2005: Advances in studies of dense volcanic granular flows.-Reports on Progress in Physics, 68: 271301. [ Links ]
CAPRA, L., MANEA, V., MANEA, M. & NORINI, G., 2011: The importance of digital elevation model resolution on granular flow simulations: a test case for Colima volcano using TITAN2D computational routine.- Natural Hazards, 59(2): 665-680. [ Links ]
CHARBONNIER, S. J., & GERTISSER, R., 2009: Numerical simulations of block-and-ash flows using the TITAN2D flow model: Examples from the 2006 eruption of Merapi volcano, Java , Indonesia.- Bull. of Volcanol. 71(8): 953-959. [ Links ]
CHARBONNIER, S. J. & GERTISSER, R., 2012: Evaluation of geophysical mass flow models using the 2006 block-and-ash flows of Merapi Volcano, Java, Indonesia: Towards a short-term hazard assessment tool.- J. Volcanol. and Geothermal Res. m231-232: 87-108. [ Links ]
COLE, P. D., CALDER, E. S., SPARKS, R. S. J., CLARKE, A. B., DRUITT, T. H., YOUNG, S. R., HERD, R. A., HARFORD, C. L. & NORTON, G. E., 2002: Deposits from dome-collapse and fountain-collapse pyroclastic flows at Soufrière Hills Volcano, Montserrat. En: DRUITT, T. H. & KOKELAARM, B. P. (eds): The eruption of Soufrière Hills Volcano, Montserrat, from 1995 to 1999.-Geol. Soc. London, Memoirs, 21: 231-26. [ Links ]
DADE, W. B. & HUPPERT, H. E., 1998: Long-runout rockfalls.- Geology, 26(9): 803-806. [ Links ]
DALBEY, K., & PATRA, A. (2008). Input uncertainty propagation methods and hazard mapping of geophysical mass flows.- J. Geophys. Res. 113(B5): 1-16. [ Links ]
DAVIS, S., 1988: Simplified second-order Godunov-type methods.- SIAM J. Sci. and Statistical Computing, 9(3): 445-473. [ Links ]
DELAITE, G., THOURET, C.-J., SHERIDAN, M., LABAZUY, P., STINTON, A., SOURIOT, T. & VAN WESTEN, C., 2005: Assessment of volcanic hazards of El Misti and in the city of Arequipa, Peru, based on GIS and simulations, with emphasis on la-hars.- Zeitschrift für Geomorphologie 140: 209-231. [ Links ]
DENLINGER, R. P. & IVERSON, R. M., 2001: Flow of variably fluidized granular masses across three-dimensional terrain: 2. Numerical predictions and experimental tests.- J. Geophys. Res. 106(B1): 553-566. [ Links ]
GRAY, J., TAI, Y. C. & NOELLE, S., 2003: Shock waves, dead zones and particle-free regions in rapid granular free-surface flows. J. Fluid Mechanics, 491(1): 161-181. [ Links ]
GRAY, J., WIELAND, M. & HUTTER, K., 1999: Gravity-driven free surface flow of granular avalanches over complex basal topography.- Proc. of the Royal Soc. London, Mathematical, Physical and Eng. Sci. 455(1985): 1841-1874. [ Links ]
HEINRICH, R, BOUDON, G, KOMOROWSKI, J-C., SPARKS, R. S. J., HERD, R. & VOIGHT, B., 2001: Numerical simulation of the december 1997 debris avalanche in Montserrat.-Geophys.Res. Letters, 28(13): 2529-2532. [ Links ]
HIDAYAT, D., WIDIWIJAYANTI,C., VOIGHT, B., PATRA, A. & PITMAN, E.B., 2007: TITAN2D analyses of dome-collapse pyroclastic flows on Montserrat.-Eos Transactions AGU 88(52), Fall Meeting 2007, abstract #V31B-0499. [ Links ]
HIRSCH, C., 1990: Numerical computation of internal and external flows. Vol. II: Computational methods for inviscid and viscous flows.- 708 págs. John Wiley & Sons, England. [ Links ]
HUPPERT, H. E., 1998: Quantitative modelling of granular suspension flows.- Philosophical Transactions A, 356(1747): 2471. [ Links ]
ITOH, H., 2000: Hazard estimation of the possible pyroclastic flow disasters using numerical simulation related to the 1994 activity at Merapi Volcano.- J. Volcanol. Geothermal Res. 100(1-4): 503-516. [ Links ]
IVERSON, R. M., 1997: The physics of debris flows.- Rev. Geophys. 35(3): 245-296. [ Links ]
IVERSON, R.M. & DENLINGER, R. P., 2001: Flow of variably fluidized granular masses across three-dimensional terrain 1. Coulomb mixture theory.- J. Geophys. Res. 106(B1): 537-552. [ Links ]
KELFOUN, K. & DRUITT, T. H., 2005: Numerical modeling of the emplacement of Socompa rock avalanche, Chile.- J. Geophys. Res. 110(B12): 1-13. [ Links ]
KELFOUN, K., SAMANIEGO, P., PALACIOS, P. & BARBA, D., 2009: Testing the suitability of frictional behaviour for pyroclas-tic flow simulation by comparison with a well-constrained eruption at Tungurahua volcano (Ecuador).- Bull. Volcanol. 71(9): 1057-1075. [ Links ]
LE FRIANT, A., BOUDON, G., KOMOROWSKI, J. - C., HEINRICH, P. & SEMET, M. P., 2006: Potential flank-collapse of Soufrére Volcano, Gouadeloupe, Lesser Antilles? Numerical simulations and hazards.- Natural Hazards, 39: 381-393. [ Links ]
MACIAS, J. ., CAPRA, L., ARCE, J., ESPINDOLA, J., GARCIA-PALOMO, A. & SHERIDAN, M., 2008: Hazard map of El Chichón volcano, Chiapas, México: Constraints posed by eruptive history and computer simulations.- J. Volcanol. Geothermal Res. 175(4): 444-458. [ Links ]
MANGENEY-CASTELNAU, A., VILOTTE, J., BRISTEAU, M. O., PERTHAME, B. , BOUCHUT, F.,SIMEONI, C. & YERNINI, S., 2002: Numerical modeling of avalanches based on Saint-Venant equations using a kinetic scheme.- J. Geophys. Res. 108(B11): 2527-2544. [ Links ]
MCEWEN, A. & MALIN., 1989: Dynamics of Mount St. Helens' 1980 pyroclastic flows, rockslide-avalanche, lahars, and blast.- J-Volcanol- Geothermal Res- 37(3-4): 205-231. [ Links ]
MURCIA, H., SHERIDAN, M., MACÍAS, J. & CORTÉS, G., 2010: TITAN2D simulations of pyroclastic flows at Cerro Machín Volcano, Colombia: Hazard implications.-J- South Amer- Earth Sci. 29(2): 161-170. [ Links ]
OGBURN, S. E., 2008: Potential hazards at Soufriere Hills Volcano, Montserrat: Northwards-directed dome-collapses and major explosive eruptions.- 178 págs. State Univ. of New York, Buffalo (Thesis M.Sc. [ Links ]).
OGBURN, S. E., CALDER, E. S., COLE, P. D., & STINTON, A. J., (in press): The effect of topography on ash-cloud surge generation and propagation. - In: WADGE, G (ed.), The Eruption of Soufriere Hills Volcano, Montserrat from 2000 to 2010.-Geol.Soc. London, Memoirs. [ Links ]
PALMA, J. - L., COURTLAND, L., CHARBONNIER, S. J., TORTINI, R. & VALENTINE, G. A., 2014: Vhub: a knowledge management system to facilitate online collaborative volcano modeling and research.- J. Applied Volcanol. 3(2): 1-16. [ Links ]
PATRA, A. K., BAUER, A. C., NICHITA, C. C., PITMAN, E. B., SHERIDAN, M. F., BURSIK, M., RUPP, B., WEBBER, A., STINTON, A.J ., NAMIKAWA, L. M. & ENSCHLER, C. S., 2005: Parallel adaptive simulation of dry avalanches over natural terrain.- J. Volcanol. Geothermal Res. 139(1-22): 1-21. [ Links ]
PITMAN, E. B., NICHITA, C., PATRA, A., BAUER, A., SHERIDAN, M. & BURSIK, M., 2003: Computing granular avalanches and landslides.- Physics of Fluids, 15(12): 3638-3646. [ Links ]
PITMAN, E.B. & LE, L., 2005: A two-fluid model for avalanche and debris flows.-Philosophical Transactions of the Royal Society A: Mathematical, Physical and Eng. Sci. 363(1832): 1573-1601. [ Links ]
POULIQUEN, O., 1999: Scaling laws in granular flows down rough inclined planes.- Physics of Fluids 11(3):542-548. [ Links ]
POULIQUEN, O., FORTERRE, Y., 2002: Friction law for dense granular flows: application to the motion of a mass down a rough inclined plane.- J. Fluid Mechanics, 453: 133-151. [ Links ]
PROCTER, J. N., CRONIN, S. J., PLATZ, T., PATRA, A., DALBEY, K., SHERIDAN, M. & NEALL, V., 2010: Mapping block-and-ash flow hazards based on Titan 2D simulations: a case study from Mt. Taranaki, NZ.- Natural Hazards, 53(3): 483-501. [ Links ]
PUDASAINI, S. P. & HUTTER, K., 2007: Avalanche dynamics: dynamics of rapid flows of dense granular avalanches.- 602 págs. Springer Verlag, Berlin. [ Links ]
REAGAN M., DUARTE E., SOTO G.J. & FERNANDEZ E., 2006: The eruptive history of Turrialba volcano, Costa Rica, and potential hazards from future eruptions. In: ROSE, W. I., BLUTH, G. J. S., CARR, M. J., EWERT, J. W., PATINO, L. C. & VALLANCE, J. W. (eds): Volcanic hazards in Central America.- Geol. Soc. Amer. Spec.Paper, 412: 235-257. [ Links ]
RUPP, B., BURSIK, M., NAMIKAWA, A., PATRA, A., SAUCEDO, R., MACÍAS, J.L. & RENSCHLER, C., 2006: Computational modeling of the 1991 block and ash flows at Colima Volcano, Mexico. Analysis, 2402(11), 223-237.- En: SIEBE, C., MACÍAS, J.L., AND AGUIRRE-DÍAZ, G.J., (eds): Neogene-Quaternary continental margin volcanism: A perspective from México.- Geol. Soc. Amer. Spec. Paper 402: 237-252. [ Links ]
SAUCEDO, R. MACIAS, J., BURSIK, M.I., MORA, J.C., GAVILANES, J.C. & CORTES, A., 2002: Emplacement of mpyroclastic flows during the 1998-1999 eruption of Volcan de Colima, Mexico.-J. Volcanol. Geothermal Res. 117(1-2): 129-153. [ Links ]
SAVAGE, S. B. & HUTTER, K., 1989: The motion of a finite mass of granular material down a rough incline.- J. Fluid Mechanics, 199: 177-215. [ Links ]
SAVAGE, S. B. & HUTTER, K., 1991: The dynamics of avalanches of granular materials from initiation to runout. Part I: Analysis.- Acta Mechanica, 86(1-4): 201-223. [ Links ]
SHERIDAN, M.F., STINTON, A. & PATRA, A., 2005: Evaluating TITAN2D mass-flow model using the 1963 Little Tahoma Peak avalanches, Mount Rainier, Washington.- J. Volcanol. 139(1-2): 89102. [ Links ]
SHERIDAN, M. F., PATRA, A. K., DALBEY, K. & HUBBARD, B., 2010: Probabilistic digital hazard maps for avalanches and massive pyroclastic flows using TITAN2D. In: Groppelli, G. & VIERECK-GOETTE, L., (eds.): Stratigraphy and Geology of Volcanic Areas.- Geol, Soc. Amer. Spec. Paper, 464: 281-291. [ Links ]
STEFANESCU, E. R., BURSIK, M. I. & PATRA, A. K., 2009: Effect of Digital Elevation Models on geophysical flow model output.-Natural Hazards, 62(2): 635-656. [ Links ]
STINTON, A. J., SHERIDAN, M. F., PATRA, A. K., DALBEY, K. R. & NAMIKAWA, L. M., 2004: Integrating variable bed friction into the TITAN2D mass-flow model: applications to the Little Tahoma Peak Avalanches (Washington).-Acta Vulcanol. 16(1-2): 153-163. [ Links ]
SULPIZIO, R., CAPRA, L., SAROCCHI, D., SAUCEDO, R., GAVILANES-RUIZ, J. & VARLEY, N., 2010: Predicting the block-and-ash flow inundation areas at Volcán de Colima (Colima, Mexico) based on the present day (February 2010) status.- J. Volcanol. Geothermal Res. 193(1-2): 49-66. [ Links ]
TAKAHASHI, T. & TSUJIMOTO, H., 2000: A mechanical model for Merapi-type pyro-clastic flow.- J. Volcanol. Geothermal Res. 98: 91-115. [ Links ]
TORO, E. & BILLETT, S., 1997: A unified Riemann-Problem Based Extension of the Warming-Beam and Lax-Wendroff Schemes.- IMA J. Numerical An. 17: 61-102. [ Links ]
YU, B., DALBEY, K., WEBB, A. & BURSIK, M., 2009: Numerical issues in computing inundation areas over natural terrains using Savage-Hutter theory.- Natural Hazards, 50(2): 249-267. [ Links ]
1. Ddepartment of Geology, University of South Florida, Tampa, Florida 33620-5201, USA Corresponding author: sylvain@usf.edu
2. Department of Geology and Center for Geohazard studies, SUNY University at Buffalo, Buffalo, New York 14260-1350, USA.
3. Deparment of Earth Sciences, University of Concepción. Victor Lamas 1290, Concepción, Región del Bíobio, Chile.
Recibido: 05/06/2013; aceptado: 08/09/2014

