


 English (pdf)
 Article in xml format
 Article references
 Send this article by e-mail
 Cited by SciELO
  Similars in
SciELO
Similars in
SciELO  uBio
uBio 
 Permalink
Introduction
Tropical forests cover 10 % of the terrestrial surface and account for 50 % of worldwide tree diversity (Mayaux et al., 2005). More than half of tropical forest areas are composed of tropical rainforests, which are characterized by a high diversity of tree species (Lewis et al., 2009). Tropical rainforests have a significant influence on global patterns of biodiversity, ecosystem ecology, productivity, and biogeochemical cycles (Malhi, 2010). According to Guevara-Andino et al. (2019) in the Ecuadorian Amazon rainforest there are 2296 tree species; however, approximately 4.2 million hectares of this ecosystem have been impacted by many anthropogenic activities related to oil extraction (opening of new roads, construction of platforms, mud and drill cutting cells, contaminated soil treatment units, and settlement of camps and heliports) (Rivera-Parra et al., 2020). These activities have resulted in high deforestation, acceleration of soil erosion, decrease in water infiltration, increase in superficial runoff (Bertzky et al., 2011), and reduction of fauna species (Arroyo-Rodríguez et al., 2007; Pozo-Rivera et al., 2023).
In response, the Ecuadorian government has implemented reforestation programs on sites affected by oil extraction processes since 2000 (Villacís, 2016). Reforestation activities began with the production of seedlings in plant nurseries, where various native and exotic tree species are produced (primarily timber, fruit, and ornamental plants), later, seedlings are transplanted into the affected soils when reach 30 cm in height. Studies to evaluate the most suitable species for reforestation sites (previously affected by oil extraction processes) have been conducted in plant nurseries (Villacís, Armas et al., 2016), as well as in open-field affected sites (Villacís, Casanoves et al., 2016).
Nevertheless, it is unknown whether the growth and survival rates of the sapling woody species on disturbed sites over a period of two years is a good indicator of their performance. In this sense, the long-term performance of woody species can be determined based on their functional traits (Poorter & Bongers, 2006), particularly leaf and stem traits (Martínez-Encino et al., 2013). The functional traits are fundamental to the understanding of plant adaptations and can be useful for selecting suitable species to restore degraded ecosystems (Wang et al., 2021). Additionally, functional traits encompass the morpho-phenological characteristics of plants that have indirect effects on their physical structure, affecting key biological processes such as growth, reproduction, and survival (Yadav et al., 2022). For example, Freschet et al. (2010) and Pérez-Harguindeguy et al. (2016) indicated that trees with high foliar concentrations of nitrogen and phosphorus, as well as large specific leaf areas, demonstrated rapid growth rates. Moreover, Sterck et al. (2006) found that trees with low stem specific density exhibited faster growth rates, whereas trees with high stem specific density had a higher survival rate.
Because the long-term growth assessment of woody species could be expensive, functional traits could be good indicators of forest species performance. Maire et al. (2013) found that functional traits were related to the growth of individual plants. In other studies, the high specific leaf area and low stem specific density of the trees have been found to be associated with their fast growth; furthermore, the low specific leaf area and high stem specific density of the trees were associated with high survival (Poorter et al., 2008; Rüger et al., 2012). Leaf functional traits have been used to explain species-specific growth rates and have contributed to a better understanding of tree growth strategies and the structure and dynamics of forest communities (Adler et al., 2014). Although the relationships between functional traits and species growth in tropical forest ecosystems have been often studied (Werden el at., 2018), no studies have been conducted in sites disturbed by oil extraction processes. The information about the performance of woody species in restored Amazonian tropical ecosystems and their relationships with functional traits will constitute a valuable contribution to scientific knowledge. In this study, the performance of twenty-five woody species planted on soils affected by oil extraction activities years was evaluated. Using data for a 24 month growing period for twenty-five woody species, we correlated species performance (growth diameter, growth height, survival and integral response index) with seven functional traits related to leaf (Leaf Size, Leaf Minimum Unit, Specific Leaf Area, Leaf Dry Matter Content, Leaf Tensile Strength, Leaf Nitrogen Concentration and Leaf Phosphorus Concentration), and one stem functional traits (Stem Specific Density). The following two hypotheses were tested: (i) some plant functional traits differed between woody species according to their performance on soils affected for oil extraction activities, and (ii) the performance of all woody species can be predicted simultaneity by leaf and stem functional traits.
Materials and methods
Study area: The study was performed in the Sucumbíos (0°5’ S & 76°53’ W) province of Ecuador. The region has an average altitude of 328 m a.s.l., a mean annual rainfall of 3 000 mm, a mean annual temperature of 25 °C, a relative humidity of 85 % and a heliophany of 12 h day-1. The area is classified as tropical rainforest (Peel et al., 2007). The soils of the Ecuadorian Amazon are acidic, have low levels of nutrients and high aluminum contents (Villacís, Armas et al., 2016).
Selection of species and disturbed sites: The 25 woody species selected were mostly produced in the Ecuadorian Amazon (Table 1). These species have been used in remediation programs of disturbed soils, mainly for their timber, forage and fruit uses (Villacís, Armas, et al., 2016; Villacís, Casanoves et al., 2016).
Table 1 Taxonomic classification and uses of restoration woody species.
| Species | Family | Use | Origin | Nitrogen fixer |
| Acnistus arborescens (L.) Schltdl. | Solanaceae | Timber/Medicinal | Native | No |
| Apeiba membranacea Spruce ex. Benth. | Malvaceae | Ornamental/Medicinal | Native | No |
| Averrhoa carambola L. | Oxalidaceae- | Timber/Fruit | Exotic | No |
| Cedrela odorata L. | Meliaceae | Timber | Native | No |
| Cedrelinga cateniformis (Ducke) Ducke. | Fabaceae | Timber | Native | Yes |
| Gmelina arborea Roxb. ex Sm. | Lamiaceae | Timber | Native | No |
| Guarea purusana C. DC. | Meliaceae | Timber | Native | No |
| Inga densiflora Benth. | Fabaceae | Timber/Fruit | Native | Yes |
| Leucaena leucocephala (Lam.) de Wit | Fabaceae | Forage | Exotic | Yes |
| Morinda citrifolia L. | Rubiaceae | Fruit | Exotic | No |
| Myrcia aff. fallax | Myrtaceae | Timber | Native | No |
| Myroxylon balsamum (L.) Harms | Fabaceae | Timber/Medicinal | Native | Yes |
| Nephelium lappaceum L. | Sapindaceae | Fruit | Native | No |
| Ochroma pyramidale (Cav. ex Lam.) Urb. | Malvaceae | Timber | Native | No |
| Ormosia macrocalyx Ducke | Fabaceae | Timber | Native | Yes |
| Piptadenia pteroclada Benth. | Fabaceae | Timber | Native | Yes |
| Platymiscium pinnatum (Jack.) Dougand | Fabaceae | Timber | Native | Yes |
| Pourouma cecropiifolia Mart. | Urticaceae | Fruit/Medicinal | Native | No |
| Schizolobium parahyba (Vell.) S.F. Blake | Fabaceae | Timber | Native | Yes |
| Stryphnodendron porcatum D.A.Neill & Occhioni f. | Fabaceae | Timber | Native | Yes |
| Syzygium jambos (L.) Alston | Myrtaceae | Fruit | Native | No |
| Syzygium malaccense (L.) Merr. & L.M.Perry | Myrtaceae | Fruit | Exotic | No |
| Tapirira guianensis Aubl. | Anacardiaceae | Timber | Native | No |
| Vitex cymosa Bertero ex Spreng. | Lamiaceae | Timber | Native | No |
| Zygia longifolia (Humb. & Bond. ex Willd.) Britton & Rose | Fabaceae | Timber | Native | Yes |
In sites affected by the oil extraction processes, the superficial layer of soil and all vegetation have been removed, and they contain residues of hydrocarbons and heavy metals. These sites present an average pH of 4.6, 0.5 % of organic matter, 5.3 mg kg-1 of Al, 5 341.73 mg kg-1 of total petroleum hydrocarbons, 5.3 mg kg-1 of Cd, 33.2 mg kg-1 of Ni and 23.76 mg kg-1 of Pb. More details on the physical and chemical characteristics of these sites can be found in Villacís, Casanoves et al. (2016). Eighteen permanent sampling plots were established and five 6-month-old seedlings of each 25 species were randomly planted in each plot (125 individuals per plot), at a distance of 4×4 m. The saplings that died due to post-transplant shock in the first month were replanted with new individuals of the same species. Every 4 months weed controls were carried out with a motor trimmer, eliminating all the vegetation within a 1 m radius from the stem of the seedlings.
Measured variables: In each plot sapling survival was measured by dividing the number of two-year-old living plants by the initial number of plants transplanted. The diameter and height at the time of transplantation and two years after transplantation were determined. The diameter of saplings was measured at 10 cm from the base of the plant, using a digital caliper and plant height was measured from the base to the apical meristem of the tallest stem, using a laser hypsometer. Subsequently, we estimated the integrated response index (IRI) which considers survival rates and growth variables and serves to determine the performance of saplings in an integrated way. The IRI was estimated according to the following equation:
IRI= survival percentage × RGR height × RGR diameter. Where: RGR height (height rate growth in cm / month) = (ln (final height) -ln (initial height)) / 24 months; RGR diameter (diameter rate growth in mm / month) = (ln (final diameter) -ln (initial diameter)) / 24 months (Elliott et al., 2003).
For the evaluation of functional traits, five adult individuals from the natural forest located along a longitudinal gradient in Sucumbíos Province were selected (17 947 km²; Fig. 1).
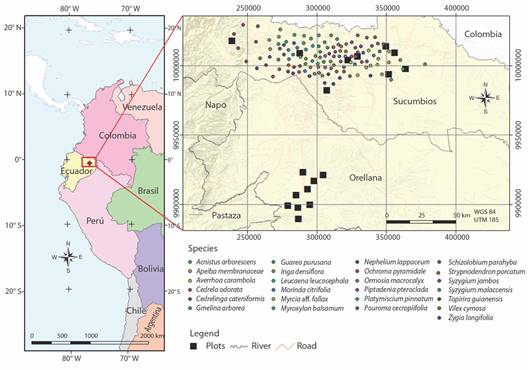
Fig. 1 Geographical location of 18 plots, and 125 sampled trees of 25 woody species in the Ecuadorian Amazon.
Leaf and stem plant functional traits that are commonly used to characterize growth strategy of plants were evaluated. In each specimen, seven leaf functional traits ((leaf size (LS), leaf minimum unit (LMU), specific leaf size (SLA), leaf dry matter content (LDMC), leaf nitrogen concentration (LNC), leaf phosphorus concentration (LPC), leaf tensile strength (LTS), and one stem functional traits ((stem specific density (SSD)) were measured (Chave, 2006; Cornelissen et al., 2003).
The LS, LMU and SLA are indicators of the adaptation to the environment and to the strategies and the use of plant resources (Vendramini et al., 2002). The LDMC is related to the average density of leaf tissues (Cornelissen et al., 2003) and reflects an exchange between plant performance and rapid biomass production. To estimate the LS, SLA, and LDMC, five leaves of each individual were collected. Each leave using the Midebmp Image Analysis version 4.2 program was scanned and the LS in mm2 was measured (Ordiales-Plaza, 2000). The SLA in mm2 mg-1 by dividing the leaf size by the leaf dry weight was estimated (Hunt, 1990). The LDMC in mg g-1 by dividing the leaf dry weight by leaf fresh weight was calculated.
The LNC and the NPC foliar are vital elements of the photosynthesis functioning of the leaves (Bongers & Popma, 1990). A sample of fresh leaves without petioles or rachis of each sampled specimen to measure the LNC (Micro Kjheldal total combustion method) and the LPC (colorimeter method) was estimated (Cornelissen et al., 2003). The LTS is an indicator of the inverted carbon ratio in the structural protection of the photosynthetic tissues (Cornelissen et al., 2003). A rectangular section 1 cm wide by 4 cm long in the direction of the vein of a fully sound expanded leaf was extracted; the section was subjected to traction in a Tearing Apparatus and the LTS in N mm-1 (maximum force resisted by leaf section at the instant of its rupture) was obtained (Hendry & Grime, 1993). Finally, the SSD is directly related to the carbon accumulation and flows and inversely related to the stem growth rate, mortality rate and plant reproduction time (Swenson & Enquist, 2007). A cylindrical wood samples from each individual with a 6.2 mm auger drill was collected; the volume and dry weight of cylinder was measured, and the SSD in g cm-3 by dividing dry weight by cylinder volume was calculated. These data are available in the TRY database (Kattge et al., 2020).
Data analysis: In order to group woody species according to their performance a cluster analysis (Ward method and Euclidean distance) for integral response index (IRI) was performed to obtain two groups (high and low performance). Differences in IRI and quantitative traits between species of high and low performance were analyzed, by using general linear models; subsequently a less significant difference (LSD) post hoc test was performed (α = 0.05). Correlation analyses between functional traits and growth height, growth diameter and survival of species using Pearson correlations analysis were performed. To fit the performance of woody species in function of plant functional traits, a multiple regression models were built. Using leaf size, specific leaf area, leaf nitrogen concentration, leaf phosphorus concentration, leaf minimum unit, leaf dry matter content, stem specific density and leaf tensile strength, as predictor variables, we predicted the IRI. The multiple regression model was based on the assumption that residuals are normally distributed and their variance are homogeneous (Wright & Cannon, 2001). Normality and homogeneity of variances assumptions were evaluated with graphical analysis of residuals. We used partial residuals graphs to evaluate when was necessary or not the inclusion of polynomial terms for each trait. The selection and evaluation of the best regression model was based on the coefficient of determination (adjusted R2) and mean squared prediction error (MSPE), Akaike information criterion (AIC), Bayesian information criterion (BIC) and p-value. We use Variance Inflation Factor (VIF) values to evaluate multicollinearity. In order to compare the effect of measured traits on the IRI we use the relative variation explained for each trait. All analyzes were performed using InfoStat statistical software (Di Rienzo et al., 2020).
Results
Performance of woody species: Based on the integral response index, cluster analysis exhibited two well-differentiated groups of plants (Fig. 2). The first group formed by Cedrelinga cateniformis, Myrcia aff. fallax, Piptadenia pteroclada, Platymiscium pinnatum, Tapirira guianensis, Vitex cymosa and Zygia longifolia species, showed high IRI mean value (high performance woody species). The second group formed for Acnistus arborescens, Apeiba membranaceae, Averrhoa carambola, Cedrela odorata, Gmelina arborea, Guarea purusana, Inga densiflora, Leucaena leucocephala, Myroxylon balsamum, Morinda citrifolia, Nephelium lappaceum, Ochroma pyramidale Ormosia macrocalyx Pourouma cecropiifolia, Schizolobium parahyba, Stryphnodendron porcatum, Syzygium jambos and Syzygium malaccensis species, displayed a low IRI mean value (low performance woody species). The growth diameter, growth height and integral response index was higher in high performance woody species than in low performance woody species. Nevertheless, the survival was similar for the high and low performance sapling woody species (Table 2).
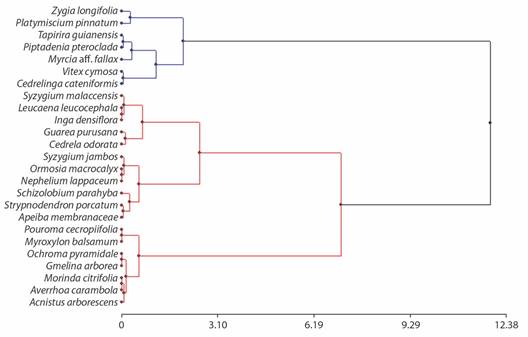
Fig. 2 Dendrogram of classification of 25 sapling woody species, obtained by hierarchical cluster analysis (Ward method and Euclidean distance) using integral response index (IRI).
Table 2 Performance variables and functional traits for high and low performance woody species on soils affected for oil extraction activities.
| Variables | Species performance | F-Fisher | P-value | |||
| High | Low | |||||
| Performance | ||||||
| Survival (%) | 85.38 ± 4.52 a | 85.18 ± 2.55 a | 0.00 | 0.9687 | ||
| Growth diameter (mm) | 45.79 ± 3.08 a | 19.50 ± 1.92 b | 52.29 | 0.0001 | ||
| Growth height (cm) | 1.45 ± 0.12 a | 1.01 ± 0.08 b | 9.71 | 0.0049 | ||
| Integral response index (IRI) | 0.37 ± 0.08 a | 0.22 ± 0.03 b | 6,19 | 0.0205 | ||
| Functional traits | ||||||
| Leaf size (mm2) | 62 702.99 ± 14 146.56 a | 26 696.30 ± 8 821.93 b | 4.66 | 0.0415 | ||
| Specific Leaf Area (mm2 mg-1) | 59 564.60 ± 13 809.31 a | 17 950.28 ± 8 611.62 b | 6.54 | 0.0176 | ||
| Leaf Nitrogen Concentration (%) | 2.64 ± 0.41 a | 2.79 ± 0.25 a | 0.10 | 0.7593 | ||
| Leaf Phosphorus Concentration (%) | 0.20 ± 0.03 a | 0.19 ± 0.02 a | 0.08 | 0.7788 | ||
| Leaf Minimum Unit (mm2) | 29 396.69 ± 12 782.49 a | 13 104.35 ± 7 971.29 a | 1.17 | 0.2907 | ||
| Leaf Dry Matter Content (mg g-1) | 0.38 ± 0.04 a | 0.37 ± 0.02 a | 0.17 | 0.6835 | ||
| Stem Specific Density (g cm-3) | 0.56 ± 0.04 a | 0.45 ± 0.03 b | 4.52 | 0.0444 | ||
| Leaf Tensile Strength (N mm-1) | 4.63 ± 0.49 a | 3.88 ± 0.30 a | 1.72 | 0.2027 | ||
Values are means ± error standard. Different letters in each row indicate significant differences (LSD, post hoc test, P < 0.05).
Mean values for leaf size, specific leaf area and Stem Specific Density were higher in saplings of high performance woody species. The rest of plant functional traits did not differ between saplings woody species of high and low performance (Table 2).
Correlations between variables: Correlation analysis showed a negative relationship between Survival and Leaf Tensile Strength. The rest of correlation were non-significant (Table 3).
Table 3 Pearson correlation coefficients (r) between functional traits and average absolute growth in height (height growth), diameter (diameter growth) and survival after 24 months (survival, %) for 25 woody species planted on degraded soils in Amazonian Basin.
| Functional traits | Growth diameter (mm year-1) | Growth height (cm year-1) | Survival (%) | |||
| r | P-value | r | P-value | R | P-value | |
| Leaf traits | ||||||
| Leaf Size (mm2) | -0.05 | 0.8208 | -0.22 | 0.2864 | 0.07 | 0.7289 |
| Specific Leaf Area (mm2 mg-1) | -0.08 | 0.6907 | -0.15 | 0.4790 | -0.16 | 0.4378 |
| Leaf Nitrogen Concentration (%) | 0.30 | 0.1479 | 0.36 | 0.0798 | -0.01 | 0.9610 |
| Leaf Phosphorus Concentration FPC (%) | -0.01 | 0.9667 | -0.09 | 0.6668 | -0.09 | 0.6622 |
| Leaf Minimum Unit (mm2) | -0.10 | 0.6223 | -0.28 | 0.1704 | 0.02 | 0.9109 |
| Leaf Dry Matter Content (mg g-1) | 0.18 | 0.3768 | 0.11 | 0.6081 | 0.18 | 0.4019 |
| Leaf Tensile Strength (N mm-1) | -0.31 | 0.1305 | -0.32 | 0.1131 | -0.45 | 0.0236 |
| Stem trait | ||||||
| Stem Specific Density (g cm-3) | -0.05 | 0.7973 | 0.07 | 0.7441 | 0.11 | 0.5915 |
The best multiple regression model shows the higher adjusted R2 and the lowest values of AIC and BIC. For LS, SLA, LDMC and LNC a second order polynomial was used (Table 4).
Table 4 Regression coefficients and summary statistics for the best model to predict IRI from functional traits.
| Coefficient | Estimation | Standard error | t-Student | P-value | CpMallows |
| Constant | 0.0660 | 0.3077 | 0.2146 | 0.8337 | |
| LPC % | -1.1901 | 0.5454 | -2.1822 | 0.0497 | 15.7619 |
| LMU (mm2) | 4.6E-06 | 1.6E-06 | 2.8510 | 0.0146 | 19.1281 |
| SSD (g cm-3) | 0.9830 | 0.1751 | 5.6122 | 0.0001 | 42.4972 |
| LTS (N mm-1) | -0.0479 | 0.0197 | -2.4283 | 0.0318 | 16.8967 |
| LS (mm2) | -5.5E-06 | 2.1E-06 | -2.6226 | 0.0223 | 17.8781 |
| LS2 (mm2) | 2.7E-11 | 1.4E-11 | 1.9828 | 0.0708 | 14.9317 |
| SLA (mm2 mg-1) | 1.3E-05 | 2.6E-06 | 4.8415 | 0.0004 | 34.4398 |
| SLA2 (mm2 mg-1) | -6.2E-11 | 1.8E-11 | -3.3817 | 0.0055 | 22.4361 |
| LDMC (mg g-1) | -3.1276 | 1.2474 | -2.5073 | 0.0275 | 17.2863 |
| LDMC2 (mg g-1) | 5.2198 | 1.6910 | 3.0868 | 0.0094 | 20.5285 |
| LNC % | 0.2376 | 0.1011 | 2.3494 | 0.0368 | 16.5198 |
| LNC2 % | -0.0323 | 0.0155 | -2.0883 | 0.0588 | 15.3608 |
SLA = Specific Leaf Area; LDMC = Leaf Dry Matter Content; LTS = Leaf Tensile Strength; LS = Leaf Size; LMU = Leaf Minimum Unit; SSD = Stem Specific Density; LNC = Leaf Nitrogen Concentration; LPC = Leaf Phosphorus Concentration.
The estimated regression model predicted 90 % of the total IRI variability, and it is represented by the following equation:
IRI = 0.066 - 1.19 × LPC + 4.59 E-6 × LMU + 0.98 * SSD - 0.05 * LTS 5.53 E-6 × LS + 2.68 E-11 × LS2 + 1.31E-5 × SLA - 6.22 E-11 × SLA2 - 3.12 × LDMC + 5.21 × LDMC2 + 0.23 × LNC - 0.032 × LNC2
The IRI showed a positive relationship with SLA, LMU, LNC and SSD and a negative relationship with LS, LPC, LDMC and LTS.
Discussion
According to our knowledge, this is the first report that approach the functional traits and the performance of woody species planted on soils affected for oil extraction activities. The woody species of high performance showed greater leaf size, specific leaf area and Stem Specific Density than low performance woody species. The performance of woody species using IRI was explained using leaf and stem functional traits as regressor variables.
Differences in functional traits between woody species according to their performance: The High performance woody species (Cedrelinga cateniformis, Myrcia aff. fallax, Piptadenia pteroclada, Platymiscium pinnatum, Tapirira guianensis, Vitex cymosa and Zygia longifolia) showed a high Leaf Size, that enables them to maximize light capture (Poorter at al., 2006). Moreover, the nutrient cycling processes of these species are more efficient due to their high photosynthetic capacity per unit of leaf area (Denslow, 1996; Le Roux et al., 2001; Mooney et al., 1981; Reich et al., 1998 ). This character trait is favorable at the beginning of restoration processes because the disturbed sites are totally exposed to the sun and do not have any type of vegetation. Similar results were reported by Poorter and Evans (1998), who found that fast-growing tree species presented high leaf Area. Additionally, high performance woody species tend to have a high Leaf Dry Matter Content. This allows them capture and use available resources in an efficient way (Tecco et al., 2013), due to the greater stiffness of its leaves (Niinemets, 2001) because of the lignification of the thick and rigid cell walls (Niinemets & Kull, 1998). Similar results were reported by Martínez-Garza et al., (2013), who found that tree plants with higher Leaf Dry Matter Content had higher survival. The high Specific Stem Density of high performance woody species reflects an elevated growth rate (Santiago et al., 2004), which is essential to compete with aggressive colonizing vegetation. This allows the saplings increase their performance under the adverse conditions of disturbed soils (Villacís, Casanoves et al., 2016). However, other studies have reported that trees with higher Specific Stem Density have presented higher survival, but lower diameter growth (Fortunel et al., 2016; Poorter et al., 2008). Finally the low Leaf Tensile Strength of high performance woody species favors the rapid growth and decomposition of its biomass (Obando-Vargas, 2003).
On the other hand, the low performance woody species showed a low Leaf Size and Specific Leaf Area, that indicate that the species of this group must invest more amounts of energy into the structural protection of their leaves (Wright et al., 2004). In addition, species with low Leaf Size and Specific Leaf Size have low assimilation and respiration rates, and high survival (Lusk, 2002). Aditionally, the low Leaf Dry Matter Content reflects a slow process of nutrient conservation in low performance woody species (Messier et al., 2010). Pérez-Harguindeguy et al. (2016), reported that the species with low growth rates presented low levels of Leaf Dry Matter Content. The low performance woody species showed less Specific Stem Density than other species. Similar results were found in several studies concerning rainforest saplings (Muller-Landau, 2004) and trees (King et al., 2005). Finally, due to their high Leaf Tensile Strength, low performance woody species have a greater proportion of vascular tissues, fibers or sclerenchyma, and high tissue density (Tecco et al., 2010; Wright & Cannon, 2001), which was reflected in lower growth rates and lower performance compared to high performance woody species.
Relationship between functional traits and performance of woody species: Considering that stem specific density is directly related with the content, accumulation, and fluctuations of carbon (Wiemann & Williamson, 2002) and inversely related with stem growth rate, mortality rate, and breeding time (Swenson & Enquist, 2007), woody species with lower stem specific density will have greater possibilities of growing under the adverse conditions of degraded sites, due to their capacity to produce biomass quickly (Díaz et al., 2004) and survive the adverse conditions of the disturbed soils.
In our study, the leaf and stem functional traits were good predictors of the performance of the woody species evaluated with IRI. Similar studies carried out with plants grown under controlled conditions and in the open field, have also reported mathematical models that have explained the performance of tree species based on their functional traits (Grime & Hunt, 1975; Rüger et al., 2012). However, Paine et al. (2015) point out that functional traits are not good predictors of tree plant growth at a global scale. These differences could possibly be explained because the woody species performance is not only affected by its functional traits, but also by the adaptation of the traits to its environment. In this sense, the conditions of the disturbed soils may have influenced the performance of the trees in addition to their functional traits, for which more in-depth studies are necessary to validate this hypothesis. The estimated regression model predicted 90 % of the total IRI variability, indicating that there are other traits or factors that should be considered to explain greater variability. Within the best multiple regression model estimated to predict the performance of the trees of the woody species planted on disturbed soils, eight quantitative functional traits (seven of the leaf and one of the stems) explained the performance of the woody species.
The functional traits SLA, LMU, LNC and SSD, showed a directly proportional relationship with the IRI of the woody species. Among these traits, SSD explained the highest relative percentage of the variance. Although the literature does not report studies on relationships between the IRI and functional traits (growth in diameter + growth in height + survival), studies carried out by Iida et al. (2014) and Gibert et al. (2016) reported that the stem specific density represents the best trait to predict the woody species growth and survival. On the other hand, LS, LPC, LDMC and LTS showed an inverse relationship with the IRI of the woody species. LDMC explained the highest relative percentage of the total variability. Negative relationships between the LDMC and the relative growth rates of the species have been reported in studies by Pérez-Harguindeguy et al. (2016). The negative rate of change between IRI and LPC differs from the results found by Chaturvedi et al., (2011) and Cernusak et al., (2010), who reported positive relationships between the growth rate and the LPC.
The multiple regression model estimated by the combination of leaf and stem functional traits, explained better the woody species performance. This finding provides empirical evidence that the woody species performance is the integrated result of several leaf and stem functional traits (Iida et al. 2014). Therefore, in our research the woody species performance was explained better by several foliar and stem functional traits, than for a single functional trait (Li et al., 2017).
Implications for forest restauration: Our results are specific to predict the performance of young woody species planted in soils affected by oil extraction processes in Amazon Basin. However, our findings should not be correlated with the performance of adult woody species growing in other environments. Additionally, the performance of saplings not only depends on the local environment, but also of the functional traits of the species and their interaction (Uriarte et al., 2016). The environmental variation was not considered in our models and therefore contributes to the non-explained variability. On the other hand, the search of additional functional traits that provide predictions on the performance of woody species must also be specific for each phonological stage. In this sense, others functional traits such as physiological or allometric, which are well correlated with common performance must be identified. We must need to consider the possibility that the relationship between any functional trait and performance of woody species depends on the values of other unidentified functional traits (Marks & Lechowicz, 2006).
Ethical statement: the authors declare that they all agree with this publication and made significant contributions; that there is no conflict of interest of any kind; and that we followed all pertinent ethical and legal procedures and requirements. All financial sources are fully and clearly stated in the acknowledgments section. A signed document has been filed in the journal archives.

