


 English (pdf)
 Article in xml format
 Article references
 Send this article by e-mail
 Cited by SciELO
  Similars in
SciELO
Similars in
SciELO  uBio
uBio 
 Permalink
Introduction
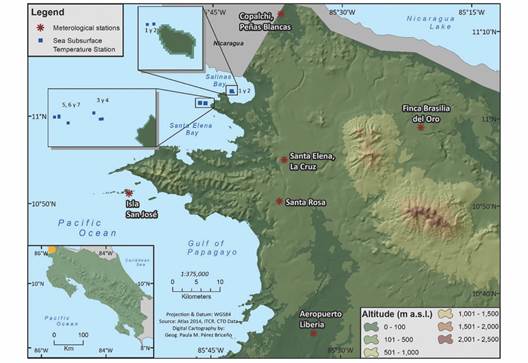
Bahía Salinas in Costa Rica is located on the Pacific slope, northwest of the country at the Costa Rica-Nicaragua border and has a marked east-west axis (Fig. 1). This region belongs to the Central American Dry Corridor (CADC), a sub-region in the isthmus that is relatively drier than the rest of the territory, which extends along the Pacific littoral from western Guatemala through northern Costa Rica. The CADC is a mainly rural area characterized by a marked precipitation seasonality, climate change vulnerability and rich biodiversity (Gotlieb, Pérez-Briceño, Hidalgo & Alfaro, 2019; Quesada-Hernández, Calvo-Solano, Hidalgo, Pérez-Briceño, & Alfaro, 2019).
Sea temperature in Bahía Salinas could be modulated by synoptic trade wind and other large-scale systems (Chelton, Freilich, & Esbensen, 2000). Bahía Salinas is in an area where the climate variability, product of coastal upwelling (December-April), affects the behavior of sea surface temperatures (Amador et al., 2016; McCreary, Lee & Enfield, 1989; Tisseaux-Navarro, Salazar-Ceciliano, Cambronero-Solano, Vargas-Hernández, & Marquez, 2021; Vargas, 2004), which can descend to 17º C in the nearby Gulf of Papagayo (Alfaro & Cortés, 2012). Notice that other factors that influence this cooling is the latent heat transfer by evaporative processes and the vertical mixing by turbulent processes (Amador et al. 2016; Tisseaux-Navarro et al., 2021). The upwelling is associated with the trade wind strength over the isthmus. Amador et al. (2016) indicate that trade winds owe their origin to the north-south temperature gradient between the poles and the Equator. As the Earth rotates, the winds turn to the right, reacting to the Coriolis force in the North Hemisphere. Trades are observed as north-easterlies in Central America. On the Pacific slope of Costa Rica, the magnitude of the trade wind is normally strongest during boreal winter and spring (December to May), and decreases during the summer and autumn, between June and November (Alfaro, 2002; Alfaro, Chourio, Muñoz, & Mason, 2018).
On the large scale, Maldonado, Alfaro and Hidalgo (2018) and Durán-Quesada, Sorí, Ordoñez and Gimeno (2020) described that El Niño-Southern Oscillation (ENSO), as a result of coupled ocean-atmosphere dynamics in the tropical Pacific, is the leading mode of interannual variability in Central America. The two ENSO phases, El Niño and La Niña are associated with warming and cooling events and goes hand in hand with the basin-scale tropical Pacific anomalies, including Bahía Salinas. This agrees with Alfaro and Lizano (2001), who found that ENSO signal dominates the inter-annual variability in the Golfo de Papagayo and Bahía Salinas region, finding a correlation of 0.77 between Niño 3.4 index and the SSTs of the Costa Rican North Pacific. A warming in the Equatorial Tropical Pacific could influence the appearance of warm conditions in the Costa Rican North Pacific (Alfaro et al., 2012). The study of these warm events is important for the populations of existing coral, as bleaching and mortality have been reported in region during the occurrence of some of these warm events (e.g. Jiménez, Cortés, León & Ruiz, 2001). Additionally, a cold event in the bay can occur by the influence of a cooling in the Equatorial Tropical Pacific. However, if warm Sea Surface Temperature (SST) anomalies in the Eastern equatorial Pacific occurs in concordance with cool SSTs in the Tropical North Atlantic (TNA)-Caribbean, the magnitude of the trade wind could be reinforced, triggering a cold event in Bahía Salinas (Alfaro & Cortés, 2012; Alfaro et al., 2012).
In the large scale, the most important trade wind modulator is the North Atlantic Subtropical High (NASH; Alfaro et al., 2018; Taylor & Alfaro, 2005) due to the easterly trades found on its equatorward flank. With the onset of boreal spring, for example, the subtropical high moves offshore and trade wind intensity decreases. The variation in the strength of the trades is an important determinant of climate throughout the year for Central America. During the onset of the rainy season, there is also a weak trade inversion with altitude, the ocean warms, and atmospheric moisture is abundant. The region is consequently at its wettest in the boreal late spring, during summer and early autumn seasons. So, this NASH’s trade wind modulation, produces a seasonal change in wind speed (e.g., strongest in boreal winter and weakest in boreal spring trough autumn), been one of the most relevant features in the Eastern Tropical Pacific (ETP, Amador et al., 2016).
In addition, trade winds could be modulated by synoptic scale systems. Significant synoptic influences include the intrusions of polar fronts of mid-latitude origin which modify the dry winter and early summer climates of the entire Caribbean and Central American region (Chinchilla, Gutiérrez, & Zárate, 2017; Maldonado et al., 2018; Zárate-Hernández, 2013). During winter-spring, cold fronts entering the Caribbean and that reinforce trade winds over Central America. As mentioned in Alfaro and Cortés (2012) and according to Amador et al. (2016), during the boreal winter, the incursion of polar air masses moving toward the south entering the Caribbean Sea, produces strong pressure gradients between the Caribbean Sea and the ETP. This wind with eastern component, is channeled through topographic depressions in southern Mexico and Central America. One of these steps is located between the lowlands of central Nicaragua and northern Costa Rica. The winds produced by this channeling are commonly called “Papagayos” and have Jet Stream strength (Amador et al., 2016). Their name is due to the gulf of the same name located in the North Pacific of Costa Rica, off Bahía Salinas. The other important synoptic system that modulates the trade wind strength is the Caribbean Low-Level Jet (CLLJ; Amador, 2008). Analyzing the CLLJ annual cycle, Amador (2008) found that this jet presents two maxima, one in July, the greatest in magnitude and a secondary maximum in February, which also influences the eastern wind reinforcement over the northern portion of Costa Rica. It has been documented that the funneling of these strong northeasterly winds through passages in the mountains produces upwelling in the semi-enclosed bodies in the Pacific coast of Costa Rica (Alfaro & Cortés, 2012; Fiedler & Lavín, 2019; Legeckis, 1988), because strong winds drive the surface water off a gulf or a bay, and the displaced water is then replaced by cooler water from the depths.
The objective of this work is both to study the warm and cold events that could be inferred by studying the registered Sea Subsurface temperature (SSbT) in Bahía Salinas, and also to analyze the large scale conditions and synoptic systems of the historical sources in which they occurred in order to identify the atmospheric mechanisms that favored their appearance. We consider the event relationship with sources of known variability as El Niño-Southern Oscillation (ENSO), Tropical North Atlantic (TNA) and boreal winter cold front outbreaks. The characterization and understanding of these events could be used to study other biological and chemical oceanographic aspects of the system like natural coastal acidification, species conservation and management (e.g., Arias-Godínez et al., 2019; Cordero-Umaña & Santidrián-Tomillo, 2020; Eisele, Madrigal-Mora, & Espinoza, 2020; Espinoza, Araya-Arce, Chaves-Zamora, Chinchilla, & Cambra, 2020; Sánchez-Noguera et al., 2018; Valverde-Cantillo, Robinson, & Santidrián-Tomillo, 2019). The information is of special interest for local fishermen, since this activity has been one of the most important socioeconomic sectors in Bahía Salinas through its history (e.g. Díaz, Mora, & Madriz, 2019).
Materials and methods
In this section we describe the characteristics of the data files used and how the information was analyzed. First, a Sea Subsurface Temperature Index (SSbTI) was calculated from hourly data from seven stations located at three different points in the bay (Fig. 1), using Hobotemp® sensors, Onset Computer Corp. The records and depths of these stations are variable and range from June 19, 2003 to December 5, 2017. The detail of these stations is shown in Table 1.
Table 1 Sea Subsurface Temperature stations located in Bahía Salinas, Pacific of Costa Rica.
| Station | Latitude (N) | Longitude (W) | Depth range (m) | Record dates (% missing data) |
| Salinas1 | 11º 03.026’ | 85º 42.721’ | 4.6-6.0 | 15/12/2003-05/12/2017 (7.0) |
| Salinas2 | 11º 03.026’ | 85º 42.721’ | 6.7-8.1 | 19/06/2003-05/12/2017 (10.4) |
| Salinas3 | 11º 01.616’ | 85º 45.801’ | 3.3-4.9 | 23/08/2003-05/12/2017 (18.2) |
| Salinas4 | 11º 01.616’ | 85º 45.801’ | 7.4-9.1 | 23/08/2003-27/09/2016 (17.6) |
| Salinas5 | 11º 01.556’ | 85º 46.298’ | 10.5-11.9 | 08/10/2003-05/12/2017 (24.3) |
| Salinas6 | 11º 01.556’ | 85º 46.298’ | 19.7-20.9 | 16/12/2003-05/12/2017 (12.8) |
| Salinas7 | 11º 01.556’ | 85º 46.298’ | 4.5-6.6 | 18/02/2004-22/04/2009 (18.8) |
As the data were taken at different positions and depths, each of the series was normalized to make its records comparable, subtracting the historical monthly average and dividing these anomalies by their historical monthly standard deviation (Wilks, 2019). Subsequently, the gaps of the normalized data were filled in each of the 7 stations, since they presented missing data (Table 1), following the methodology proposed by Ureña, Alfaro and Soley (2016), which combines Auto Regressive models and Principal Components. Then, the hourly data of the seven stations were smoothed applying a triangular moving average of 169 data (Soley, 1994), to filter high-frequency signals, as in Alfaro and Cortés (2012). Finally, the average of the seven smoothed records was estimated to obtain the SSbTI. This temperature index was subsequently used to identify the five coldest and warmest events.
Six meteorological stations, with hourly wind records, were used to create two wind indices. The data from meteorological stations were obtained from the Costa Rican National Meteorological Institute (CRNMI). The detail of these stations is shown in Table 2. First, zonal and meridional component time series were calculated for each record. Then, the records were averaged. Finally, a triangular moving average of 169 data was applied as with the SSbTI, to estimate a zonal and meridional component wind index (hereafter ZCI and MCI, respectively).
Table 2 Meteorological stations used with wind records (red asterisks in Fig. 1).
| Station | Latitude (N) | Longitude (W) | Altitude (m.a.s.l) | Record dates (% missing data) |
| Finca Basilia del Oro | 10°58.983’ | 85°20.833’ | 380 | 01/01/2003-31/12/2017 (8.3) |
| Copalchi, Peñas Blancas | 11°53.617’ | 85°37.090’ | 57 | 10/04/2013-31/12/2017 (6.8) |
| Santa Elena, La Cruz | 10°55.200’ | 85°36.633’ | 270 | 10/11/2004-31/12/2017 (11.7) |
| Santa Rosa, ACG | 10°50.467’ | 85°37.167’ | 315 | 01/04/2012-31/12/2017 (15.3) |
| Liberia, Airport | 10°35.340’ | 85°33.128’ | 89 | 01/01/2003-31/12/2017 (2.2) |
| Isla San José, ACG | 10°51.257’ | 85°54.575’ | 44 | 25/05/2008-17/08/2017 (31.2) |
The monthly meteorological bulletins (https://www.imn.ac.cr/boletin-meteorologico), prepared by the CRNMI, were consulted to analyze the large-scale conditions and synoptic systems in which the five coldest and warmest events (based in the observed anomaly of the SSbTI) occurred in Bahía Salinas as study cases, in order to identify the atmospheric mechanisms that favored their occurrence.
Results
The annual and daily cycle of the wind recorded at Liberia meteorological station (Table 2) is presented in Figure 2. Liberia station, located at Daniel Oduber International Airport, is used to monitoring the synoptic scale conditions observed in Guanacaste by the CRNMI. The mean wind speed was 3.5 ms-1 (Fig. 2a). Wind magnitude is very strong during January-March between 12:00-17:00 local time (-6 GMT), having its maxima in February with a secondary maximum in July (Fig. 2a). This is in concordance with the CLLJ maxima described by Amador (2008). Wind magnitude was weaker between May and November at night and early morning hours, i.e. 23:00-07:00, with a minimum during October. Daily and annual cycle (Fig. 2a) agree with the ones reported for Bahía Culebra by Alfaro et al. (2012). Winds were westward all around the year (Fig. 2b), been Northeasterly from December to April and July. South easterlies were observed in May-June and August-November. Mean values for zonal (u) and meridional (v) wind components were -2.0 and -0.36 ms-1, respectively.
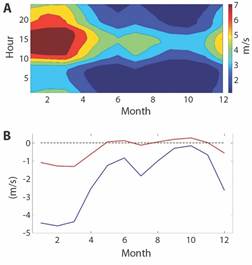
Fig. 2 a) Annual (x axis) and daily (y axis) cycle of the wind magnitude for the Liberia meteorological station record (Table 2, from hourly wind records). b) Annual cycle of the zonal (u, blue line) and meridional (v, red line) wind component.
The annual cycle of the SSbT records listed in Table 1 is presented in Fig. 3. Mean temperature is 25.2 °C. Colder temperatures were observed in February-March, below 21 °C with a secondary minimum in July. There were two maxima in May-June and August-October with temperatures above 27 °C (above 28 °C in September). March was the month that presented highest temperature variability and the lowest was observed in September. The annual cycle presented in Figure 3, agrees with the annual cycle reported by Alfaro et al. (2012) for the mean air surface temperature in Bahía Culebra.
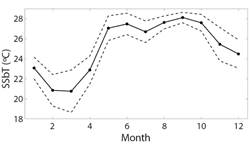
Fig. 3 Dotted line is the monthly average of mean Sea Subsurface Temperature records listed in Table 1 observed in Bahía Salinas (2003-2017), Costa Rica. Upper and lower dashed lines are ± one monthly standard deviation.
Fig. 4 shows the SSbTI calculated from records listed in Table 1 (see previous section). First data is for June 23rd, 2003 at 03:00 and the last data is for December 12th, 2017 at 23:00. SSbTI ranged from -3.61 to 2.13 standard deviations for May 9th, 2004 at 03:00 and February 25th, 2004 at 23:00, respectively. Time series in Figure 4 presented a small negative long-term trend with a statistical significance of 99 % (-1.9 x 10⁻⁷ hour-1, p-value < 0.01), positive and negative values represent warmer and cooler conditions than the historical monthly average. Correlation between monthly SSbTI and Niño 3 index (https://psl.noaa.gov/data/climateindices/list/) was 0.36 (p-value < 0.01).
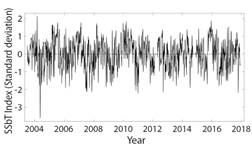
Fig. 5 shows the ZCI and MCI calculated from wind records listed in Table 2. First data is for January 4th, 2003 at 13:00 and the last data is for December 28th, 2017 at 12:00. ZCI ranged from -1.79 to 2.15 ms-1 for May 10th, 2010 at 13:00 and March 18th, 2003 at 21:00, respectively (Fig. 5a). MCI ranged from -1.97 to 2.14 ms-1 for November 25th, 2008 at 02:00 and September 27th, 2010 at 05:00, respectively (Fig. 5b). ZCI (MCI) time series in Figure 5 presented a positive (negative) long term trend of 1.06 x 10⁻⁷ (-1.36 x 10⁻⁶) ms-1 hour-1 with a statistical significance of 99 % (p-value < 0.01). There are positive monthly correlations between ZCI and MCI with SSbTI of 0.31 and 0.33, respectively, with a statistical significance of 99 % (p-value < 0.01). Monthly correlation between ZCI and MCI was 0.15 (p-value < 0.05).
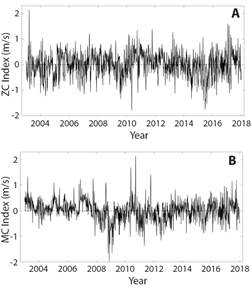
Fig. 5 Zonal-u (a) and Meridional-v (b) wind Component Index. Calculated from records listed in Table 2.
Cold Events
Event 1: April - May 2004
The event started the 25/04/2004 at 18:00 and ended the 24/05/2004 at 19:00. The minimum was founded the 09/05/2004 at 03:00 and reached a value of -3.614 standard deviations (Fig. 6). Easterly wind condition was observed during almost all the event, starting in April 26th at 23:00 and finishing by May 18th at 12:00. Meridional wind presented Southward conditions from April 28th at 01:00 to May 16th at 04:00.
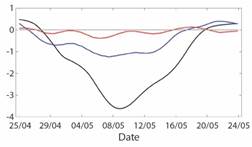
Fig. 6 Subsurface Sea Temperature Index (black line, standard deviation) recorded in Bahía Salinas, from April 25th to May 24th, 2004. Blue and red lines are for Zonal and Meridional Wind Component Indices (m/s).
According to Alvarado (2004), the month of May 2004 marked the beginning of the rains in the Pacific Slope and in the Central Valley. Intertropical Confluence Zone atmospheric instability increases in Costa Rica and its surroundings, giving a large formation of cloudiness and as a result the respective increase in rainfall. Guanacaste recorded more than 300 mm this month. This event coincided with an ENSO “neutral year”, this is a condition in which La Niña or El Niño ENSO phase did not predominate. March-May 2004 cooler conditions in Bahía Culebra were identified by Alfaro and Cortés (2012) and Alfaro et al. (2012), associated with trade winds intensity ranged from moderate to strong and several cold front outbreaks intrusions into the Caribbean.
Event 2: December 2010
SSbTI started to decrease the 19/12/2010 at 24:00 and ended rising the 02/01/2011 at 17:00. The minimum was founded the 29/12/2010 at 04:00 and reached a value of -2.212 standard deviations (Fig. 7). Southwesterly wind condition prevailed during this event.
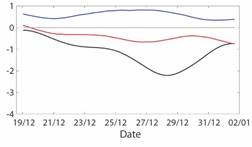
Fig. 7 Subsurface Sea Temperature Index (black line, standard deviation) recorded in Bahía Salinas, from December 19th, 2010 to January 2nd, 2011. Blue and red lines are for Zonal and Meridional Wind Component Indices (m/s).
Quirós and Stolz (2010) reported that there was a significant decrease in the air surface temperature over Central America in December 2010. During this month, 6 cold front outbreaks reached Central America. All of them increased the atmospheric pressure in the region and, therefore, the intensity of the winds over the isthmus. Additionally, La Niña conditions were still strong in the equatorial eastern Pacific. In November, SSTs in the Pacific of Costa Rica were around 27.0 °C, but decreased in December to 26.2 °C, that is, there was a cooling of 8 tenths of a degree. However, that cooling is comparing with the SST climatology, the cooling was 1.2 °C, greater than the one registered during 1999 La Niña event. During November 2010-January 2011, continuous negative SSbTI values were observed in Bahía Salinas (Fig. 3).
Event 3: September 2012
The event started the 08/09/2012 at 16:00 and ended the 21/09/2012 at 13:00. The minimum was founded the 15/09/2012 at 01:00 and reached a value of -2.157 standard deviations (Fig. 8). Northeasterly wind condition was observed during almost the whole event from September 8th at 23:00 until the 19th at 01:00.
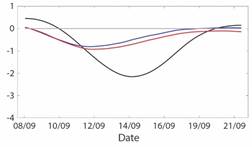
Fig. 8 Subsurface Sea Temperature Index (black line, standard deviation) recorded in Bahía Salinas, from September 8th to 21st, 2012. Blue and red lines are for Zonal and Meridional Wind Component Indices (m/s).
Morera (2012) observed that positive wind anomalies were recorded in September 2012 over a large part of Central America reaching 6 ms-1 (21.6 kmh-1). The wind direction was almost zonal. Easterly winds were favored by a relatively strong CLLJ. Additionally, meridional wind component showed negative values, indicating the prevalence of northern wind. Madden Julian Oscillation (MJO) contributed also to the rain irregularity observed over the country. Costa Rican North Pacific region showed a negative precipitation anomaly that reached 41.2 % less than monthly climatology (e.g., -134.8 mm at Liberia station), in agreement with stronger trade winds. In Guanacaste, the rain presented an irregular temporal distribution, since about 80 % of the total for the month was accumulated in five days and there were more than 15 dry days. The 2012 El Niño event reached a maximum in July, and since August began to weaken, but warmer SST anomalies, compared with TNA, were still present in September, this condition favored also stronger than climatology trade winds.
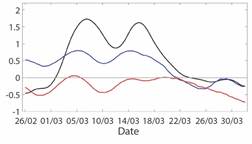
Event 4: July 2014
The SSbTI started the cooling the 04/07/2014 at 03:00 and ended the warming the 28/07/2014 at 22:00. The minimum was founded the 17/10/2017 at 17:00 and reached a value of -1.903 standard deviations (Fig. 9). Northeasterly wind condition was observed during the whole event.
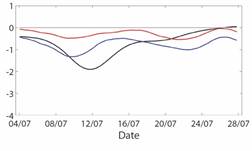
Fig. 9 Subsurface Sea Temperature Index (black line, standard deviation) recorded in Bahía Salinas, from July 4th to 28th, 2014. Blue and red lines are for Zonal and Meridional Wind Component Indices (m/s).
According to Chinchilla (2014), during July 2014, the ENSO SST indices, Niño 3 and Niño 1+2, remained above 0.5 °C and the Southern Oscillation Index (SOI) was negative, so the associated atmospheric and ocean indicators of El Niño were coupled. A significant cooling in the TNA was also present. The consequence of this SST configuration was a strong wind pattern throughout the month, since important trade wind anomalies were observed, particularly in the period from July 9th to 11th. Additionally, strong winds towards the Pacific slope, inhibiting cloud formation, preventing also the moisture entrance from the Pacific associated with the southwest breeze and a meteorological drought was observed in Guanacaste. Central America presented scare cloud coverage, which allowed drier conditions. The month of July 2014 was extremely dry in Guanacaste. The July rain accumulated average was 155 mm, that is, it rained only 2 % of the normal, been the lowest value since 1936.
Event 5: October 2017
The event started the 02/10/2017 at 12:00 and ended the 03/11/2017 at 05:00. The minimum was founded the 17/10/2017 at 17:00 and reached a value of -2.181 standard deviations (Fig. 10). Northeasterlies were observed from October 11th at 22:00 to 23rd at 10:00, but westward zonal wind component continued until the 27th at 12:00.
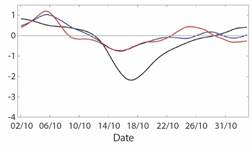
Fig. 10 Subsurface Sea Temperature Index (black line, standard deviation) recorded in Bahía Salinas, from October 2nd to November 3rd, 2017. Blue and red lines are for Zonal and Meridional Wind Component Indices (m/s).
Naranjo (2017) reported that SST indices, Niño 1+2 and Niño 3.4 showed a cooling during September 2017 and both exceeded the threshold of -0.5 °C, indicating La Niña like conditions, that continued through October. The MJO went through its convergent phase during the second and third week of October, causing a subsidence pattern in the country and indirectly, increasing the intensity of the winds. This month is the rainiest month of the year in the regions of the Pacific slope; however, the distribution of rain was irregular.
Warm events
Event 1: February 2004
The SSbTI started to increase the 19/02/2004 at 23:00 and ended the descend the 03/03/2004 at 13:00. The maximum was founded the 25/02/2004 at 23:00 and reached a value of 2.131 standard deviations (Fig. 11). Southwesterly conditions were observed from February 20th at 06:00 to 29th at 03:00, but Northward meridional wind conditions were recorded during the whole event.
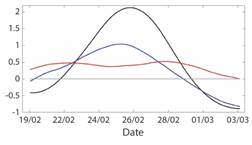
Fig. 11 Subsurface Sea Temperature Index (black line, standard deviation) recorded in Bahía Salinas, from February 19th to March 3rd, 2004. Blue and red lines are for Zonal and Meridional Wind Component Indices (m/s).
According to Alfaro (2004), February 2004 was a month characterized by trade winds of weak to moderate strength. However, winds in the upper troposphere, presented a negative anomaly over the southern part of Central America, which means that westerly winds were weaker than climatology. Additionally, surface southeast winds were observed over the region.
Event 2: February 2007
The event started the 09/02/2007 at 17:00 and ended the 22/02/2007 at 06:00. The maximum was founded the 15/02/2007 at 06:00 and reached a value of 1.766 standard deviations (Fig. 12). Southwesterly conditions were observed since February 14th to the end of the event, but Northward meridional wind conditions were recorded during the whole event.
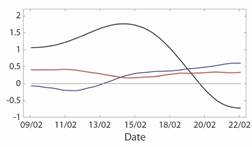
Fig. 12 Subsurface Sea Temperature Index (black line, standard deviation) recorded in Bahía Salinas, from February 9th to 22nd, 2007. Blue and red lines are for Zonal and Meridional Wind Component Indices (m/s).
According to Sánchez and Stolz (2007), February 2007 was an anomalous month, since, as a result of the El Niño conditions, above normal air surface temperatures patterns were observed in most of the country, ranged from 0.4 ºC to 0.8 ºC above average. Additionally, the observed atmospheric circulation was the main factor that blocked the entry of cold fronts to the country in this period. Warmer conditions in Bahía Culebra were observed also by Alfaro et al. (2012) during this month.
Event 3: March 2008
The event started the 26/02/2008 at 16:00 and ended the 02/04/2008 at 03:00. There are two temperature peaks with a difference of one week between them. The first maximum was founded the 07/03/2008 at 14:00 and reached a value of 1.724 standard deviations. The second maximum was founded the 16/03/2008 at 12:00 and reached a value of 1.618 standard deviations (Fig. 13). Southwesterly wind conditions dominated during this two-peak event.
Sánchez (2008) reported that during March 2008, La Niña conditions continued to weaken, especially in the ETP, where sea surface temperature anomalies in March reached positive values, approximately 1 ºC above normal. All the oceanic indices showed a significant warming in that region. This is in agreement with Alfaro and Lizano (2001) who found a lead time of 0-2 months between Niño 3.4 index and the SSTs in the North Pacific region of Costa Rica.
Event 4: March 2010
Starting the 07/03/2010 at 24:00 and ending the 25/03/2010 at 06:00. The maximum was founded the 13/03/2010 at 01:00 and reached a value of 1.831 standard deviations (Fig. 14). Southwesterly wind conditions were observed from March 7th at 16:00 to 15th at 10:00.
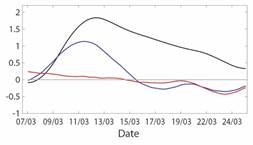
Fig. 14 Subsurface Sea Temperature Index (black line, standard deviation) recorded in Bahía Salinas, from March 7th to 25th, 2010. Blue and red lines are for Zonal and Meridional Wind Component Indices (m/s).
According to Chinchilla (2010), during March 2010, air temperature in Central America remained above average. Warmer conditions were perceived in Guanacaste in both, minimum and maximum temperatures. Air surface temperatures rose between 1 °C and 2 °C, particularly in regions of the Pacific slope. A wide warming widespread over the region was associated with an El Niño strong event condition in conjunction with a warming in the TNA region. Warm waters in the Pacific nearby coast of Costa Rica, reached anomalies of 2.0 °C.
Event 5: December 2015
The SSbTI showed that positive temperature anomalies were observed for a period of approximately four months, i.e. from 09/09/2015 at 20:00 to 25/01/2016 at 12:00 (Fig. 15a), however the main event started the 11/12/2015 at 02:00 and ended the 22/12/2015 at 10:00 (Fig. 15b). The maximum was founded the 17/12/2015 at 12:00 and reached a value of 1.875 standard deviations. Southwesterly wind conditions were observed from December 11th at 02:00 to 18th at 10:00.
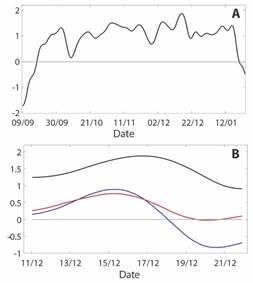
Fig. 15 a) Subsurface Sea Temperature Index (black line, standard deviation) recorded in Bahía Salinas, from September 9th, 2015 to January 25th, 2016. b) Subsurface Sea Temperature Index (black line, standard deviation) recorded in Bahía Salinas, from December 11th to 17th, 2015. Blue and red lines are for Zonal and Meridional Wind Component Indices (m/s).
According to Poleo (2015), during December 2015, El Niño very strong condition (most intense event in the past 30 years, with anomalies 3 °C above the climate average) caused a warm pattern throughout the country, registering positive air surface temperature anomalies between 0.2 and 1.5 ºC in both, minimum and maximum temperatures. Extreme air surface temperatures presented positive anomalies from 0.5 to 2 °C above the average throughout the country. In addition, the SST in the TNA presented positive anomalies, favoring a scenario of subsidence in the region in favor also of the observed warming. The little cloudiness values over the country favored a higher emission related with long-wave radiation, so the outgoing long wave radiation anomaly indicated positive values over Costa Rica, a reflection of the absence of cloudiness for most of the month. The Pacific slope had drier conditions when compared with climatology, with rainfall deficits at the coastal region and an associated SST anomaly of 2.5 °C in the Pacific Ocean near Costa Rica.
Discussion
Bahía Salinas has a marked east-west axis (Fig. 1). Sea temperature in this bay, has a defined seasonal cycle (Fig. 3), in which cooler temperatures are normally observed from the end of the boreal winter to the beginning of the spring (December-April), and the warmer months are normally expected from late spring to autumn (May-November).
The main seasonal climate driver in Central America is the North Atlantic Subtropical High (NASH), since its latitudinal migration is associated with the strength of the trade winds over Central America (Alfaro et al. 2018; Taylor & Alfaro, 2005). Trade winds are observed trough the isthmus with a marked easterly component all around the year (Fig. 2b). Stronger wind magnitudes are observed from December to April, decreasing in magnitude from May to November (Fig. 2), in concordance with the Southernmost and Northernmost positions of the NASH, respectively (Alfaro et al., 2018; Amador et al., 2016; Durán-Quesada et al., 2020; Maldonado et al., 2018). Wind and sea temperature seasonal cycle are related because strong easterly winds in Bahía Salinas, drive the surface water off the bay, and the displaced water is then replaced by cooler water from the depths, presenting a coastal upwelling during the winter (Cortés et al., 2014). The seasonal upwelling in Bahía Salinas is enhanced because the zonal wind with easterly component, is channeled through a topographic depression located between the lowlands of southern Nicaragua and northern Costa Rica. The winds produced by this channeling are commonly called “Papagayos”, and have Jet Stream strength (Alfaro & Cortés, 2012; Amador et al., 2016). In four of the five cold events studied in this work, Northeasterly wind anomalies were observed in the Costa Rican North Pacific, associated with trade wind reinforcements (Fig. 6, Fig. 8, Fig. 9, Fig. 10); meanwhile westerly anomalies were observed in all the warm events identified, associated with weaker trade wind conditions (Fig. 11, Fig. 12, Fig. 13, Fig. 14, Fig. 15). Notice also that positive monthly correlation between SSbTI and both wind indices, ZCI and MCI, suggested also that NE and SW wind anomalies tend to be related with cool and warm conditions in Bahia Culebra.
In addition, seasonal upwelling in Bahía Salinas is modulated also by two synoptic scale climate features. First, the boreal winter arrival of cold front outbreaks that enhance the zonal easterly wind component (Chinchilla et al., 2017; Maldonado et al., 2018; Zárate-Hernández, 2013), condition observed for example during December 2010 (Fig. 7). Second, the winter maximum of the easterly CLLJ (Amador, 2008), observed normally in February. The CLLJ has a maximum also in July, responsible of the secondary seasonal sea temperature minimum observed in Bahía Salinas.
ENSO is also an important modulator of the sea temperature variability in Bahía Salinas, since warm (El Niño) and cool (La Niña) ENSO events are related with positive and negative SST anomalies in the ETP, respectively. For example, warm events in February 2007, March 2010 and December 2015, were observed under El Niño conditions and the cold events of December 2010 and October 2017 under La Niña conditions. However, if warm SST anomalies are observed in the ETP in concordance with relatively cool anomalies in the TNA-Caribbean basin, a pressure gradient could be stablished trough the isthmus, enhancing the easterlies over Central America and decreasing the sea temperatures in Bahía Salinas. This was observed for example during the cold events of September 2012 and July 2014. Positive monthly correlation between SSbTI and Niño 3 index suggested that cool and warm ENSO events tend to be related with also cool and warm conditions in Bahia Culebra.
Advances in understanding the sea temperature variability in locations like Bahía Salinas are important, due to the historical presence of fishermen settlements and the observed positive and negative sea temperature anomalies related with commercial fish captures in the Costa Rican North Pacific (Moreno-Díaz & Alfaro, 2018; Moreno, Moya & Alfaro, 2017). Moreno et al. (2017) showed that when SST increases, the amount of fishing decreases in the region and Moreno and Alfaro (2018) found that fishermen’s income was 53 % higher in cold events than the one obtained in warm episodes of ENSO. Fishing activity has been one of the most important socioeconomic sector in Bahía Salinas through its history (Díaz, Mora, & Madriz, 2019) and the bay belongs to the Central American Dry Corridor (CADC), a sub-region that is a mainly rural area characterized by a marked precipitation seasonality, climate change vulnerability, rich biodiversity, entrenched poverty, food insecurity and outmigration (Gotlieb et al., 2019; Quesada-Hernández et al., 2019).
Ethical statement: authors declare that they all agree with this publication and made significant contributions; that there is no conflict of interest of any kind; and that we followed all pertinent ethical and legal procedures and requirements. All financial sources are fully and clearly stated in the acknowledgements section. A signed document has been filed in the journal archives.

