


 English (pdf)
 Article in xml format
 Article references
 Send this article by e-mail
 Cited by SciELO
  Similars in
SciELO
Similars in
SciELO  uBio
uBio 
 Permalink
Introduction
Arthropods are the most diverse group of animals in nature. Their evolutionary history has allowed them to adapt to all the climates and ecosystems on the planet where they perform different functions by virtue of the multiplicity of their habits. Although they have been studied in almost all their aspects, their ecology, the preference of their habitats and their adaptations to environmental demands are the source of recent studies (Chown & Nicolson, 2004; Dillon & Lozier, 2019). Factors such as temperature, the amount of light, exposure to rain and wind, as well as the quantity and quality of available resources, influence their distribution in the different stratum of tropical forests (Basset et al., 2003). The influence of climate on insects for example, triggers a series of morpho-physiological transformations that include strategies of evasion, adaptation, or resistance with great ecological and evolutionary implications (Colinet et al., 2015; Danks, 2007). Characteristics such as size and color patterns in insects can influence inter- and intraspecific competition, thermoregulation, activity levels, and resource use (Gentile et al., 2021; Peters, 1983), since ectothermic organisms depend on external sources of heat for the internal regulation of their body temperature (Chown & Nicolson, 2004; Forsman et al., 2008).
The Colombian Guyana is part of the Western biogeographic province of the Guiana Shield that is subdivided into five districts and 12 endemic areas (Hernández et al., 1992). Its geoforms are made up of rocky outcrops with very shallow soils with little vegetation cover, steep slopes, and the evident influence of physical weathering, made up of a series of mountain ranges, mountains, hills, and savannas, among which those of Chiribiquete, La Macarena, El Tuparro, Araracuara, Taraira, Naquén, Lajas de Guainía and La Lindosa stand out, which were linked in the Tertiary to the Guiana and Brazilian shields (Gentry, 1982; Giraldo-Cañas, 2001) so they share much of their floristic and fauna, in addition to a many endemisms (Camero, 2019; Giraldo-Cañas, 2001).
The Sierra de La Lindosa is a low mountain range located in the transitional zone between the large regions of Orinoquia and the Colombian Amazon and greatly affects regional climatic characteristics. The soils are derived from sedimentary rocks of Cretaceous age that contain a high content of iron that gives them a reddish color. They are loamy to sandy soils, little-evolved and well-drained, with an acidic pH, not very fertile, and with low nutrient content (Botero et al., 2018). The climatic and soil characteristics favor the development of low forests, open bushes and savannas with varied herbaceous elements, such as shrubs and stunted trees that tend to be perennial, leathery, and with a marked xeromorphic appearance (Hernández & Sánchez, 1992). The typical vegetation of the low forests is composed of communities of a few individual trees with irregular canopies and very little cover, with heights of up to 8 m. The bushes are located on the rocky outcrops and are composed of few species in general belonging to the families: Annonaceae, Asteraceae, Bonnetiaceae, Clusiaceae, Melastomataceae, Myrtaceae, Rubiaceae, and Tepuianthaceae and herbaceous species of the genera: Aechmea, Anemia, Axonopus, Diacidia, Navia, Selaginella, Schizachyrium and Vellozia. The savannas are made up of different types of communities, among which: Aeschynomene, Andropogon, Axonopus, Bulbostylis, Calea, Clitoria, Desmodium, Drosera, Hyptis, Nautilocalyx, Otachyrium, Panicum, Paspalum, Sipanea, Sipaneopsis, Siphantera, Trachypogon, Utricularia and Xyris species stand out (Giraldo-Cañas, 2001).
Despite the great interest aroused by the particularities of the ecosystems that are formed under the climatic conditions of the Guiana Shield, most of the research that has been accomplished in this region covers vegetational aspects and analyze the composition of insect and invertebrate faunas and other animal groups. But there is little research that seeks to establish adaptations of biota to this type of environment that has great climatic demands. The present research seeks to establish the differences in the conformation of the arthropod fauna found under the most representative plant communities in the Northern parts of the Sierra de La Lindosa mountain range in Colombia, based on the variations in the ecological parameters and on some morphological attributes, under the hypothesis of the evident climatic incidence in the structure and adaptations of arthropod communities.
Materials and methods
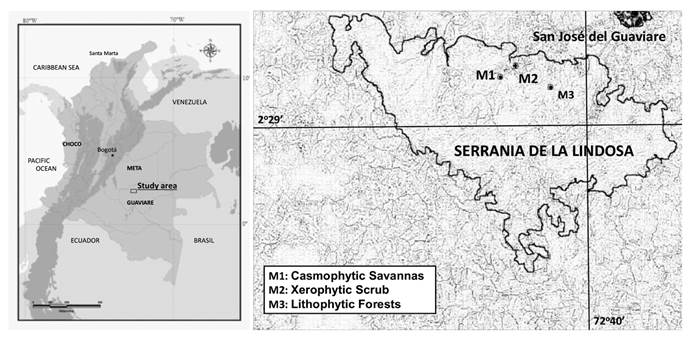
Study area: The Sierra de La Lindosa has an area of 12 000 hectares and is located within the Guaviare geographical region in Colombia; it is geologically influenced by the Guiana Shield and climatically influenced by the Orinoquia and Amazonian regions. The regional climate has a mean temperature of 25.7 °C with a variation of less than 2 °C and a mean annual range of precipitation of between 3 000 to 4 000 mm with a monomodal climatic regime, with the greatest precipitation between the months of May and June and the lowest rainfall between the months of January and February (IGAC, 1979). Under these conditions, different pedobiomes develop that range from lithophytic forests and xerophytic scrub to different types of savannas that are matrices of a great variety of ecological landscapes (Hernández & Sánchez, 1992). The mountain range is located near the municipality of San José del Guaviare where three sampling stations belonging to three different plant communities were located: casmophytic savannas (M1) located at 2°30’45” N & 72°42’52” W at 320 m.a.s.l.; xerophytic scrub (M2) located between 2°30’42” N & 72°42’41” W at 345 m.a.s.l. and lithophytic forests (M3) located between 2°30’12” N & 72°41’17” W at 315 m.a.s.l. (Fig. 1).
Sampling and data analysis: Arthropods captures were made in four vertical strata during years 2014 and 2015: 1) subsurface soil without vegetation from 0 to 20 cm deep, 2) herbaceous or litter layer, 3) shrub stratum, and 4) canopy above 10 m. For the subsurface stratum, five samples were analyzed by the extraction of 1 kg of soil per sample using Berlese funnels (Berlese, 1905; Tullgren, 1918). For the capture of organisms from the herbaceous stratum ten pitfall traps of 500 ml were located in a straight line and separated by distances of 10 m within random transects (Greenslade, 1964; Sabu et al., 2011). The samplings in the shrub stratum were carried out using two intensive methods: 1) 6 replications of 100 entomological net passes on the vegetation, and 2) the installation of flight interception traps with volatile bait at a height of 2 m (Peck & Davies, 1980). A variation of the latter trap was used above 10 m to capture arthropods in the canopy stratum for a minimum time of 48 hours. Physicochemical analyses were carried out for soil samples, including the texture, pH, conductivity, amount of organic matter (OM), percentage of roots, humidity, porosity, and field capacity (CC) and these were related to the fauna collected in the edaphic strata. For the other stratum the variables temperature and relative humidity were measured by means of a conventional multimeter.
Samples by stratum and ecosystem were labeled and transported in 70 % alcohol to the Ecology Laboratory of the National University of Colombia for the measurement of the morpho-ecological characteristics and for the taxonomic determination to family or supraspecific group by using the keys from Grimaldi and Engel (2005), Gullan and Craston (2010) and Johnson and Triplehorn (2005), and confirming the valid names in Species 2000 and in the ITIS Catalog (Roskov et al., 2019).
For the ecomorphological attributes, trophic guilds were assigned for each group after bibliographic consultations. The average body length of each of the collected groups was evaluated since head to apice abdomen, as well as the coloration according to the following numerical range: 1- for white-yellow-cream colors, 2- for black-brown, 3- for orange-red and 4- for blue-green. Biomass (Bc) was evaluated using a formula proposed by Stork and Blackburn (1993), that considers the number of individuals (N) and the average body length (L):
Bc = N (0.0305 L2.62)
The trophic levels of the fauna were included in eight categories according to Price (1984): phytophagous, polyphage, fungivores, dung, saprophagus, hematophage, predator and parasites/parasitoids, including within the phytophagous habits those groups of arthropods, especially insects, that feed on various plant organs and that contemplate defoliators, choppers, suckers, and miners.
For data analysis we evaluated the efficiency of the sampling by means of the Chao-1 estimator to find the richness completeness of groups by relating the observed species richness with the estimated richness and by the negative binomial method using the richness values of the groups in the different sample units. Additionally, we carried out an exploratory box-plot analysis to evaluate the similarities between ecosystems (Chao & Jost, 2012; Magurran, 1989). Abundance models from the richness values of the collected groups were determined, as well as Bray-Curtis similarity dendrograms from the abundance data through the single-linkage method, and the Brillouin diversity values (B) most recommended for this type of sampling (Magurran, 1989). The Simpson dominance (D) and fairness (1-D) and Wittaker beta diversity values (aW) between ecosystems and layers were calculated from abundance values of the groups by using the STATS (Bolar, 2019), MASS (Ripley et al., 2020) and CAR (Fox et al., 2020) packages in the R programming language v. 4.0.3 (R Development Core Team, 2017), validated using Kruskal-Wallis tests. A canonical correspondence analysis (CCA) was made to determine the relationship between the physicochemical factors and the collected groups. Finally, we established the total distribution of biomass in relation to the associations in each ecosystem and determined the affinity of the fauna to the sampling sites by means of a correspondence analysis (DCA) using the PAST software v. 2.15 (Hammer et al., 2001).
Results
Abundance and diversity: We collected 4 276 individuals in the study area including 18 orders and 112 families or supraspecific groups (Table 1). We collected 48 % of the individuals in the xerophytic scrub, 27 % in the casmophytic savanna, and the remaining 25 % in the lithophytic forest. Of the 112 groups collected, 83 were obtained in the savanna, 68 in the scrub and 63 in the forest. Although there are differences in the diversity values between the three sampling points (Kruskal-Wallis, H = 7.3, P = 0.05) and between ecosystem layers, diversity at the landscape level is low and with low replacement values (aW); however, these results may vary throughout the climatic seasons. The highest faunal diversity and group equitability was obtained in the casmophyte savanna (M1) (HB = 3.15; 1-D = 0.89) and the lowest diversity was from the scrub (M2) (HB = 2.48) that at the same time had the highest dominance values (D = 0.25) (Table 2).
Table 1 Trophic guilds, colorations and relative abundances for arthropod fauna from ecosystems studied in the La Lindosa mountains
| Family/Group | T. guild | Color | Cas_savanna | Xeroph_Scrub | Lith_Forest | Family/Group | T. guild | Color | Cas_savanna | Xeroph_Scrub | Lith_Forest | ||
| 1 | Acari | Pol | 2 | 0.0104 | 0.0049 | 0.0047 | 92 | Lonchopteridae | Phyt | 1 | 0.0060 | - | - |
| 2 | Acari | Pol | 1 | 0.0009 | 0.0019 | 0.0056 | 93 | Lygaeidae | Phyt | 2 | 0.0026 | - | - |
| 3 | Acrididae | Phyt | 2 | 0.0035 | 0.0005 | 0.0019 | 94 | Mantidae | Pred | 1 | 0.0009 | - | - |
| 4 | Aeolothripidae | Phyt | 2 | - | - | 0.0028 | 95 | Mantidae | Pred | 2 | 0.0009 | 0.0005 | - |
| 5 | Agromyzidae | Phyt | 2 | - | - | 0.0019 | 96 | Mantidae | Pred | 4 | 0.0017 | - | - |
| 6 | Agromyzidae | Phyt | 2 | - | 0.0039 | - | 97 | Membracidae | Phyt | 2 | 0.0009 | - | - |
| 7 | Anthophoridae | Sap | 2 | - | 0.0010 | - | 98 | Membracidae | Phyt | 1 | 0.0009 | - | - |
| 8 | Aphididae | Phyt | 1 | 0.0078 | - | 0.0009 | 99 | Membracidae | Phyt | 3 | 0.0294 | - | - |
| 9 | Apidae | Phyt | 2 | 0.0112 | - | - | 100 | Miridae | Phyt | 2 | 0.0112 | 0.0005 | - |
| 10 | Apidae | Phyt | 1 | 0.0095 | 0.0233 | - | 101 | Muscidae | Dung | 2 | 0.0017 | 0.0034 | 0.0094 |
| 11 | Aranae | Pred | 1 | 0.0233 | 0.0161 | 0.0198 | 102 | Mycetophilidae | Fung | 1 | 0.0026 | 0.0010 | - |
| 12 | Aranae | Pred | 2 | 0.0009 | 0.0019 | 0.0038 | 103 | Mycetophilidae | Fung | 2 | 0.0017 | 0.0024 | 0.0009 |
| 13 | Argidae | Phyt | 1 | - | - | 0.0019 | 104 | Mymaridae | Psd | 2 | - | - | 0.0009 |
| 14 | Asilidae | Pred | 2 | - | 0.0005 | - | 105 | Mymaridae | Psd | 1 | - | 0.0010 | - |
| 15 | Blattidae | Phyt | 1 | 0.0017 | - | 0.0028 | 106 | Nitidulidae | Phyt | 1 | - | 0.0078 | 0.2825 |
| 16 | Blattidae | Pol | 2 | - | 0.0005 | 0.0056 | 107 | Nitidulidae | Phyt | 2 | 0.0181 | - | 0 |
| 17 | Blattidae | Pol | 1 | - | 0.0005 | - | 108 | Oligotomidae | Phyt | 2 | 0.0009 | - | 0.0009 |
| 18 | Braconidae | Psd | 1 | - | 0.0024 | 0.0028 | 109 | Onychiuridae | Sap | 1 | 0.0009 | 0.0010 | 0.0019 |
| 19 | Buprestidae | Pol | 1 | 0.0017 | - | - | 110 | Otididae | Phyt | 2 | 0.0026 | - | 0.0019 |
| 20 | Carabidae | Pred | 2 | - | 0.0005 | - | 111 | Pentatomidae | Phyt | 1 | 0.0017 | - | - |
| 21 | Cecidomyiidae | Phyt | 2 | 0.0043 | - | 0.0019 | 112 | Pentatomidae | Phyt | 2 | 0.0035 | - | - |
| 22 | Cecidomyiidae | Phyt | 1 | 0.0052 | 0.0058 | 0.0358 | 113 | Pergidae | Hem | 2 | 0.0009 | - | - |
| 23 | Ceratopogonidae | Hem | 2 | 0.0535 | 0.0034 | 0.0235 | 114 | Phoridae | Sap | 1 | 0.0017 | 0.0058 | 0.0217 |
| 24 | Ceratopogonidae | Hem | 1 | 0.0086 | 0.0005 | 0.0019 | 115 | Phoridae | Sap | 2 | 0.0026 | 0.0165 | 0.0056 |
| 25 | Cercopidae | Phyt | 1 | 0.0173 | - | - | 116 | Piesmatidae | Phyt | 2 | - | 0.0005 | - |
| 26 | Chalcidoidea | Psd | 2 | 0.0121 | 0.0019 | 0.0104 | 117 | Pompilidae | Pred | 2 | - | 0.0005 | - |
| 27 | Chalcidoidea | Psd | 1 | 0.0086 | 0.0024 | - | 118 | Proscopiidae | Phyt | 1 | 0.0009 | - | - |
| 28 | Chironomidae | Phyt | 1 | 0.0026 | 0.0010 | 0.0019 | 119 | Proscopiidae | Phyt | 2 | - | - | 0.0009 |
| 29 | Chironomidae | Phyt | 2 | 0.0009 | 0.0005 | 0.0038 | 120 | Proscopiidae | Phyt | 2 | 0.0026 | - | - |
| 30 | Chrysomelidae | Phyt | 1 | 0.0026 | 0.0010 | 0.0009 | 121 | Pselaphidae | Pred | 1 | 0.0017 | 0.0005 | - |
| 31 | Chrysomelidae | Phyt | 2 | 0.0009 | 0.0010 | 0.0047 | 122 | Psocoptera | Pol | 1 | - | 0.0010 | - |
| 32 | Chrysomelidae | Phyt | 4 | - | 0.0010 | 0.0009 | 123 | Psychodidae | Pol | 1 | 0.0026 | - | 0.0009 |
| 33 | Chrysopidae | Phyt | 4 | 0.0009 | - | - | 124 | Psychodidae | Hem | 1 | 0.0017 | - | 0.0009 |
| 34 | Chrysopidae | Phyt | 1 | 0.0060 | - | - | 125 | Ptiliidae | Fung | 2 | 0.0017 | 0.0068 | - |
| 35 | Cicadellidae | Phyt | 1 | 0.0060 | - | 0.0009 | 126 | Ptiliidae | Fung | 1 | 0.0130 | - | - |
| 36 | Cicadellidae | Phyt | 2 | 0.0017 | 0.0015 | - | 127 | Reduviidae | Hem | 3 | 0.0035 | - | 0.0009 |
| 37 | Cicadellidae | Phyt | 3 | - | - | 0.0019 | 128 | Reduviidae | Hem | 1 | 0.0009 | - | 0.0009 |
| 38 | Crabronidae | Phyt | 1 | 0.0009 | - | - | 129 | Reduviidae | Hem | 4 | 0.0043 | - | - |
| 39 | Culicidae | Hem | 1 | 0.0181 | 0.0049 | 0.0395 | 130 | Reduviidae | Hem | 2 | - | 0.0005 | 0.0019 |
| 40 | Culicidae | Hem | 2 | 0.0035 | 0.0058 | 0.0028 | 131 | Rhagionidae | Pred | 2 | 0.0035 | 0.0005 | - |
| 41 | Culicidae | Hem | 1 | - | 0.0039 | - | 132 | Richardiidae | Phyt | 1 | - | 0.0005 | - |
| 42 | Curculionidae | Phyt | 2 | 0.0155 | 0.0019 | 0.0047 | 133 | Riodinidae | Phyt | 4 | 0.0250 | 0.0092 | 0.0160 |
| 43 | Curculionidae | Phyt | 1 | 0.0086 | - | 0.0141 | 134 | Scarabaeidae | Dung | 1 | - | - | 0.0009 |
| 44 | Cydnidae | Phyt | 2 | 0.0026 | 0.0224 | 0.0009 | 135 | Scarabaeidae | Dung | 4 | - | - | 0.0019 |
| 45 | Cydnidae | Phyt | 1 | - | - | 0.0009 | 136 | Scarabaeidae | Dung | 2 | 0.0017 | - | 0.0038 |
| 46 | Cynipidae | Phyt | 2 | - | - | 0.0009 | 137 | Scarabaeidae | Dung | 1 | - | 0.0010 | - |
| 47 | Delphacidae | Phyt | 1 | 0.0276 | - | - | 138 | Scarabaeidae | Dung | 2 | - | 0.0019 | - |
| 48 | Dictyopharidae | Phyt | 1 | 0.0009 | - | 0.0009 | 139 | Sciaridae | Fung | 1 | 0.0112 | 0.0015 | 0.0019 |
| 49 | Dipsocoridae | Pred | 1 | 0.0017 | - | - | 140 | Sciaridae | Fung | 2 | 0.0095 | 0.0034 | 0.0047 |
| 50 | Dipsocoridae | Pred | 2 | - | - | 0.0009 | 141 | Sciomyzidae | Phyt | 1 | - | - | 0.0009 |
| 51 | Dixidae | Phyt | 1 | 0.0302 | - | - | 142 | Scolytidae | Xyl | 2 | 0.0052 | 0.0005 | 0.0009 |
| 52 | Dolichopodidae | Pred | 2 | 0.0009 | 0.0068 | 0.0028 | 143 | Scolytidae | Xyl | 2 | - | 0.0131 | - |
| 53 | Dolichopodidae | Pred | 4 | 0.0009 | - | 0.0019 | 144 | Scolytidae | Xyl | 1 | - | 0.0044 | - |
| 54 | Drosophilidae | Phyt | 2 | 0.0009 | 0.0112 | 0.0104 | 145 | Scorpiones | Pred | 2 | 0.0009 | - | - |
| 55 | Drosophilidae | Phyt | 1 | 0.0017 | 0.0024 | 0.0019 | 146 | Scydmaenidae | Pred | 1 | 0.0009 | 0.0015 | - |
| 56 | Drosophilidae | Phyt | 3 | - | - | 0.0056 | 147 | Simuliidae | Phyt | 1 | - | 0.0015 | 0.0009 |
| 57 | Elateridae | Phyt | 1 | - | 0.0010 | 0.0009 | 148 | Simuliidae | Phyt | 2 | - | 0.0005 | - |
| 58 | Elateridae | Phyt | 2 | - | - | 0.0009 | 149 | Sminthuridae | Sap | 3 | 0.0017 | 0.0010 | - |
| 59 | Embiidina | Phyt | 1 | - | - | 0.0009 | 150 | Sminthuridae | Sap | 2 | - | 0.0088 | 0.0085 |
| 60 | Empididae | Phyt | 2 | - | - | 0.0047 | 151 | Sminthuridae | Sap | 1 | 0.0026 | 0.0088 | 0.0734 |
| 61 | Entomobryidae | Sap | 1 | 0.0121 | 0.0063 | 0.0330 | 152 | Sminthuridae | Sap | 4 | - | 0.0029 | - |
| 62 | Entomobryidae | Sap | 2 | - | 0.0010 | - | 153 | Sphaeroceridae | Sap | 2 | 0.0043 | - | 0.0019 |
| 63 | Ephydridae | Phyt | 1 | - | - | 0.0009 | 154 | Sphaeroceridae | Sap | 1 | 0.0009 | - | - |
| 64 | Ephydridae | Phyt | 2 | 0.0069 | 0.0005 | 0.0028 | 155 | Sphaeroceridae | Sap | 2 | - | 0.0005 | - |
| 65 | Eulophidae | Psd | 2 | 0.0026 | - | - | 156 | Sphecidae | Sap | 2 | 0.0009 | - | - |
| 66 | Eurytomidae | Psd | 2 | - | 0.0005 | - | 157 | Staphylinidae | Pol | 2 | 0.0026 | 0.0083 | 0.1318 |
| 67 | Flatidae | Phyt | 2 | - | - | 0.0009 | 158 | Staphylinidae | Pol | 1 | 0.0190 | 0.0136 | 0.0198 |
| 68 | Forficulidae | Phyt | 2 | 0.0017 | - | - | 159 | Stratiomyidae | Sap | 2 | - | 0.0005 | - |
| 69 | Formicidae | Phyt | 1 | 0.0043 | 0.0438 | 0.0113 | 160 | Syrphidae | Phyt | 2 | 0.0104 | 0.0019 | - |
| 70 | Formicidae | Pol | 2 | 0.3066 | 0.6308 | 0.0678 | 161 | Tabanidae | Hem | 2 | - | 0.0005 | - |
| 71 | Formicidae | Phyt | 3 | - | - | 0.0019 | 162 | Tachinidae | Psd | 2 | 0.0242 | 0.0010 | 0.0009 |
| 72 | Fulgoroidea | Phyt | 1 | 0.0173 | 0.0019 | 0.0151 | 163 | Tenthredinidae | Phyt | 1 | 0.0009 | - | - |
| 73 | Fulgoroidea | Phyt | 2 | 0.0009 | 0.0005 | 0.0009 | 164 | Tephritidae | Dung | 2 | 0.0009 | - | 0.0038 |
| 74 | Fulgoroidea | Phyt | 3 | - | - | 0.0009 | 165 | Termitidae | Xyl | 1 | - | - | 0.0019 |
| 75 | Geometridae | Phyt | 2 | 0.0017 | - | - | 166 | Tetrigidae | Phyt | 1 | 0.0043 | - | - |
| 76 | Gryllacrididae | Pred | 1 | - | - | 0.0009 | 167 | Tettigoniidae | Phyt | 1 | 0.0009 | - | - |
| 77 | Gryllacrididae | Phyt | 4 | 0.0043 | - | - | 168 | Tettigoniidae | Phyt | 2 | - | 0.0010 | - |
| 78 | Gryllidae | Pol | 2 | 0.0535 | - | - | 169 | Therevidae | Hem | 2 | 0.0009 | - | - |
| 79 | Gryllidae | Pol | 1 | - | - | 0.0009 | 170 | Thripidae | Phyt | 1 | 0.0009 | 0.0044 | 0.0009 |
| 80 | Gryllotalpidae | Pred | 1 | 0.0017 | - | 0.0019 | 171 | Thripidae | Phyt | 2 | - | 0.0005 | - |
| 81 | Gryllotalpidae | Phyt | 4 | - | - | 0.0019 | 172 | Tingidae | Phyt | 2 | - | 0.0005 | - |
| 82 | Halictidae | Phyt | 4 | 0.0017 | - | - | 173 | Tipulidae | Phyt | 1 | - | 0.0019 | 0.0009 |
| 83 | Histeridae | Pred | 2 | - | 0.0005 | - | 174 | Tipulidae | Phyt | 2 | - | - | 0.0028 |
| 84 | Hydrophilidae | Phyt | 2 | - | 0.0117 | 0.0038 | 175 | Torymidae | Phyt | 2 | - | - | 0.0009 |
| 85 | Isopteridae | Sap | 1 | - | 0.0131 | - | 176 | Trichogrammatidae | Psd | 2 | 0.0009 | - | - |
| 86 | Isopteridae | Sap | 5 | - | 0.0015 | - | 177 | Trogidae | Pol | 2 | - | 0.0005 | - |
| 87 | Labiduridae | Sap | 2 | 0.0009 | 0.0015 | - | 178 | Ulidiidae | Phyt | 2 | - | - | 0.0019 |
| 88 | Labiidae | Sap | 1 | 0.0009 | - | - | 179 | Veliidae | Phyt | 2 | 0.0026 | - | - |
| 89 | Laemophloeidae | Phyt | 1 | - | - | 0.0009 | 180 | Vespidae | Pred | 1 | 0.0009 | - | - |
| 90 | Lauxaniidae | Phyt | 1 | 0.0009 | 0.0005 | - | 181 | Vespidae | Pred | 2 | - | - | 0.0009 |
| 91 | Lauxaniidae | Phyt | 2 | 0.0026 | 0.0019 | - | 182 | Vespidae | Pred | 1 | - | 0.0005 | - |
Exclusive groups are highlighted in bold. Trophic guilds: Phyt: phytophagous, Pol: polyphage, Fung: fungivores, Dung, Sap: saprophagus, Xyl: xylophagous, Hem: hematophagous, Pred: predator, Psd: parasites/parasitoids. Body colorations: 1: white-yellow-cream, 2: black-brown, 3: orange-red, 4: blue-green.
Table 2 Diversity estimators for the ecosystems studied in the La Lindosa mountains - Colombia
| Alpha diversity | |||
| Casm_Savanna (M1) | Xeroph_Scrub (M2) | Lith_Forest (M3) | |
| Taxa | 113 | 95 | 96 |
| Individuals (n) | 1158 | 2056 | 1062 |
| Dominance (D) | 0.12 | 0.25 | 0.12 |
| Simpson (1-D) | 0.89 | 0.74 | 0.88 |
| Brillouin (HB) | 3.15 | 2.48 | 2.85 |
| Chao-1 | 140 | 120.4 | 126.3 |
| Compl (%) | 80.7 | 78.9 | 76.0 |
| Beta diversity (aW) | |||
| Casm_Savanna | Xeroph_Scrub | Lith_Forest | |
| Casm_Savanna | 0 | 0.47115 | 0.45455 |
| Xeroph_Scrub | 0.47115 | 0 | 0.47644 |
| Lith_Forest | 0.45455 | 0.47644 | 0 |
The abundance and composition of the groups varied from one ecosystem to another and between each of the vertical stratum. At the ecosystem level (and in general for its stratum) there was an equitable distribution of abundance between the dominant groups and the few exclusive low-abundance groups that can be seen in the graphs of the abundance models and in their greater adjustment to the logarithmic models. The expected richness in the sampling sites was higher than that found according to the values in the Chao-1 index, from which the calculation of the percentage of completeness is derived and that was higher in the savanna ecosystem (80.7 %) and lower in the forest ecosystem (76.0 %); so, most of the richness of the arthropod fauna in the study area was collected through the sampling techniques used. Relative abundances of arthropod fauna for each ecosystem are observed in Table 1. In the case of exclusive groups, these represent between 15 and 30 % of the fauna collected in the three ecosystems, suggesting a very similar fauna composition in all of them (Fig. 2A, Fig. 2B), reflected in the mean values of beta diversity and in the low replacement values (Table 2). The exclusive groups for each ecosystem are highlighted in Table 1.
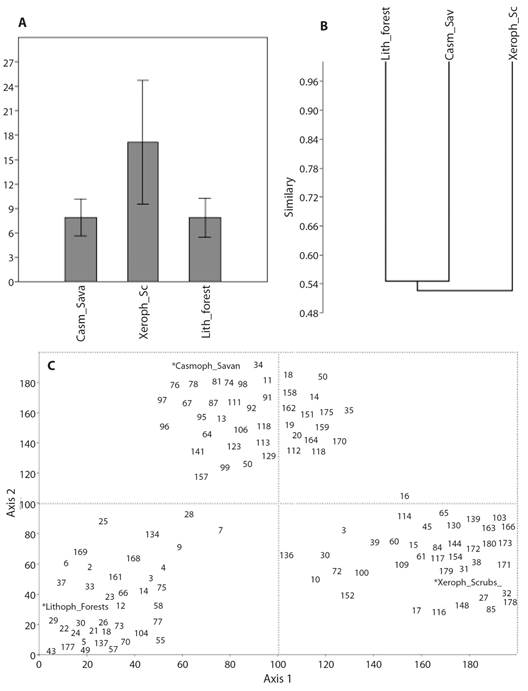
Fig. 2 A. Bar-chart analysis, B. similarity of Bray-Curtis, P = 0.91. and C. Correspondence (DCA), Eigenvalues: axis 1 = 0.63, axis 2 = 0.09, for the ecosystems studied in the La Lindosa mountains - Colombia. The number assigned to each group corresponds to Table 1.
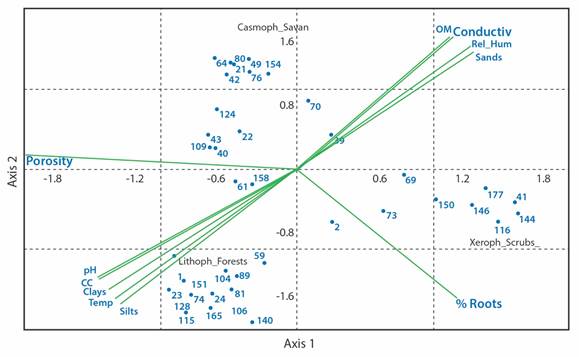
Fig. 3 Canonical correspondence analysis (CCA) for the physicochemical variables and the groups of the arthropod fauna of the subsurface layer of the soil in ecosystems of the La Lindosa mountains. Numbers to each group correspond to Table 1. Eigenvalues: Axis 1 = 0.68; Axis 2 = 0.56.
Nitidulidae, Phoridae, Sciaridae, Sminthuridae and Termitidae groups with field capacity, temperature, and fine textural fractions, and the Entomobryidae and Staphylinidae families with the pH.
Trophic guilds and biomass: The phytophagous guild, including the groups of defoliators, cutters, suckers and miners, was the most abundant in the three ecosystems and in all the strata, followed by the predatory, blood-sucking and saprophagous groups (Fig. 4A). The proportion of trophic guilds had a greater abundance of phytophagous, predator, and hematophagous groups in the strata of the casmophytic savanna and the lithophytic forest, and of the phytophagous, saprophagous and predatory groups in the xerophytic scrub.
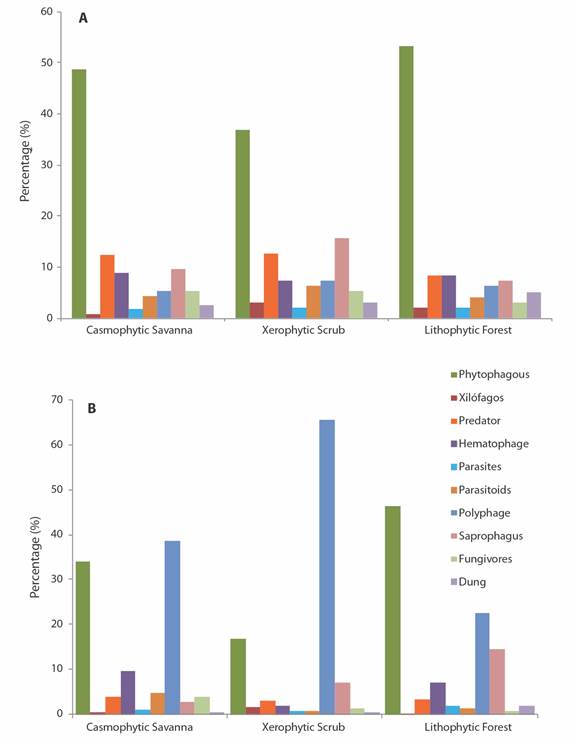
Fig. 4 A. Percentage of trophic guilds B. and proportion of biomass for functional groups of arthropods in ecosystems of the La Lindosa mountains - Colombia.
Although the phytophagous guilds were the most abundant in all ecosystems, the highest biomass especially in the savanna and scrub ecosystems comes from the polyphagous habit groups (Kruskal-Wallis, H = 11.76, P = 0.05). These groups reach about 40 % of the biomass in the savannas, more than 60 % in the bushes and scrub and more than 20 % of the biomass in the forests (Fig. 4B). The guild is comprised especially of the most abundant groups such as Formicidae, Gryllidae and Staphylinidae in the savanna and scrub ecosystems, and by the groups such as the Cecidomyiidae, Curculionidae, Drosophilidae, Formicidae, Fulgoridae and Riodinidae in the forest ecosystem. By stratum, the highest biomass values were found in the shrub stratum, while the lowest values were recorded in the edaphic stratum of all ecosystems.
Body size and coloration: About 60 % of the 112 groups collected had variations of mean body sizes due to the capture of more than one morphospecies, making the number of groups registered in table 1 increase to 182 and allowing, at the same time, a more detailed characterization of body size distribution along the vertical structures of the ecosystems. Thus, for example, the family Blattidae in the shrub stratum, had an average size of 5.2 mm in the casmophytic savannas and 6.0 mm for the xerophytic shrubs; and two forms of the family Apidae in the shrub stratum of the savannas had mean lengths of 4.0 mm and 0.7 mm. Significant differences were found between the body lengths of the three ecosystems (Kruskal-Wallis, H = 11.27, P = 0.05). The largest range of body sizes was found in the shrub stratum of the savanna ecosystems where lengths of up to 45 mm were recorded (Fig. 5A), while the majority of sizes in the scrub ecosystems were recorded below 10 mm (Fig. 5B). In the stratum of all ecosystems, a high percentage of individuals with body sizes between 2.0 mm and 4.9 mm was observed, this being the most frequent range of body lengths at the landscape level (Fig. 5A, Fig. 5B, Fig. 5C).
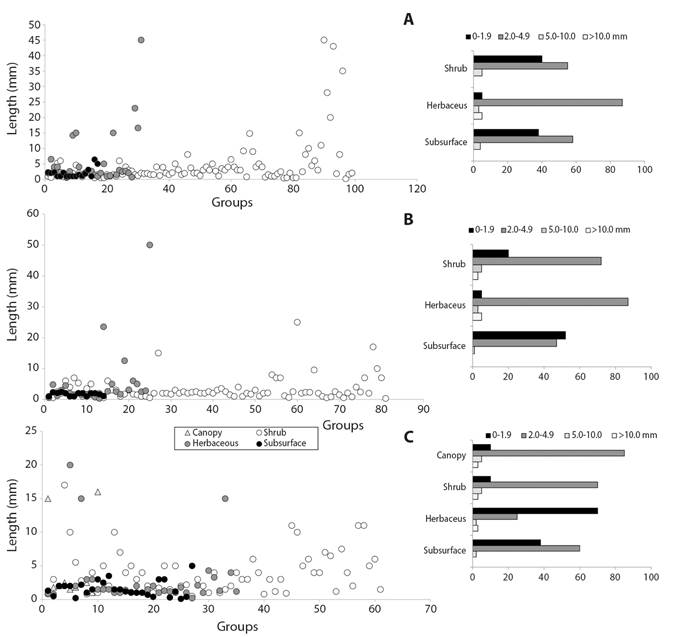
Fig. 5 Body sizes (left) and size frequency (right) of arthropod fauna in A. The stratum of savanna B. Scrub and C. Forest ecosystems in the La Lindosa mountains - Colombia.
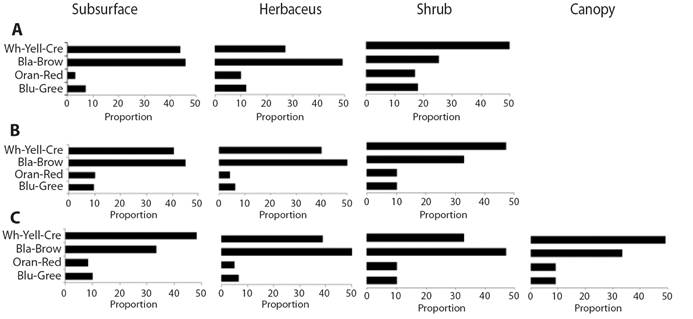
The light body colorations that comprise the white-yellow-cream tones and the dark black-brown colors are the most frequent in all the ecosystems. The showy colors in orange and red or blue and green tones are less frequent and constitute less than 10 % of the body colors of arthropod fauna at the landscape scale in all the ecosystems and stratum (Fig. 6A, Fig. 6B, Fig. 6C). In the case of the xerophytic scrubs, dark colors are more frequent, followed by light colors in the lower stratum.
Discussion
Abundance and Diversity: The results generally show a low diversity typical of this type of zones derived from Guiana Shield geological formations and extreme climatic conditions with mostly sandy soils and little retained humidity (Gentry, 1982; Hernández et al., 1992). The low group turnover values measured by the Wittaker index (aW), showed a low number of shared groups, so that each ecosystem showed a very particular faunal composition that was reflected in the low similarity values (Halffter & Escurra, 1992). According to Cornell and Lawton (1992), these low exchange values between the local fauna and the regional pool are due to a saturation of local diversity by competition and predation that for the study area is related to the large amount of phytophagous and predator groups.
The number of exclusive groups in each ecosystem was close to 30 %. These groups that encompass many species could potentially include a large number of endemic elements that are very frequent in these environments formed historically under critical climatic and particular geological conditions (Hernández et al., 1992), so they represent great potential value to be used in ecological conservation (Raphael & Molina, 2007). On the other hand, according to the abundance models, for all ecosystems there are abundant groups with few individuals or “singletons” (rare taxa with only one individual), so that diversity does not only depend on richness but also on the number of rare or unique groups found in the community, and the higher the degree of dominance of a few groups and the lower abundance of the majority, the lower the diversity (Novotny & Basset, 2000). These spatial models are common in natural communities subjected to critical environmental conditions (Raphael & Molina, 2007).
Many of the physiological mechanisms, especially of insects, are highly dependent on environmental conditions; humidity and temperature are the most important determinants for the development and activity of insects (Basset et al., 2003; Chown & Nicolson, 2004). When comparatively evaluating the richness, abundance and diversity of the arthropod fauna in the vertical structure of the different ecosystems of the region, differences were found especially between the shrub fauna compared to the lower stratum and the forest canopy. This could be interpreted as a refuge effect of the understory in the face of higher temperature conditions in the canopy and the herbaceous stratum. The temperature, the humidity of the air affected by the solar radiation, and the transpiration of the vegetation produce microclimatic gradients that induce the mobility of the arthropods, according to their physiological tolerance and their habitat preferences for their feeding, incubation, or the development of juveniles (Chown & Nicolson, 2004). Temperature is closely related to most metabolic processes and complex physiological triggers that affect population dynamics in aspects such as metamorphosis and longevity (Chown & Nicolson, 2004). For the edaphic stratum, some variables closely related to the presence or abundance of some groups were identified with similar results to other studies already carried out in Colombia, such as the case of the relationships found between loamy textured soils with the highest abundance of the Acari, Phoridae, Sciaridae and Sminthuridae groups and of the relationship of pH to the Entomobryidae and Staphylinidae families (Camero & Chammorro, 2021).
Trophic guilds and biomass: The phytophagous guild was the most abundant in all the ecosystems studied and in all the strata. This guild also included many groups of arthropod polyphagous habits that take advantage of plant resources in their adult or immature forms, as well as at some stage of development in their life cycle (Johnson & Triplehorn, 2005). The phytophagous habits include many groups of arthropods, especially insects that specialize or take advantage of all plant tissues in a generalized way and are made up of groups of folivorous, chopping, sucking, mining, and sipping habits (Chown & Nicolson, 2004; Price, 1984). Under conditions of great climatic demand, such as in the case of the Sierra de La Lindosa mountain range, it is more common to find a greater abundance of generalist groups than specialized ones. These obtain the maximum benefits of hydration from the consumption of leaf structures and conducting tissues (Novotny et al., 2002).
Herbivory is the most important process in the transformation and the energy flow of ecosystems, quantifiable in the biomass of herbivorous fauna that assimilates around 20 % of the most palatable plant organs, either from surface tissues of exposed organs or their internal fluids (Del Val, 2012; Price, 1984). In natural ecosystems, most herbivorous insects are included especially within the orders Hymenoptera, Lepidoptera, Coleoptera, Diptera, Hemiptera and Orthoptera, whose energy and accumulated biomass is used by predatory and parasitic groups (Del Val, 2012). Predatory and parasitic groups represented in the ecosystems studied in the Sierra de La Lindosa are the groups Acari, Araneae, Ceratopogonidae, Chalcididae, Culicidae, Dolichopodidae, Gryllotalpidae, Mantidae, Pselaphidae, Rhangionidae, Scydmaenidae, Tachinidae and Vespidae.
The highest values of the total biomass were found in the scrub ecosystem where the greatest abundance of groups was found, followed by the biomass values of the savannas that at the same time had the highest groups richness. Biomass, then, depends more on the number of individuals than on the richness or diversity. In the savanna ecosystem, the largest body sizes were found but with little abundance, while the intermediate sizes of the groups collected in the bushes had a greater number of individuals. On the other hand, the direct incidence of solar radiation on ecosystems with an absence of arboreal vegetation requires greater mechanisms of tolerance for fauna to high temperatures. These faunal adaptations to the conditions of greater environmental demand, should tend to reduce the loss of body water and climate tolerance by reducing the surface/volume ratio (Danks, 2007).
In the herbaceous and edaphic stratum, the transformation of biomass is carried out especially by the groups that make up the saprophagous, coprophagous, xylophagous, and fungivorous guilds that contribute to nutrient release following the detrital pathway (Coleman & Wall, 2015; Odum & Barret, 2006). In the ecosystems of the study area, the biomass of these detritivore guilds represents around 20 % of the total biomass of the arthropod fauna of the lower stratum, and they are made up of the groups Anthophoridae, Entomobryidae, Labiduridae, Labiidae, Isopteridae, Muscidae, Mycetophilidae, Onychiuridae, Phoridae, Ptiliidae, Scarabaeidae, Sciaridae, Scolytidae, Sminthuridae, Sphaeroceridae, Sphecidae, Stratiomyidae, Tephritidae and Termitidae. Most of these groups permanently perform their ecological functions in these strata, but many others only perform temporary functions in some of their stages of development (Coleman & Wall, 2015).
Body size and coloration: Body length is a variable generally closely related to environmental conditions (Stork & Blackburn, 1993). Most of the body sizes of the arthropod fauna collected in all the vertical stratum of the study area are between 2.0 mm and 4.9 mm, followed by a higher frequency of smaller sizes. Although in all the ecosystems studied the greatest size variety was found in the shrub stratum, large body lengths are very rare, agreeing with Peters (1983) that they are a low proportion in natural ecosystems. Most of the sizes smaller than 2.0 mm correspond to groups that are within the scale of white-yellow-cream colors, while the sizes above 10 mm that could be considered as large, are mostly located within the black-brown color scale.
Large sizes, more frequent in the shrub stratum, have greater lengths ranging in savanna ecosystems (Fig. 5A), with sizes between 9.0 mm and 45.0 mm, corresponding to the groups Pentatomidae, Chrysopidae, Gryllidae, Reduviidae, Vespidae, Tettigoniidae, Proscopiidae and Mantidae; most of these groups are colored white-yellow-cream. In the xerophytic scrub (Fig. 5B), the longest ranges of lengths in the shrub stratum are between 9.5 mm and 17.0 mm in the Apidae, Mantidae, Asilidae and Riodinidae groups with black-brown colors; and in the shrub stratum of lithophytic forests (Fig. 5C), the longest ranges are between 10.0 mm and 25.0 mm in the Cynipidae, Scarabaeidae, Cydnidae, Blattidae, Vespidae and Riodinidae groups with a higher frequency of dark colors. The light colors that are very frequent in the upper strata allow a greater reflection of the incident of solar radiation on the arthropods´ surface and is of great value as an evasive mechanism to high temperatures caused by direct radiation. The dark tones, more common in the lower strata of bushes and forests decrease the activities of organisms and slow down resource consumption in high direct radiation environments (Danks, 2007; Forsman et al., 2008).
Regional characterization of the arthropod fauna: The ecosystems studied were characterized by low diversity values of arthropod communities, low exchange values, a high percentage of groups not shared between ecosystems and are made up of a particular faunal richness that responds to local microclimatic factors. The greater abundances were found in the intermediate strata where trophic structures are represented with a greater proportion of groups of phytophagous habits, body sizes between 2.0 and 5.0 mm and a predominance of dark colors. The general trends in length measurements in the three ecosystems are the largest means of sizes in the herbaceous stratum and the presence of smaller sizes in the subsurface soil stratum. The low frequency of large body sizes could be explained as a general adaptation of the fauna to climatic demands that under high temperature conditions favor small sizes (García-Barros, 2000).
There is a higher incidence of polyphagous and phytophagous groups in the total biomass of the ecosystems, and this does not depend on the presence of large sizes that generally have low abundances, but rather on the groups with intermediate sizes with higher abundances. The detritivore and mycophagous groups are much more frequent in the surface stratum of the soil of all ecosystems due to the greater supply of organic material (Basset et al., 2003).
Regarding vertical stratification and in the absence of a greater number of autoecological studies explaining habitat preference, this can only be interpreted considering the availability of resources (Basset et al., 2003). The intermediate strata (herbaceous and shrubs) contain greater food offers that are reflected in values of greater abundance and diversity with respect to the any other stratum.
Ethics statement: The authors declare that they all agree with this publication and that they have made contributions that justify their authorship; that there is no conflict of interest of any kind; and that they have complied with all relevant ethical and legal requirements and procedures. All funding sources are fully and clearly detailed in the acknowledgments section. The respective signed legal document is in the journal’s archives.

