


 English (pdf)
 Article in xml format
 Article references
 Send this article by e-mail
 Cited by SciELO
  Similars in
SciELO
Similars in
SciELO  uBio
uBio 
 Permalink
Introduction
Biomarkers are measurements at any biological level that provide information concerning adverse sublethal effects due to physical, chemical or biological stressors in the laboratory or in wild organisms. Biomarkers are divided into two principal types: exposure biomarkers, which are adaptive responses that prevent damage caused by a stressor; and effect biomarkers, which refer to physiological responses to a stressor from which the organism or cell can recover (Ortiz-Zarragoitia & Cajaraville, 2006; Sarkar, Ray, Shrivastava, & Sarker, 2006). Protein biomarkers are important tools in environmental assessment because they reflect early interactions of any type of stressor with the cell, which, as a consequence, alters its physiology and protein expression (Fent, 2004; Farcy, Voiseux, Lebel, & Fievet, 2009).
HSPs are found in virtually all-living organisms and evolutionarily, are highly conserved proteins. The HSP70 family is divided into two groups: constitutive HSP70 proteins have a high basal level and are softly induced by stress; inducible HSP70 proteins are virtually absent under normal conditions, and their expression increases dramatically under stress. In eukaryotes, HSP70 can be found in any part of a cell: in the cytoplasm, mitochondria, and endoplasmic reticulum, as well as inside or outside of any other organelle or compartment; however, most HSPs are located in the nucleus. After any kind of shock or stress, the HSP content in the nucleus gradually decreases, while it increases in the cytoplasm, serving as a mediator in protein biosynthesis systems and ensuring the protein resistance of the protein synthesis apparatus (Ait-Aissa, Porcher, Arrigo, & Lambre, 2000; Piano, Asirelli, Caselli, & Fabbri, 2002; Arya, Mallik, & Lakhotia, 2007).
Such a universal spread of HSP70 indicates that they play an important role in the cell, and both the constitutive and inducible HSP70 isoforms are involved not only in protecting cells from heat shock but also in many other cellular processes basically everywhere a partial or full protein unfolding event occurs. The increased expression of HSPs has been shown to be protective, mainly mediated by the HSPs capacity to act as molecular chaperones, preventing inadequate protein folding and transporting denatured proteins to target organelles for renaturation, degradation, or repair. It was showed that HSPs played critical roles in modulating apoptotic cascades (Cruz-Rodríguez & Chu, 2002; Ivanina, Taylor, & Sokolova, 2009).
The HSP70 family are included on the proteome of marine invertebrates such as mussels (Mytilus edulis), Pacific oysters (Crassostrea gigas), and echinoderms (Strongylocentrotus purpuratus) and are involved in the renaturation, degradation and repair of damaged proteins in organisms exposed to stressors such as chemicals, heat-stress, UV radiation, pH variations, salinity stress and dissolved oxygen variations (Cruz-Rodríguez, Baucum, Soudant, Chu, & Hale, 2000; Cruz-Rodríguez & Chu, 2002; Gazeau, Quiblier, Jansen, Gattuso, Middelburg, & Heip, 2007; Geffard, Geffard, Amiard, His, & Amiard-Triquet, 2007). HSP70 family protein expression in Crassostresa virginica has been reported before by Cruz-Rodríguez et al. (2000) and Cruz-Rodríguez & Chu (2002), in oysters exposed to PCB’s and HAP’s respectively; and Ivanina et al. (2009) in oysters exposed at thermal stress and cadmium; it has also been reported in other oysters species as Crassostrea gigas, Ostrea edulies, Mytilus edulies, Dressenia polimorfa; but any reported on natural conditions.
The HSP family has been used as protein biomarkers, has evaluated in bioindicator organisms such as bivalves, particularly oysters, in environmental assessment since their expression allows the detection of damages caused by any kind of stressor, and it is possible to apply the results onto the rest of the ecosystem biota (LeBlanc & Bain, 1997; Eason & O'Halloran, 2002; Zurita et al., 2005). Marine mollusks, such the oyster Crassostrea virginica (Gmelin, 1791) have been used worldwide as bioindicators to assess the impact of pollutants in coastal lagoons ecosystems. It is due to the reason that they are widely distributed and their capability to respond to natural impacts such as hurricanes, storms, extreme rainfall, or pollution, and its ability of synthesized stress response proteins to protect homeostasis during environmental fluctuations.
Coastal lagoons are ecosystems with high primary productivity, oxygen producer and sustain reproduction and nurseries for alimentary and economically important species (Geffard et al., 2007; Macauley, Summers, & Engle, 1997). Environmental monitoring of coastal lagoons by direct measurements in water and sediment coupled with biomarker assessment in bioindicator organisms would provide information to prevent, legislate and remediate the effects of pollution.
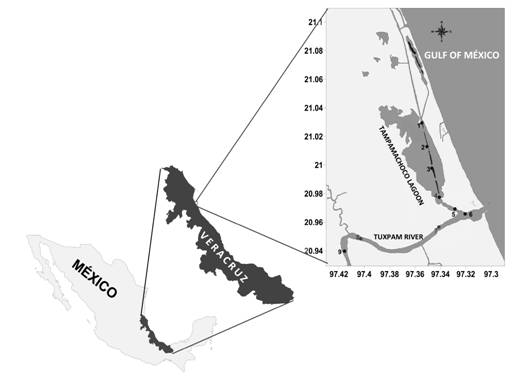
The brackish Tuxpam-Tampamachoco estuarine-lagoon system is located at the north of Veracruz, Mexico, the lagoon is approximately 2 km from the ocean. This site encounters one regime of summer rains and a season of rains accompanied by cold wind from the north during winter, locally known as “north winds season” with the entry of humidity from the Gulf of Mexico, which makes up more than 10.2 % of the total annual rains (Fig. 1).
To our knowledge, up today, there are few protein related ecotoxicological studies in Tampamachoco Lagoon. However the research group led by Botello, De la Lanza, & Villanueva (2016) evaluated sediment cores from the brackish Tuxpam-Tampamachoco estuarine-lagoon system to reconstruct the environmental conditions, through deposition of the sediment, from 1908 to 2010, finding contamination by polycyclic aromatic hydrocarbons (PAH's), metals and pesticides, with a maximum in 1990-1995. Trends indicate that the concentrations decreased in time. These concentrations became lower than the Effects Range-Low (ERL) and Effects Range-Median (ERM) (Long, Macdonald, Smith, & Calder, 1995), so they no longer cause damage in benthic organisms.
The seasonal pattern of the baseline expression of proteins should be established with the purpose of identifying the baseline constraints and tradeoffs generated by natural conditions (Portner, 2001). The aim of this work was to analyze the expression of the HSP70 family as an exposure biomarker using C. virginica gills from individuals and groups of oysters from the Tampamachoco Lagoon under natural conditions at different seasons and thermal stressed.
Materials and methods
Physical chemistry parameters: Physical chemistry parameters, such as pH, temperature (°C), dissolved oxygen (DO2 mg/L), and salinity were measured at ten geographical inside the brackish estuarine-lagoon system in both dry and north winds seasons during the collections (Fig. 1). They should not be considered in an isolated way; for instance, salinity, DO2 and temperature combined caused changes in protein expression from the dry season samples.
C. virginica samples: Forty-five oysters were sampled at collection station into Tampamachoco Lagoon during both the dry season (April 2013) and the North winds season (January 2014). Ten individuals from each season were randomly used as individual samples and the rest of the sampled oysters were used as grouped samples. Oysters were chipped and the gills were dissected and placed in RIPA lysis buffer at 4 °C until further analysis (N = 90).
Ten oysters from each season were placed in a 96 liter aquarium filled with artificial sea water made with Instant Ocean® (Kent Marine, Acworth, GA, USA) under the following conditions: pH 7.9; NH3-NH4, > 0.02 mg/L; PO4, 0.25 mg/L; NO3, > 5 mg/L; NO2, > 0.1 mg/L; temperature 23 ± 2 °C; salinity 20; and fed with Marine Snow (Two Little Fishes Inc.) at approximately 1x10¹⁰ cells per liter. Twenty-one days later, the organisms were exposed to thermal stress (42 °C) for 2 hours, and protein analysis was performed both individually and in-group samples and were used as the positive control (PC).
Protein extraction, quantification and PAGE: Frozen samples were crushed and centrifuged at 16 000×g for 10 minutes. The supernatant was frozen at -20 °C until analysis. The protein quantification was performed by the Bradford (1976) method: 30 µg of protein was diluted in sample buffer (Tris-HCl 0.5 M, pH 6.8; glycerol 30 %; SDS 4 %; and 5 % bromophenol blue) at a 1:2 proportion, then boiled for 5 min at 95 °C and immediately loaded onto a 10 % polyacrylamide gel topped with 4 % polyacrylamide stacking gels (Laemmli, 1970). PAGE (electrophoresis) was run for 2 hours at 25 mA by gel in a Mini-PROTEAN Tetra Cell electrophoresis chamber (Bio-Rad) with running buffer (25 mM Tris; 192 mM glycine; and 0.1 % SDS, pH 8.3) at room temperature. Gels were fixed for one hour with fixing solution (40 % ethanol and 10 % acetic acid); then they were stained for 1 hour with 0.25 % Coomassie Brilliant Blue G-250 dissolved in fixing solution; and finally de-stained with the fixing solution. Two types of PAGE were run: one with ten individuals from each season and two stressed individuals and one with five groups of five individuals from each season and four groups of five stressed individuals were loaded in each lane (N = 90).
Immunodetection: After electrophoresis, the proteins were transferred to a nitrocellulose membrane (Bio-Rad 162-0112) using a transfer buffer (glycine 0.192 M; Tris 0.025 M; and 20 % methanol v/v); the transfer was carried out 1:30 hours using a Criterion-Blotter (Bio-Rad 170-4071) at 120 V immersed in ice. The nitrocellulose membranes were then blocked for 1 hour in PBST20 blocking buffer (1.4 mM KH2PO4; 8 mM Na2HPO4; 140 mM NaCl; 2.7 mM KCl; 0.1 % Tween20; and 5 % nonfat dry milk, pH 7.4). Blots were incubated overnight at 14 °C with anti-HSP70 (Sigma H5147) and were rinsed three times (10 min) with PBST; then, they were incubated for two hours at room temperature with anti-mouse IgG (Sigma A9044). Excess secondary antibody was removed by three washes (10 min) with PBST, and the sites of the binding antibody were visualized by incubation with Clarity Western ECL-Substrate (17050060 Bio-Rad).
Image analysis: The molecular weight from visible lanes in PAGE was determined with Rf values obtained from acrylamide gel images (Lambin, Rochu, & Fine, 1976). Immunodetection images were captured with an LG-1500 photo-documenter, and relative intensity units (RIU) were quantified with ImageJ software (Schneider, Rasband, & Eliceiri, 2012). The RIU for each isoform was calculated by taking the ratio between each band’s RIU with its own RIU actin band. The results are expressed as the average of three independent assays.
Statistical Analysis: The physicochemical parameters of water were compared with Student’s T-test. Protein expression differences were analyzed for statistical significance using one-way ANOVA, and pair-wise comparisons were performed according to Tukey’s HSD method if a significance difference was detected. Significance was considered at P > 0.05 the statistical analysis was performed using IBM SPSS Statics software (IBM, 2017).
Results
Physical chemistry parameters: Physical chemistry parameters in water were measured along the Tuxpam-Tampamachoco brackish estuarine-lagoon system at ten geographical points in both seasons (Table 1). The average values were pH of 8.5 ± 0.19 and 8.29 ± 0.12; temperature of 26.04 ± 0.93 and 19.10 ± 0.32 °C; salinity of 31.07 ± 4.59 and 31.40 ± 3.72; and DO2 of 10.15 ± 2.56 and 6.21 ± 0.68 mg/L in the dry and north winds seasons, respectively. Differences in temperature and DO2 were statically significant, but pH and salinity were similar for both seasons, both whit a 95 % confidence interval (P < 0.05).
TABLE 1 Physical chemistry parameters measured in the dry and north winds seasons
| Geographical points | pH | Temperature (ºC) | Salinity (UPS) | DO2 (mg/L) | ||||||
| Latitude | Longitude | Dry | Norths | Dry | Norths | Dry | Norths | Dry | Norths | |
| 1 | 97°35'47’’ | 21°02'94’’ | 8.08 | 8.08 | 26.00 | 19.00 | 33.94 | 26.00 | 7.23 | 6.49 |
| 2 | 97°35'04’’ | 21°01'25’’ | 8.25 | 8.21 | 26.00 | 19.00 | 33.88 | 34.00 | 8.21 | 5.35 |
| 3 | 97°34'66’’ | 20°99'75’’ | 8.38 | 8.44 | 25.00 | 19.00 | 33.87 | 33.00 | 8.44 | 6.11 |
| 4 | 97°34'08’’ | 20°97'72’’ | 8.37 | 8.43 | 25.00 | 19.00 | 33.75 | 34.00 | 8.24 | 5.35 |
| 5 | 97°32'94’’ | 20°96'91’’ | 8.40 | 8.39 | 25.00 | 19.00 | 34.10 | 30.00 | 8.25 | 7.26 |
| 6 | 97°32'05’’ | 20°96'60’’ | 8.49 | 8.24 | 26.00 | 19.00 | 31.44 | 35.00 | 10.27 | 7.10 |
| 7 | 97°34'11’’ | 20°95'44’’ | 8.61 | 8.21 | 27.00 | 19.00 | 27.07 | 36.00 | 14.44 | 6.57 |
| 8 | 97°40'27’’ | 20°94'86’’ | 8.71 | 8.40 | 28.00 | 19.00 | 24.39 | 31.00 | 13.57 | 6.34 |
| 9 | 97°41'56’’ | 20°93'98’’ | 8.65 | 8.25 | 27.00 | 19.00 | 22.77 | 30.00 | 12.66 | 5.50 |
| 10 | 97°30'59’’ | 20°26'90’’ | 8.53 | 8.28 | 25.00 | 20.00 | 35.50 | 25.00 | 10.19 | 6.04 |
Sample characterization: The average oyster weight was 58 ± 5.2 g and 51 ± 7.1 g; the average size was 7.40 ± 1 cm and 6.8 ± 0.6 cm; and the average protein yield was 5.9 ± 2 mg/g and 7.5 ± 1.9 mg/g from the dry and north winds seasons, respectively, all of them without statically significant difference with a 95 % confidence interval (P < 0.05).
PAGE-SDS: The electrophoretic pattern of total soluble proteins from individuals and five grouped samples of C. virginica gills from the dry season, the north winds season, and PC are shown in figure 2 (Fig. 2). Similar concentrations of protein were loaded in each lane; nevertheless, different patterns of bands were observed between seasons. For example, the 125 kDa band appeared only in individual samples of the positive control. Another 69 kDa band appears only in the dry season, in both individual and clustered samples. Also, a 61 kDa band was observed in the dry season, only in individual samples, but not after pooling (Table 2).
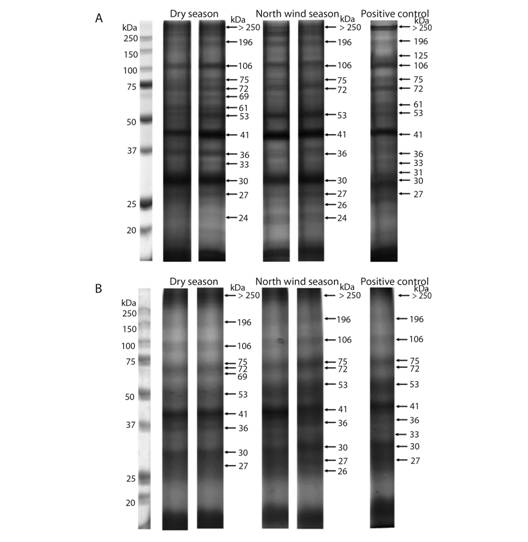
Fig. 2. Total soluble protein electrophoretic patterns from C. virginica gills. Each lane represents the protein from one individual (A) and grouped samples (B). The first lane is the molecular weight marker.
TABLE 2 Bands observed in PAGE from Individual or Grouped Samples of oyster gills
| Molecular weight (kDa) | SEASON | CONTROL | ||
| Dry Season | North winds season | Positive control | ||
| 125 | - | - | Individual | |
| 69 | Individual and Group samples | - | - | |
| 61 | Individual | - | - | |
| 33 | Individual | - | Individual | |
| 26 | - | Individual and Group samples | - | |
| 24 | Individual | Individual | - | |
Immunodetection: The anti-HSP70 immunodetection of proteins from oyster gills showed the presence of three isoforms, HSP73, HSP72 and HSP69, in both, the individual and grouped samples; although the first two were expressed in all samples, HSP69 was only expressed in both individual and grouped samples from the dry season (Fig. 3).
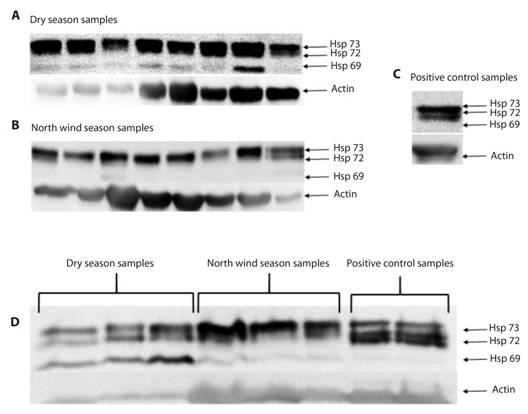
Fig. 3 Representative HSP family immunodetection. In individual (A, B, C) and grouped (D) samples: HSP73 and HSP72 isoform expression is observed in all samples, and the HSP69 isoform can only be observed in both individual (A, B) and grouped (D) samples in the dry season.
HSP expression levels seasonal variation: Semi-quantitative expression analysis of HSP was done on three isoforms, HSP73, HSP72 and HSP69, using RIU. The average HSP73 from individual and grouped samples was 1.30, 0.52, 0.44, 0.40, 0.66 and 0.21 RIU, respectively (Fig. 4), and the dry season and PC individual samples showed higher expression than the other ones.
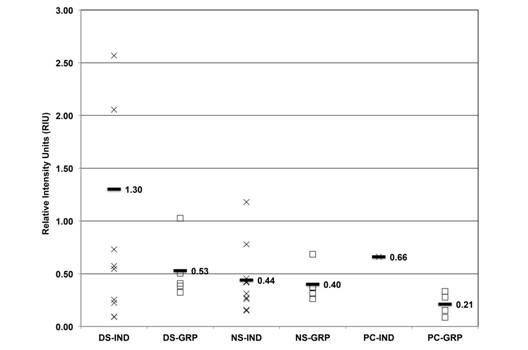
Fig. 4 HSP73 expression (RIU) in C. virginica gills from the dry season (DS), north winds season (NS) and positive control (PC) measured on individual (IND-X) and grouped (GRP-☐) samples. Average (-) from individual and grouped samples.
The average HSP72 from individual and grouped samples was 0.19, 0.66, 0.09, 0.33, 0.42 and 0.20 RIU, respectively (Fig. 5). The grouped dry season and individual PC samples showed higher expression than the other ones.
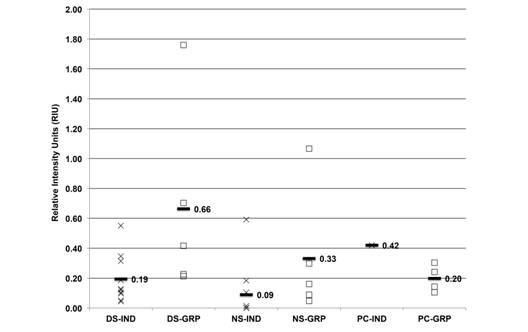
Fig. 5 HSP72 expression (RIU) in C. virginica gills from the dry season (DS), north winds season (NS) and positive control (PC) measured on (IND-X) and grouped (GRP-☐) samples. Average (-) from individual and grouped samples.
The average HSP69 from individual and groups samples was 0.04, 0.67, 0.01, 0.01, 0.00 and 0.00 RIU, respectively (Fig. 6). This isoform was expressed in 50 % and 100 % of individual and grouped samples, respectively, from the dry season, and its expression in other samples was not significant.
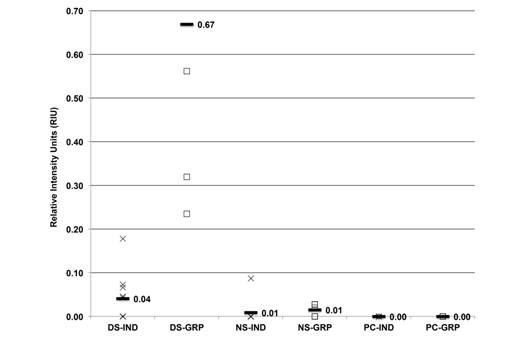
Fig. 6 HSP69 expression (RIU) in C. virginica gills from the dry season (DS), north winds season (NS) and positive control (PC) measured on individual (X) and grouped (-) samples.
Statistically (ANOVA), HSP73 and HSP72 expressions did not show significant differences among seasons, individual and grouped samples with a 95 % confidence interval (P < 0.05). However, HSP69 expression in individual and grouped samples was significantly different with a 95 % confidence interval (P < 0.05) in the dry season in comparison to the other seasons.
Discussion
Similar to this work, there are studies where HSP expression is used as a stress biomarker in oysters. Snyder, Girvetz, & Mulder (2001) examined HSP responses of Mytilus galloprovincialis and Haliotis rufescens exposed to thermal stress, degraded oil, heptachlor, phenobarbital, (-naphthoflavone and pentachlorophenol; Hamdoun, Cheney, & Cherr (2003) assessed HSP protein and hsp gene expressions as a response to heat stress in Crassostrea gigas; and Piano et al. (2002) evaluated HSP protein expression in Ostrea edulis exposed to heat stress. All these studies analyzed exposed organisms to a specific stressor, but none analyzed HSP from oyster gills in natural conditions.
When PAGE was analyzed, different protein expression was observed regardless of the sample (individual or grouped) or season. Because these results were repeated and consistent, it would be interesting to identify the different proteins present in each season to propose them as biomarkers.
In this work, we found three HSP isoform expressions (HSP73, HSP72 and HSP69) from the gills of oysters collected in two different seasons from a site reported to have little pollution (Botello et al., 2016) relative to concentrations that are known to affect benthic organisms (Long et al., 1995). It is possible that this expression has been generated due to fluctuations in physical chemistry parameters, particularly in HSP69, since it was only expressed in the dry season, where the salinity (31 UPS) and dissolved oxygen (10.1 mg/L) were higher than recommended by Shumway (1996), and United Nations Environment Programme (14-28UPS; and 9.5 mg/L at < 20 °C, respectively). In addition to these parameters, the temperature was 26 °C in the dry season, warmer temperatures led to earlier and greater growth rates, and the larger final size increased the metabolic activity of the oysters (Abbe, Riedel, & Sanders, 2000). In the dry and north winds seasons, the pH was approximately 8, which is within the range of optimal pH for brackish waters; therefore, this parameter did not have an influence on HSP expression.
The HSP family isoform expression seems to be species and stressor dependent; for example, Chapple, Smerdon, & Hawkins (1997) reported the HSP78, HSP72 and HSP70 isoforms expression in M. edulis, but they did not determine if they were constitutive or induced. Snyder et al. (2001) reported that the HSP74, HSP70 and HSP67 isoforms were induced in Mytilus galloprovincialis and Haliotis rufescens when exposed to thermal stress and xenobiotics (e.g., 2-methoxyethanol). Cruz-Rodríguez & Chu (2002) stated that the HSP71 and HSP69 isoforms expression was induced when C. virginica was exposed to aromatic polycyclic hydrocarbons. Hamdoun et al. (2003) and Piano et al. (2002) found HSP77 and HSP72 to be constitutive isoforms, and HSP69 an induced isoform by thermal stress in C. gigas and Ostrea edulis, respectively. In this work, HSP73 isoform expression was present in all samples, HSP72 isoform expression was variable, and HSP69 was only expressed in individual and grouped dry season samples. The HSP73 isoform has not previously been reported in C. virginica adults.
Boutet, Tanguy, Rousseau, Auffret, & Moraga (2003) found an inverse relationship between the expression of HSP70 and metal concentrations in C. gigas. In other species of bivalves, Piano, Valbonesi, & Fabbri (2004) reported that after thermal stress, induced isoforms were not expressed in M. galloprovincialis, Tapes phillippinarum and Scapharca inaequivalvis; nevertheless, the constitutive isoforms were significantly elevated. The HSP expression from PC oysters that were under thermal stress was lower than that of the wild oysters. Of particular interest is the expression of HSP69 during the dry season, where more than 50 % of the dry season individual and grouped samples expressed it, without losing sight of the fact that pollution has gradually declined (Botello et al., 2016). This expression was also observed by Piano et al. (2002) in O. edulis and Hamdoun et al. (2003) in C. gigas, who proposed that this isoform was induced by heat stress; Cruz-Rodríguez & Chu (2002) reported it in C. virginica as a response to polycyclic aromatic hydrocarbons.
The challenge of using proteins as biomarkers is determining the range of basal expression and the moment at which they are expressed due to an adverse effect or compensatory response that protects the organism against environmental damage or xenobiotics (Chapple et al., 1997; Farcy et al., 2009; Luna-Acosta, Bustamante, Godefroy, Fruitier-arnaudin, & Thomas-guyon, 2010). Therefore, it is essential to determine the baseline levels of HSP before comparison with data from contaminated sites. Moreover, as we studied individual and grouped samples, the interpretation of the results was improved in comparison to most reports that were made with organism’s pulls.
The present study demonstrates that the HSP70 family of proteins could be used as unspecific stress biomarker in oysters. Environmental conditions have been shown to have an effect on C. virginica protein expression because of the different electrophoretic patterns obtained from the total soluble proteins of gills, as well as the different expression levels of the HSP family isoforms. Studies on the changes in environmental conditions, such as pH, temperature, DO2, and salinity, should be directed towards measuring the damage they cause at the sub-cellular, cellular and tissue levels before exposure of an organism to any xenobiotic. The stress could be detected not only by the expression of inducible HSP70 isoforms but also by the expression levels of constitutive isoforms, which can be over-expressed or inhibited depending on environmental conditions. The main difficulty in assessing biomarkers is the natural interference of environmental factors with biological responses, making the interpretation rather difficult.
This work presents similar results obtained from both individual and grouped samples; although the evaluation of individual organisms slightly increased the variability, this handling offers the opportunity to more accurately determine if environmental changes affect low biological scale levels.

