


 English (pdf)
 Article in xml format
 Article references
 Send this article by e-mail
 Cited by SciELO
  Similars in
SciELO
Similars in
SciELO  uBio
uBio 
 Permalink
The physicochemical composition of lentic water bodies is influenced by human activities and the interactions between climatic and geochemical variables in the drainage basin zone (Bu, Meng, Zhang, & Wan, 2014).
In semiarid regions, quality assessment of water in rivers and dams should include monitoring trends evolving both spatially and over time, as an important tool to manage water resources (Cardoso-Silva & Soares da Costa, 2015). Reservoirs in semiarid climates are exposed to drastic variations in water volume due to human demand during drought seasons, which accelerates eutrophication processes particularly in tropical regions (Girão-Braga et al., 2015).
In Northwestern Argentina, various reservoirs have been built for water storage as well as other requirements during long periods of low water levels (fall-spring). The singular hydro-climatic conditions of the region and the morphometric characteristics of these reservoirs make them even more vulnerable to disturbance agents, such as rural and urban anthropogenic activities which significantly influence the processes that determine the trophic state (Salusso, 2005).The major factors responsible for the quality of water composition are natural weathering of geological soil components, entrainment of suspended solids through surface runoff from agricultural areas, and anthropogenic actions (Salusso, Moraña, & Araoz, 2004).
This region features two important basins: the endorheic Salí-Dulce basin (Tucumán province) and the Juramento basin (Salta province). Unfortunately, they exhibit the highest level of pollution that has been accelerated over the last decade (Salusso, 2010).The reservoirs El Cadillal, Escaba, and Río Hondo (Salí-Dulce basin) and those of Cabra Corral and El Tunal (upper Juramento basin, Salta) are strategic for their socio-economic developments. They constitute point and non-point sources of pollution that affect the current use of water from dams (hydroelectric power production, irrigation, recreation and fishing) and, in the case of El Cadillal, the water supply for 60 % of the population in the capital of Tucumán.
Although previous isolated studies have been conducted on the reservoirs dating back more than ten years (Tracanna et al., 1991; Tracanna, Seeligman, & Mirande, 1996; Tracanna et al., 1999, 2006, Tracanna, Martínez De Marco, Taboada, Mirande, & Isasmendi, 2014a, Tracanna, Seeligmann, Mirande, Martínez De Marco, & Isasmendi, 2014b; Salusso, 2005, 2010; Salusso & Moraña, 2000, 2014a, b), simultaneous studies comparing the reservoirs of both basins have not yet been published. Given that these reservoirs bear considerable economic and ecological importance, this study is aimed at characterizing the water quality in five reservoirs of the two different systems, in order to provide information for their management and monitoring. We hypothesized that low water levels are associated with water quality degradation, resulting in increased chlorophyll-a concentrations. This paper compared the water quality status and phytoplankton biomass in the Cabra Corral (CC) and El Tunal (ET) reservoirs of the upper Juramento basin (UJB) and in the El Cadillal (EC), Escaba (Es) and Río Hondo (RH) reservoirs of the Salí-Dulce basin (SDB), in order to establish the relative level of deterioration.
Materials and methods
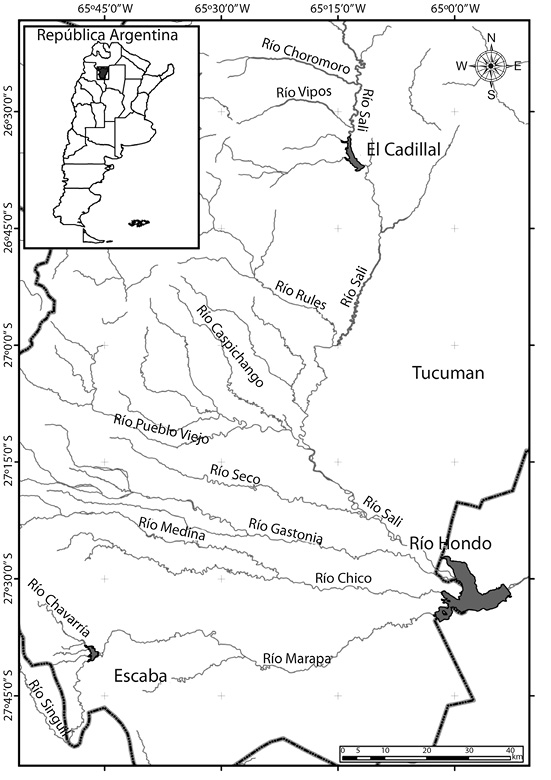
Description of sites: The endorheic SDB has a dense network of rivers extending virtually all across the province of Tucumán. The tributaries originating in and flowing down from the Calchaquí summits and the Aconquija Mountain drain their water into the Mar Chiquita salt-lake (Córdoba). The basin exhibits two artificial reservoirs on the main tributary, the Salí River: El Cadillal (EC) and Río Hondo (RH) and, as part of the Marapa River sub-basin, the Escaba (Es) reservoir, which receives its water from the Singuil and Chavarría permanent watercourses (Figure 1).The reservoirs of the SDB are located as follows: Es (27o39’31.6” S - 65o45’46.3” W), EC (26o40’00” S - 65o7’00” W), and RH (27o30’00” S - 65o45’00” W).
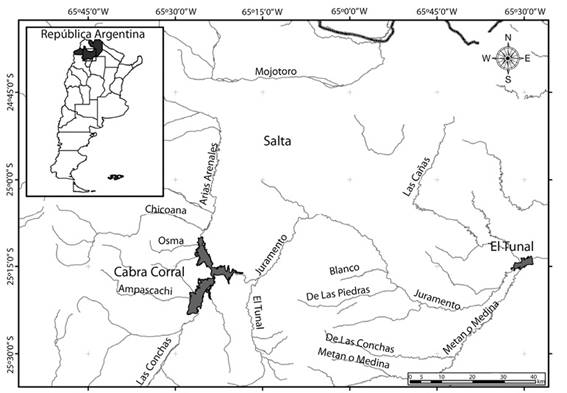
The UJB is the most significant contribution zone to the Salado system, covering a large area in the province of Salta including the Calchaquí, Lerma and Metán Valleys. The latter two valleys are the areas with the greatest economic turnover and population density (>50 % of the provincial population). The Cabra Corral dam (CC) is the largest in the UJB and receives its water from two main tributaries, the Guachipas River (CCG: Cabra Corral Guachipas) in the South and the Arias-Arenales River (CCA: Cabra Corral Arias-Arenales) in the North, and drains into the Juramento River (Figure 2). El Tunal (ET) is located in the Chaco-Salteño Plain and receives 70 % of its water from the Juramento River. The reservoirs of the UJB are located as follows: CC (25o17′43.3″ S - 65o20′48.8″ W) and ET (25o14′43″ S - 64o28′35.8″ W). On the basis of the winter mixing and summer stratification, the reservoirs have been characterized as warm monomictic (Salusso, 2005; Tracanna et al., 2006).
Sample collection and analysis: The reservoirs in the Tucumán province: El Cadillal (EC), Escaba (Es) and Río Hondo (RH) (the latter in the border between Tucumán and Santiago del Estero), and the reservoirs in the Salta province: Cabra Corral (CC) and El Tunal (ET) were sampled in three different dates; the first one during the months of minimum water flows (October or November) and the other two in the floodwater period (February and May) during 2002 - 2008. Thirty samples were collected each year, for a total of 210 samples from 21 dates. In all reservoirs, samples were collected in the lacustrine zone, near the dam structure: EsP (Escaba dam), RHP (Río Hondo dam) and ECP (El Cadillal dam) in the Tucumán Province; and CCP (Cabra Corral dam) and ETP (El Tunal dam) in the Salta Province. In Escaba, samples were collected only at the dam (EsP) whereas for the others, samples were collected also in the major tributary inflows or “colas” as follows: ECC (El Cadillal Cola), RHC (Río Hondo Cola), ETC (El Tunal Cola). In Cabra Corral, two inflows of rivers were sampled: the Guachipas (CCG) and Arias (CCA). For all sites, only one sample was collected at depth of one Secchi disk using the Van-Dorn Bottlewater sampler. Samples for dissolved oxygen (DO) were fixed in situ, and 1.5 L plastic containers were used for chemical analyses of major ions, nitrogen compounds, orthophosphate and total phosphate. All samples were transported to the laboratory on ice and stored at 4°C until analyzed.
The following physicochemical variables were measured: Secchi transparency (m), pH (units of pH), conductivity (uS.cm-1) and temperature (T °C) with specific electrodes; turbidity (NTU) with Hach turbidimetry, dissolved oxygen (mg/L) for Winkler titration; nutrients with spectrophotometric techniques of the APHA (2005); nitrate (N-NO3 -/L) for cadmium reduction method; total phosphate (PT/L) and soluble phosphate (P-PO4 3-/L) for ammonium persulfate and ascorbic acid methods; chlorophyll-a corrected for phaeophytins with 90 % acetone extraction (Wetzel & Likens, 1991) and phytoplankton density (ind./mL) with the Utermöhl technique (1958). The trophic conditions of the reservoirs’water were estimated with the Trophic State Index (TSI) proposed by Carlson (1977).
The distinctive features of the monitored reservoirs are shown in Table 1. The reservoirs of both basins are located in environments well-differentiated by their geomorphology, climate, phytogeography and human influence. The temperature of the region differs as a result of its topographical location; however, in all cases during winter it is above 4 °C (Table 2). Water bodies exhibited a typically monomictic winter mixing period. Average records of environmental temperature were greater in RH, with the lowest temperatures in Es (Table 2). The average annual rainfall in the various basins was sufficient to produce soil erosion, exceeding 400 mm (Ryding & Rast, 1992).
Table 1: Morpho-hydrometric features of reservoirs
| Reservoir | Area (km2) | Volume (Hm3) | Zmax (m) | Tw (yrs.) | Drainage basin (km2) | Zav (m) | V/S (volumesurface) | Height asl |
| El Cadillal (EC) | 13.6 | 240 | 50 | 0.51 | 5 200 | 17.6 | 17.65 | 610 |
| Río Hondo (RH) | 340 | 1 600 | 25 | 0.48 | 10 000 | 4.0 | 4.71 | 260 |
| Escaba (Es) | 5.85 | 126 | 65 | - | 800 | 21.5 | 21.54 | 650 |
| Cabra Corral (CC) | 113.6 | 2 904 | 50 | 1.5-2.5 | 30 000 | 27.5 | 25.56 | 945 |
| El Tunal (ET) | 22.83 | 174 | 35 | 0.25 | 5 900 | 7.6 | 7.62 | 475 |
Zmax: maximum depth, Zav: average depth, Tw: hydraulic residence time, Height asl: height above sea level. Source: Salusso (2005).
Table 2: Average climatic variables for reservoirs of Salí-Dulce and Juramento Basins
| Rainfall | Monthly Air Temperature Averages (T ºC) | |||||||||||||
| Reservoir | mm | Jan. | Feb. | Mar | Apr | May | Jun | Jul | Aug | Sept | Oct | Nov | Dec | Year |
| Escaba | 1 200 | 23.8 | 23.0 | 20.9 | 17.5 | 14.4 | 10.9 | 10.7 | 12.5 | 15.2 | 18.8 | 21.4 | 23.4 | 17.7 |
| El Cadillal | 1 000 | 24.3 | 23.5 | 21.6 | 18.2 | 15.2 | 11.8 | 11.6 | 13.5 | 16.3 | 19.8 | 22.2 | 24.0 | 18.5 |
| Río Hondo | 512 | 26.8 | 25.8 | 23.5 | 19.9 | 16.6 | 13.0 | 12.9 | 15.0 | 18.3 | 22.1 | 24.6 | 26.6 | 20.4 |
| Cabra Corral | 416 | 23.8 | 22.9 | 21.2 | 18.1 | 15.0 | 11.9 | 11.7 | 13.8 | 16.7 | 20.1 | 22.1 | 23.6 | 18.4 |
| El Tunal | 667 | 25.6 | 24.6 | 22.9 | 19.6 | 16.7 | 13.4 | 13.2 | 15.2 | 18.1 | 21.7 | 23.8 | 25.3 | 20.0 |
Source: INTA (National Institute for Agricultural Technology in Argentina).
Orographic conditions are determined by the strong Andean relief, as well as the Sub-Andean and Pampas mountain ranges, which play an important role in the region’s climate by establishing the rainfall distribution, particularly between November and March of each year (Table 2).
In general, the volumes of the dammed water bodies are minimum in spring and maximum in summer-fall, depending on rainfall distribution. The seasonal rainfall pattern restricted to the warm summer months provides significant water volumes that permit the reservoirs to reach their peak between April and May. Located in the piedmont of the cloud forest or yungas, the Es reservoir is prone to greater relative rainfall (reaching 2 171 mm annually); at the other end, other water bodies can be found in the most arid region of the xerophytic Chaco (ET may show values < 400 mm annually and RH 512 mm in total). Pronounced differences are noted in the levels of all water bodies, with the deepest levels at 30 m as the water is used for irrigation during dry periods or for human consumption in places such as EC. Because of its ionic composition, water is calcium-bicarbonate-type in the UJB reservoirs (Salusso, 2005), sodium- to calcium-bicarbonate-type in Es, sulfate-sodium-calcium-bicarbonate-type in EC and bicarbonate-sodium-calcium-sulfate-type in RH (Tracanna et al., 2014a).
Results were analyzed using the InfoStat software (Di Rienzo et al., 2013). In the case of non-normal distribution data for the comparison of the sites, the nonparametric Kruskal-Wallis (H) test was used. This test replaces ANOVA when normal distribution and/or homogeneous variance assumptions are not met (Bartlet test). The Student’s t-Test or Mann-Whitney U-Test was used to compare hydrological cycle stages or two basins, as appropriate. The nomenclature used to denote the hydrological cycle stages is E (from estiaje in Spanish) for the period of minimum water flows (for instance, CCAE, minimum water flows in Cabra Corral Arias; EsPE, minimum water flows in the Escaba reservoir) and C for waterfloods (for instance, RHPC, waterfloods in the Río Hondo reservoir; ECCC, waterfloods in El Cadillal Cola).
Different correlations were made between variables (Pearson coefficient, P < 0.05). The Principal Component Analysis was used considering the sites in both hydrological cycle stages and 13 limnological variables: phytoplankton biomass (expressed in density of individuals.mL-1, and in chlorophyll-a concentration mg.m-3) as well as the various algal community attributes: diversity (H), number of species (R) and species equitabilities (J) and the physicochemical variables (pH), conductivity, transparency, T °C, % O2 saturation, turbidity, nitrate and orthophosphate concentrations, principally.
Results
Physicochemical water parameters: The reservoirs exhibited differential morphological and hydrological features (Table 1). RH showed the largest relative surface area and CC the largest water depth and residence time. On the other hand, Es presented the lowest relative surface area and volume.
No differences were found in sites regarding water temperature. Average temperature was 22.6 °C, with a peak at 31.80 °C in March 2008 in the case of the water flowing from the Juramento River into the ET reservoir. In all reservoirs, pH values ranged from the neutral to alkaline scale, suggesting an appropriate buffer capacity (Table 3) with no significant differences among the water bodies. The lowest pH relative value (7.71) found was at Es in May 2002, and the highest value was at CC in the lacustrine zone (9.52) in February 2004.
Table 3: Water physicochemical variables in the sampling sites of the reservoirs, 2002-2008
| Site | pH | Turbidity | Conductivity |
| CCA | 8.86±0.33 | 23.92±36 b | 365.59±61 ab |
| CCG | 8.67±0.37 | 16.72±17 ab | 367.96±56 bc |
| CCP | 8.81±0.52 | 13.35±18 a | 427.45±59 ab |
| ECC | 8.57±0.23 | 25.39±24 b c | 987.67±320 e |
| ECP | 8.44±0.30 | 28.56±39 b c | 945.94±326 e |
| ETC | 8.76±0.28 | 21.02±16 b c | 568.11±76 cd |
| ETP | 8.63±0.49 | 20.45±18 b c | 529.89±83 bcd |
| RHC | 8.42±0.50 | 48.61±67 c | 655.40±167 d |
| RHP | 8.45±0.38 | 38.03±58 c | 657.35±162 d |
| Es | 8.20±0.45 | 6.96±4 a | 205.44±40 a |
| Not significant | H= 27.80m P = 0.001 | F= 39.69 P < 0.0001 |
Different letters in each column indicate highly significant differences among the sites (CCA: Cabra Corral Arias), CCG: C.Corral Guachipas, CCP: C.Corral dam; ECC: El Cadillal cola, ECP: El Cadilla dam, ETC: El Tunal cola, ETP: El Tunal dam, RHC: Río Hondo cola, RHP: Río Hondo dam, Es: Escaba dam).
The highest turbidity was found in RH, both at the dam itself and in the Salí River inflow (RHC). On the other hand, the Es and CC lacustrine zone showed the lowest turbidity values, separating them from the others. In RH, the maximum suspended material concentration was the result of both the bioseston and the non-sestonic material that generated similar turbidity in the entire water body with no differentiation of the various hydrological cycle stages. The significant volume of allochthonous material received was produced by the point and non-point sources of anthropic pollution in spite of the temporary sedimentation processes that occurred as tributaries lost speed when flowing onto the plain.
Suspended solid contents and turbidity in EC resulted from the steep slopes of the summits (Calchaquí Valley and Medina) with readily erodible limo loessian soils and scarce vegetation cover, typical of the semiarid microclimate in the Tapia-Tranca Valley. Regarding conductivity, EC showed the highest average (987.67 µS.cm-1), which significantly differed from the others. RH, ET and CC were in a descending salinity gradient with no statistical differences. Es was at the other end, showing the lowest conductivity value (205.44 µS.cm-1). RH, ET and EC exhibited the lowest transparency average, significantly different from CC and Es (Table 4).
Table 4: Mean trophic variable values in the reservoirs of both basins, 2002-2008
| Reservoir | Secchi (m) | N-NO3 = | P-PRS | P-TP | Chl-a* |
| Cabra Corral | 1.77 a | 0.20 a | 0.16 a | 0.65 a | 15.18 a |
| El Tunal | 0.86 b | 0.17 a | 0.13 a | 0.63 a | 8.61 b |
| Escaba | 1.12 a | 0.23 ab | 0.09 a | 0.15 a | 15.57 a |
| El Cadillal | 0.91 b | 0.37c | 0.16 a | 0.22 a | 6.72 b |
| Río Hondo | 0.78b | 0.26 b | 0.43 b | 0.77 b | 6.74 b |
| P < 0.0001 | P < 0.0001 | P = 0.0001 | P < 0.0001 | P =0.023 |
Transparency values were lower in the RHC (0.67 m) and in the ET (0.70 m) and the EC (0.73 m) river inflows, while the highest value was found in the CC dam (2.03 m) (Table 4). In other words, the Secchi disk was lower in those reservoirs showing a lower volume-to-surface ratio, such as the RH with 4.17 m and the ET with 7.62 m.
Physicochemical variables concerning the basin geochemistry were different among reservoirs. The substrate’s crystalline basement exhibited limited mineralization in the Es basin, and its nature was reflected in the water’s hydrochemical status. Conductivity values were the lowest here as a result of a virtually preserved forest, which served as a barrier that mitigated the erosive effect. The highest average was found in an increasing gradient in the EC, where the high salinity contents resulted from the combination between hydrogeochemistry (tertiary sedimentary rocks with sandstones, silts and gypsum banks) and the mesoxerophitic climatic condition, which favored ion lixiviation from recently deforested farmland.
In the ET, sedimentation values mainly resulted from the basin’s geomorphological nature as well as the laminar erosion of the top soil in the surrounding soy plantation area. Dissolved ions originated when the Juramento Riverwas filled with salts flowing through tertiary sedimentary rocks in Sierra de Lumbrera, a meteorization effect accentuated by surrounding steep slopes (Sierras de Metán, Guanacos and Lumbrera).
Nutrients, algal biomass and trophic state: The variables determining trophy showed differences during the sampling period (Table 4 and Table 5). Reservoirs of the UJB exhibited lower nitrate values compared to those in the Salí-Dulce basin. Unlike the other reservoirs, soluble and total phosphorus contents were significantly higher in the RH, while the EC exhibited the highest nitrate contents.
Table 5: Trophic variable values in the reservoirs, 2002-2008
| Reservoir | Chl-a | Dens.* (ind./ml) | H* | Nro. Sp.* | Nro. Sp. |
| CC | 29.88a | 1657b | 2.08a | 14ª | 15.76a |
| ET | 13.07b | 1619b | 2.60 b | 18.5b | 19.86b |
| Es | 33.38a | 1467ab | 2.12ab | 15ab | 17.17ab |
| EC | 19.96b | 784a | 2.19ab | 17ab | 18.13ab |
| RH | 12.35b | 698ab | 2.61b | 21.5b | 21.79b |
| Sig level | 0.023 | 0.046 | 0.029 | 0.049 | 0.049 |
(*Medians) Different letters in each column indicate highly significant differences among the sites.
During the 2002-2008 period, deeper reservoirs with higher volume-to-surface ratio (CC and Es) exhibited more significant average biomass production in spite of their considerable differences in the contribution basin zone and the anthropic impact received. On the other hand, the final collecting water bodies (RH and ET) held the highest species diversity and richness attributes.
The reservoirs in the plains exhibited less biomass production mostly due to the suspended solids in the ET and the RH and to the impact of inflowing pollutants. In the EC, algal biomass production was also limited based on the erodible material and dissolved salts received.
A common scenario for the phytoplankton was noted in all the reservoirs with scarce dominance variance: diatoms in mixis and chlorophytes and cyanobacteria in stratification with a few abundant species, such as Bacillariophyta: Aulacoseira granulata, Cyclotella meneghiniana; Chlorophyta: Chlamydomonas spp., Planktosphaeria gelatinosa, Sphaerocystis schroeterii, Oocystis spp.,Monoraphidium spp., Closterium spp., and Cyanobacteria: Dolichospermum flos-aquae, Microcystis aeruginosa, M. flos-aquae, Lyngbya spp., Chroococcus spp., Cryptophyta: Rhodomonas minuta, and Dinophyta (Ceratium hirundinella).
The higher frequency of species diversity ranged between 1.71 and 2.32, except for the EC during December 2005 (0.18), the CC during October 2003 (0.22), the RH during March 2005 (4.46) and the EC during May 2005 (4.26). The reservoirs in the UJB exhibited the lowest averages of species diversity at low flows: CCP 1.37 and ETP 1.59. During floods, the Salí-Dulce reservoir exhibited higher specific diversities in the water flowing from both the RH and EC Rivers into the Salí reservoir with averages at 3.41 and 3.09, and in the reservoirs with averages between 3.05 and 3.04, respectively.
In addition, significant correlations were noted between nitrate content and chlorophyll concentration (r = 92; P = 0.0001) and nitrogen vs. species diversity and richness (r = 52; P = 0.013) in the SDB. In the RH, cyanobacterial blooms were recorded during the sugarcane harvest period, which was favored by high temperatures, lack of winds and high nutrient concentrations. Dolichospermumflos-aquae, Microcystis aeruginosa and M. flos-aquae were the species that most frequently appeared in the blooms.
The trophic status of the reservoirs was related to the systems’ hydrological fluctuations between climatic periods (rainy and dry), ranging from eutrophic to hypereutrophic status during the seven-year period. The lowest average values were registered in Escaba (54.69) and the highest ones in Río Hondo (71.42), with a tendency for values to worsen in all the reservoirs during periods of minimum water flows.
Variables in hydrological cycle: A clear pattern of soluble nitrogen concentrations was observed in relation to the hydrological cycle stages, the highest values being found during floods (0.28 mgN/L) vs. minimum values during water flows (0.18 mgN/L) (T = 2.73; P = 0.0069). Although exogenous nitrogen increased during high water phases in reservoirs with lower surface area and volume (Es, EC, ET), those with greater surface area and volume (CC and RH) tended to exhibit higher contents at low flows as a possible result of mineralization and inner regeneration.
An overall climatic pattern of greater algal biomass concentration was found at low flows when water mass was stabilized, which favored phytoplankton development. The reservoirs with higher average biomass levels were Cabra Corral at all of its sites during minimum water flows (CCPE = 63.36 mg Chl-a m-3; CCAE = 54.62 mg Chl-a m-3 and CCGE = 36.74 mg Chl-a m-3) and Escaba (EsPE = 51.32 mg Chl-a m-3). During dry periods, phytoplankton was more abundant in the water flowing from Salí River into the RH dam (RHPE), and in the water flowing from the Guachipas River into the CC dam (CCGE). Although Es exhibited the highest value for floods (3175 ind./mL), other high point values were also registered during floods in CCP (66 227 ind./mL, March 2007) and ET (13 236 ind./mL, May 2008).
All reservoirs showed the following biological variables in the stages of the hydrological cycle: higher phytoplankton biomass at low flows (35.68 mg Chl-a m-3) vs. floods (13.68 mg Chl-a/ m3) (T = 3.42; P = 0.001). During minimum water flows, species richness (14.30 sp) and equitability (0.51) were lower vs. floods (20.23, 0.59, respectively) (T = 2.36; P = 0.0196). No differences in abundance were noted among the phases.
In the UJB, algal density correlated positively with phosphorus (r = 84, P = 0.0015). Cyanobacteria blooms (Microcistys spp., Dolichospermum spiroides, D. circinalis) were related to high temperature events and increased residence time during the stagnant water periods. Total biomass, especially in the ET, was conditioned by the hydrometric level.
The Principal Component Analysis conducted at the sites during both stages of the hydrological cycle and the 13 limnological variables allowed the reduction to two components, accounting for 49 % of the cumulative variances. The first component explained 32.3 % of the data variability. The most contributing parameters were the ecological attributes and phytoplankton biomass, dissolved oxygen, soluble nitrate, and transparency (Table 6, Figure 3). This component contributed to a separation of the sites according to the various stages of the hydrological cycle: samples obtained during waterfloods were located toward the extreme positive end, when most reservoirs exhibited higher values for species diversity (H), with a peak in the RH River inflow (RHC) (H = 3.41) and for species richness (30 spp.). The uniformity of distribution of abundance among the species was maximum in the EC (J = 0.75). The lowest biomass values were found in this period, particularly in the EC (cola 2.74 mg Chl-a m-3 and lacustrine zone 3.79 mg Chl-a m-3). During waterfloods the values for dissolved oxygen were lower, e.g. in the Es (EsPC = 55 %) as were the values for transparency in tributary inflows, e.g. in the ET (ETC = 0.59 m) and the EC (ECPC = 0.64 m). The EC exhibited the highest nitrate contents (dam 0.49 N-NO3 =and river inflow or tributary cola 0.48 mg N-NO3 =).
Table 6: PCA eigenvector matrix of the main limnological variables estimatedin Northwestern reservoirs
| Variables | e1 | e2 |
| pH | -0.25 | 0.22 |
| Conductivity | 0.05 | 0.17 |
| T°C | 0.20 | 0.14 |
| % DO | 0.33 | 0.14 |
| Turbidity | 0.15 | 0.39 |
| Secchi | -0.30 | 0.08 |
| NNO3 | 0.21 | -0.31 |
| P-PRS | 0.14 | 0.37 |
| Chl-a | -0.36 | 0.03 |
| Algal density | -0.05 | 0.38 |
| Diversity | 0.39 | -0.02 |
| Richness | 0.33 | 0.09 |
| Equitability | 0.36 | -0.06 |
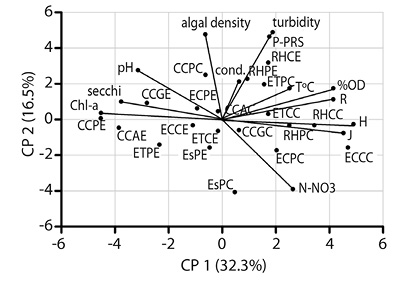
Figure 3 PCA of limnological features and phytoplankton descriptors in both hydrological phases on reservoirs of Upper Basin of Juramento and Sali-Dulce.
On the extreme negative end of the first component, the samples collected were distributed during the stage of minimum water flows as the longer water residence time, favoring an increased algal biomass, particularly in the CCP (CCP = 63.36 mg Chl-a/m3) and the Arias-Arenales River inflow (CCA = 54.62 mg Chl-a/m3). In general, a higher chlorophyll concentration was also found in other dams during that same stage, e.g. the EC (53.61 mg Chl-a.m-3), Es (51.32 mg Chl-a.m-3), and ET (25.58 mg Chl-a.m-3).
The second component accounted for 16.5 % of the total variance, with the most contributing parameters being theTP, turbidity and its total suspended solids, reactive soluble phosphorous (RSP) and algal density (Table 5). The separation of the site in this axis was mostly according to nutrients: toward the positive end. The RH is notable for its phosphorus level (TP = 0.77 mg/L; PRS = 0.44 mg/L) during dry periods when endogenous release of nutrients was higher with low-to-negative redox potentials. Turbidity in the Salí reservoir inflow during the dry periods was also higher (NTU 67.51) as a result of agroindustrial effluents during these periods, in accordance with lower transparency values (0.52 m). On the extreme negative end of the second component, floods in the EsP and the ECP are noted with higher average nitrate values (N-NO3= 0.51 and 0.49 mg/L, respectively).
Discussion
As the reservoirs exhibit an appropriate buffer capacity, acidification processes do not represent a problem at the moment. The opposite would be true due to mining and industry promotion and partly to wind-borne volcanic ashes. The lowest relative pH value was found in the Es during floods when decomposing plant material contributed with humic-fulvic substances as a result of the production of organic acids that slightly acidified the water (Salusso, 2005).
Nutrients were higher in the Salí-Dulce basin with the highest nitrate average found in the EC and the highest phosphorus average in the RH, as reported in previous papers during 1988-1992 (Tracanna et al., 1996). These values were mainly a result of the reception of citrus, alcohol and sugar industry effluents and wastewater discharges especially during July-August (Tracanna et al., 1999).
The location of the reservoirs within the basins had an impact on phytoplankton as the species diversity and richness were higher in the reservoirs (ET and RH) in the stretches of plains at the end of the systems. Both of these had the lowest relative depths and may have incorporated benthic species through resuspension in the water column, after thunderstorm events, fish bioturbation, or resuspension and activation of resistance states from sediments (Verspagen et al., 2014). In addition, the lateral connectivity provided by the tributaries allowed increased species richness (Tracanna et al., 1996, 1999; Salusso, 2005).
The multiple uses of the reservoirs, the anthropic impacts on the basins, and the lack of management programs have favored an artificial eutrophication resulting in loss of water quality and biodiversity (Salusso, 2005; Tracanna et al., 2014b). As for the hydrological cycle, intense rainfall during floods (summer and fall) decreased phytoplankton biomass, which is typical in Brazilian reservoirs (Tundisi & Matsumura-Tundisi, 2008) as well as increased diversity in rainy seasons and decreased diversity in dry seasons (Souza, 2014). The hydrometric level decreased due to the continued use of water in the reservoirs during the August-December period, with the subsequent elevation of pH, alkalinity, salt and nutrient concentration values during the dry season (Salusso & Moraña, 2000), which also affected other tropical water bodies (Barbosa-Chaves, Freitas-Lima, Carrhá-Leitao, Paulino, & Santaella, 2013).
In most reservoirs, cyanobacterial growth was induced by a permanent eutrophic condition, favoring scarce transparency and elevation of temperatures, nutrient concentrations (especially nitrogen and phosphorus), pH, alkalinity and water residence time (Salusso & Moraña, 2014a; Tracanna et al., 2014b). Dinophytes competing for nutrients may have been one of the reasons for the lack of cyanobacterial blooms at certain times in the Juramento reservoir (Salusso, 2010), as was the case for the Brazilian reservoirs (Barbosa et al., 2012; Moura & Henry Silva, 2015).
Higher Ceratium spp. biomass has been reported since 1999 in eutrophic tropical and sub-tropical waters (Nishimura, Meirinho, Moschini, & Pompeo, 2014). Dinoflagellate populations immobilized large quantities of nutrients and slowed down both the total activity of the ecosystem (Serruya, Edelstein, & Pollingher, 1980) and the competition for nutrients; this may have been one of the reasons for the lack of cyanobacterial blooms (Microcystis) in some Brazilian reservoirs and at certain times in the UJB.
The values for trophic variables in the reservoirs of Northwestern Argentina exhibited significant variations throughout the year and were dependent on the inflowing external loads of nutrients during the flood periods of the hydrological cycle, although most of them were categorized as eutrophic (Salusso & Moraña, 2014a). The resulting nutrient enrichment allowed the recruitment of new species and the increase in diversity, as documented in previous studies on these reservoirs.
Furthermore, studies at a wide geographical scale in the Northern hemisphere demonstrate a positive correlation between the surface area of lentic bodies and species richness, and a negative correlation between the surface area of lentic bodies and depth (Stomp, Huisman, Mittelbach, Litchman, & Klausmeier, 2011). In the five reservoirs studied, concordance was only found between species number and depth. Interestingly, the CC was the second largest surface area but exhibited the lowest species average. When the volume-to-surface ratio was linked to the number of species, the reservoirs with values > 20 had lower species richness.
Weather and climate conditions play a key role in the dynamics of these aquatic systems as changes in the hydrological cycle induce modifications of the main limnological variables which in turn modify the phytoplankton structure.
In a comparative study between sub-tropical Brazilian and Argentine reservoirs (Salusso & Moraña, 2014b), morphometric variables such as surface area, average depth and geographical location (latitude) were not decisive for algal biomass as the phytoplankton biomass was regionally regulated by the relative availability of nutrients (especially nitrogen) regardless of the water body distribution (altitude, substrate typology and relative anthropic pressure).
Although the reservoirs in Northwestern Argentina have different physical dimensions, feeding water flows, and human impacts, they are conditioned by the driving force of the hydrological cycle, with greater algal biomass during minimum water flows and greater diversity and equitability during floods.
The multiple uses of the reservoirs together with the different human impacts in their basins require sustainably managing the hydrometric levels and controlling eutrophication through programs to reduce diffuse nutrient loads and to treat residential and agroindustrial effluents, particularly in the Sali-Dulce basin.

