


 Spanish (pdf)
 Article in xml format
 Article references
 Send this article by e-mail
 Cited by SciELO
  Similars in
SciELO
Similars in
SciELO  uBio
uBio 
 Permalink
The Miridae (Hemiptera: Heteroptera) are one of the most species rich families of insects, with about 11 100 described species. They are found on all continents, except the Antarctic (Wheeler, 2001; Cassis & Schuh, 2012; Schuh, 2013), and are diverse especially in tropical and Mediterranean ecosystems (Cassis & Schuh, 2012).
Among the eight recognized subfamilies, Mirinae is the largest, comprising 419 genera in six tribes (Henry, 2009; Schuh, 2013). Endemism becomes evident at the tribal level and below. Mirines of the tribe Restheniini are found throughout America, with most of the diversity confined to the Neotropics (Wheeler, 2001; Cassis & Schuh, 2012). This aposematic colored tribe includes the largest known mirids (15 mm or more) (Schuh & Slater, 1995; Henry, 2009) and much of the work has been descriptive. Host plants are virtually unknown (Ferreira, Silva, & Coelho, 2001; Hernández & Henry, 2010; Wheeler & Bundy, 2012; Schuh, 2013). Prepops Reuter is the largest genus in Restheniini with 198 described species (Schuh, 2013; Coelho, Ferreira and Costa, 2012); the geographical range is similar to that of the tribe and research is also required about their host-plant relationships and habits (Ferreira et al., 2001; Wheeler, 2001; Hernández & Henry, 2010; Wheeler & Bundy, 2012; Schuh, 2013).
The study of the distribution and areas of endemism in Miridae is scarce (Wheeler, 2001); and available information is mostly focused on the study of particular regions or specific taxa (e.g. Schuh, 1974, Schuh 1984,Schuh1991,Schuh 2006; Ribes, 1984; Schuh & Stonedahl, 1986; Wheeler & Henry, 1992; Lu & Zheng, 1998; Williams, 2002; Forero & Schwartz, 2009; Hernández & Henry, 2010) without using quantitative methods for the biogeographical analysis. Until now, studies that mention the subfamily Mirinae are scarce (Williams, 2002; Cassis & Schuh, 2012), and do not treat the Restheniini.
Following Hovenkamp (1997), historical biogeography has two main goals: to reconstruct the distributional history of individual groups (taxon biogeography), and to reconstruct the history of areas of endemism or the history of Earth (the search for general area relationships). Areas of endemism are traditional units for historical biogeography (Crisci, Katinas, & Posadas, 2003) and many definitions have been proposed for it (e.g. Platnick, 1991; Harold & Mooi, 1994; Morrone, 1994; Humphries & Parenti, 1999; Szumik & Goloboff, 2004).
Identifying and delimiting these basic units of analysis are the fundamental steps, although the most problematical, in a historical biogeographic analysis. Several approaches have been proposed to achieve these aims but all have particular methodological problems (Crisci et al., 2003; Dos Santos, Fernández, Cuezzo, & Domíngues, 2008; Casagranda et al., 2009; Dos Santos, Cuezzo, Reynaga, & Domíngues, 2011; Torres-Miranda, Luna-Veja, & Oyama, 2013). Dos Santos et al. (2008, 2011) proposed to use network analysis based on sympatry inference as a first step in the search for areas of endemism. Biogeographic analysis typically focuses on sympatry patterns among species. Sympatric species lives in the same local community close enough to interact, and generally have broadly overlapping geographic distributions (Crisci et al., 2003). Dos Santos et al. (2008, 2011) proposed a new operational definition of sympatry: two or more species are sympatric when there are interpenetration and relative proximityamong their records. Coincidence of two or more species in the same locality is the maximum expression of these properties.
Network analysis has proven to be a powerful tool for studying different aspects of biological systems (Proulx, Promislow, & Phillips, 2005). The major difference between conventional distributional data and network data analysis is that the first focuses on areas and their attributes (species), whereas network data analysis focuses on species and their sympatric relationships (Dos Santos et al., 2008, 2011). So, species groups satisfying the requirement of within-group sympatry and between-group allopatry will conform to natural units of co-occurrence (UCs). A sympatry network may contain dense groups of species (UCs) connected through intermediary species. These dense groups will be evident after the intermediary species are removed. The spatial expression of the resulting UCs will be candidates for areas of endemism, with the species belonging to each UC strictly endemic. Additional information about these candidate areas of endemism can be gathered studying the phylogenetic relationships of the involved taxa or ecological variables of the points of occurrence (Humphries & Parenti, 1999;Dos Santos et al., 2008, 2011; Torres-Miranda et al., 2013).
The goal of this paper is to explore the diversity of the genus Prepops together with its spatial expression in order to identify areas of endemism and areas of high species richness in the Americas. Additionally, we used spatial data to propose habitat preferences and geoclimatic variables, important for each group of co-occurring species.
Material and methods
Compiling records: Each species of Prepops was assigned at least with one spatial point based on locality data associated with museum specimens and geographic records in the literature. When this information was absent, we used locality data compiled by Falling Rain Genomics, Inc. (www.fallingrain. com/world) and Google Earth (www.google. com/earth). All available geographic records (707) of Prepops species (180) were mapped with DIVA-GIS (Hijmans et al., 2004) using terrestrial ecoregions of the World by Olson et al. (2001). It was not possible to assign distributional records for 17 species due to extremely vague geographic information (e.g. "Amazon floden") thus, when referring to "total" numbers we mean 181 species. The list of records with their coordinates in decimal format is available upon request to the first author. This set of records was analyzed with Network Analysis Method (NAM, Dos Santos et al., 2008) with the modifications of Dos Santos et al. (2011).
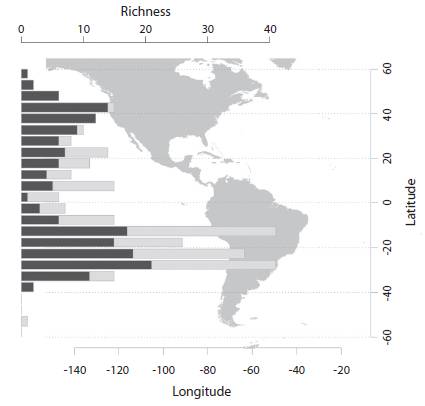
Species richness and latitudinal gradient:
The variation of the number of species and the extent of specific distributional ranges was studied by counting the frequency of species in consecutive belts of five degrees latitude each. This is shown as a barplot where the frequency of unique elements inside each strip was discriminated from the frequency of elements not endemic to it.
NAM analysis:
The Prepops distributional patterns were studied through NAM based in sympatric inference (Dos Santos et al., 2011). The NAM analysis was implemented using the software R ("R Development Core Team", 2011) through the package SyNet (Dos Santos, 2011) which is used for network analysis. NAM estimates the minimum spanning tree (MST) for each species and calculates the orthodromic distances (distances calculated over Earth surface), resulting in two matrices of special association. The inference instance yielded weighted matrices of spatial association between species, the ACSH matrix and the topological resemblance matrix. These weighted matrices were dichotomized using a threshold to generate a binary matrix corresponding to the basal network to be analyzed by NAM. NAM was oriented to identify groups of species that meet the requirement of within-group sympatry and between-group allopatry. These groups of species corresponded to UCs in a subnetwork. Then, the removal of intermediary species segregated the different UCs. The list of commands used is detailed in Appendix 1.
The resulting cohesive groups of species were analyzed under the framework of Major Habitat Type (MHT, names as defined by World Wildlife Fund, Olson, & Dinerstein, 2002) to explore probable habitat preferences of Prepops species. These MHT are broad ecoregions that: a) experience comparable climatic regimes; b) have similar vegetation structure; c) display similar spatial patterns of biodiversity; d) contain flora and fauna with similar guild structures and life histories; e) have similar minimum requirements and thresholds for maintaining certain biodiversity features; and f) have similar sensitivities to human disturbance.
Colorimetric maps were used to show the spatial expressions of the UCs. For generating these maps, we superimposed a rectangular net of points throughout the area and measured the distance between these imaginary points and the points of occurrence of the involved species. The intensity value corresponding to any sampling point is obtained through the summation of the species incidences on it. The larger is the gap between the species point set and the sampling point; the lower is the incidence of such species over the sampling point. This information is used to construct contour maps used to understand the geographic context of each UC in a continuous spatial scenario and recognize the distributional core of each UC.
Results
Species richness and latitudinal gradient
(Fig. 1): The majority of species (n= 105) is recorded from subtropical South America (between 10º and 30º S). Very low richness was found in the Equatorial zone (10º S to 10º N) and at high latitudes (>35º S and >50º N), with 34 and 41 species, respectively. Species endemic to a belt (5º wide) are more numerous South of 35º N, but almost absent in latitudinal belts of the USA and Canada. Neotropical species are substantially more numerous (155 spp., 86.1 %), than those in the Nearctic Region (19 spp., 10.6 %). Only 6 species (3.3 %) are shared by both realms.
Latitudinal distribution of the size of species ranges
(Fig. 2): Almost half of the species (43 %) are recorded only from the type locality or nearby areas (Fig. 2, dots without vertical lines); 93 % of the species are known from three or fewer collecting points. Some species show extremely large latitudinal ranges (some occurring in North and South America). As noted in figure 1, the mean ranges of Northern species (7.45º) are relatively larger than those of Southern species (3.13º, Wilcoxon test significantly different at p= 0.008). Even if species of small ranges (0.00º to 0.02º) are eliminated from the test of difference of means, Southern species show statistically smaller ranges than Northern species (p= 0.024). The number of species in the Equatorial belt (10ºS to 10º N) is similar to Northern species (10º N to the North), 34 (19 %) and 41 (23 %), respectively.
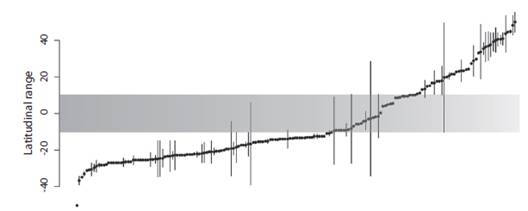
Fig. 2 Latitudinal distribution of the size of species ranges. Each dot represents the locality of a narrow distributed species and the dot with a line represents the center of the distribution range. The horizontal gray band highlights the Tropics.Species are ordered after mean latitude from S to N.
Network analysis:
NAM recognized 23 UCs (each with three or more maximally cohesive species) and two diads (each formed by 2 codistributed species) (Fig. 3, Fig. 4 and Fig. 5) after the removal of intermediary and isolated species (9 and 28 species, respectively). Each UC with its specific composition is presented in Table 1, geoclimatical attributes for each group is shown in Table 2, and main habitat types inhabited by them are presented in figure 6. All UCs and diads, discussed more in detail below, are candidates for areas of endemism supported by strictly endemic species of the genus Prepops.
Fig. 3 Units of co-occurrence and diads from North and Central America: x and y axes represent longitude and latitude, respectively. Colorimetric scale: the intensity value corresponds to species incidence at any sampling point in the continuous geographical range.
Fig. 4 Units of co-occurrence and diads from South America.species, forming a large Central Andean group. All these UCs are mainly from forests, except UC15 from xeric habitats.
TABLE 1 Groups of Prepops species cohesively connected through sympatry links (see Fig. 3, Fig. 4 and Fig. 5 for spatial expression)
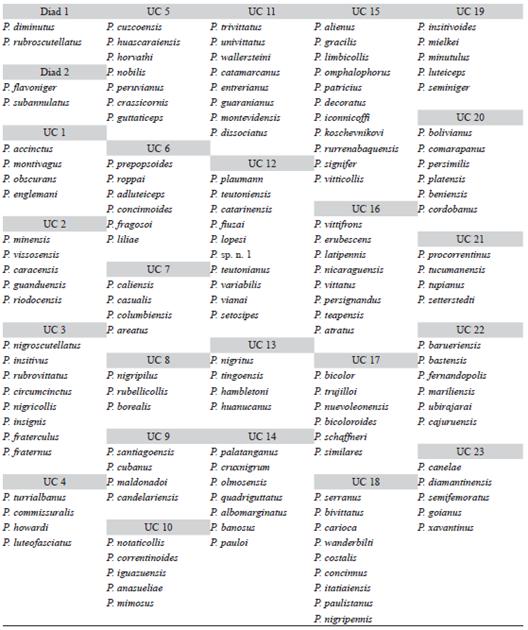
TABLE 2 Average profile of geoclimatic attributes calculated from the pooled set of records associated to each distributional pattern detected in the Prepops dataset
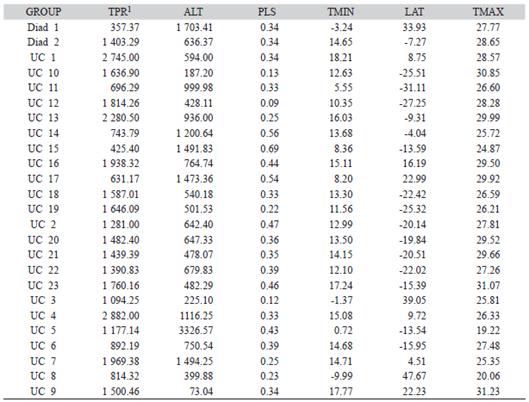
1TPR = total annual precipitation (mm); ALT = altitude (m.a.s.l.); PLS = pluviometric seasonality (adimensional); TMIN = 5th percentile of the average monthly minimum temperature (ºC); LAT = latitude in decimal format; TMAX = 95th percentile of the average monthly maximum temperature (ºC).
In the Nearctic Region we found a pair of Units of Co-occurrence (UC3 and UC8, Fig. 3) and 1 diad (diad 1, Fig. 3). UC3 (formed by 8 spp) is in Eastern North America. UC8, comprising 3 species, occupies a boreal belt, partially overlapping with UC3; both UCs are mainly associated with temperate broadleaf and mixed forests (Fig. 6). Diad1 (P. diminutus and P. rubroscutellatus), independent from other UCs, is distributed in xeric habitats from Western North America.
In Mexican, Central American and Caribbean zones we found five UCs (Fig. 3): 1) UC1 is composed of P. accinctus, P. montivagus, P. obscurans, and P. englemani, which inhabit the Isthmian Pacific and Atlantic Forests; 2) slightly Northeast and inhabiting the same ecoregions is UC4, which includes four species (P. turrialbanus, P. commissuralis, P. howardi, P. luteofasciatus). In spite of their spatial proximity and same habitat type (moist broadleaf forest), UC1 and UC4 are not connected by intermediary species, forming two independent units; 3) UC9 in the moist and dry forests of Cuba and Puerto Rico (also formed by 4 spp., see Table 1 for details); 4) UC16 (8 spp., Table 1), occupying a large area from Mexico to Central America and Cuba and partially overlapping with the other three previously mentioned UCs; and 5) UC17 (6 spp.) distributed from Mexico to Arizona. UC16 and UC17 are joined by an intermediary species (P. oaxacaenus), and both cover areas with forests (various types including moist, dry and coniferous).
In Northern South America (Fig. 4) we found the UC5 (7 spp.) in Cuzco (Peru), UC7 (4 spp.) in central Colombia; UC13 (4 spp.) around Huanuco (Peru); UC14 (7 spp.) near the Pacific coast from Ecuador to Peru, and UC15 (11 spp., partially overlapping with UC5) from Peru to Northern Bolivia. UC13, 14 and 15 are connected through intermediary
Farther South, from the Eastern slopes of the Andes (Fig. 4) toward the Atlantic forests in Central Brazil (Fig. 5), is a large "subtropical" group held together by intermediary species. This group comprises the following units of co-occurrence: UC12 (10 spp.) in a wide strip from NW Argentina to Atlantic forests in Brazil and including flooded grasslands (Fig. 5); UC11 (8 spp.) from grasslands in Central and N Argentina, Uruguay and S Bolivia (Fig. 4); UC21 (4 spp.) from NW Argentina to Brazilian coast in forest and grasslands (Fig. 4); UC20 (6 spp.) from Bolivia and Argentina and also from forests and grasslands (Fig. 4); UC19 (5 spp.) from NE Argentina to Brazilian coast (Fig. 5); UC18 (9 spp.) around Rio de Janeiro (Fig. 5); and UC10 (5 spp.) around Iguazu falls (Fig. 5). The last three UCs (19, 18 and 10) are mainly from forests. Finally, diad 2 (P. subannulatus and P. flavoniger) shows a vicariant range that includes locations in Yungas forests (NW Argentina), Paranaense forest, Cerrado (xeric), and much to the North, Venezuelan savanna (Fig. 4).
The superposition of two or more areas of endemism, indicating areas of high species richness and complex biotic scenarios, is evident in the Mexican Transition Zone, Cuba, Talamancan forests, Central Andes in Peru and NW Argentina, and Atlantic Forests.
Discussion
Even though Prepops is a speciose genus, little biological information is available, including habitat and host-plant preferences (Ferreira et al., 2001; Wheeler, 2001; Hernández & Henry, 2010; Wheeler & Bundy, 2012). Collections often consist of isolated individuals accidentally caught. The phylogenetic arrangement of the species has to be studied yet, which precludes any attempt to propose historical relationships among the areas of endemism found in the present study. Instead we analyzed for the first time the geographical patters in the genus Prepops, notably: 1) almost complete absence of the genus in the Austral region (Patagonia and Southern Andes); 2) higher richness in subtropical South America; 3) tropics with low specific diversity; 4) higher proportion of endemic species (belts 5º latitude) in South and Central America; 5) larger species ranges in North America.
The lack of records from the Andean region (except for P. nigrus in Southern Patagonia) and dominance of strictly Neotropical species (86 %), supports the hypothesis of a Neotropical origin for the tribe Restheniini (Cassis & Schuh, 2012).
The highest richness found in subtropical South America is in agreement with other taxa of Neotropical origin (e.g. Cabrera & Willink, 1973; Morrone, 2001), and perhaps is aided by the presence of mirid specialists in Southeast Brazil who have conducted taxonomic research on Prepops (e.g. Carvalho &Fontes, 1969a, Carvalho & Fontes, 1969b, Carvalho &Fontes, 1970a, Carvalho &Fontes, 1970b, Carvalho &Fontes, 1971a, Carvalho &Fontes, 1970b, Carvalho &Fontes, 1973; Carvalho, 1974, Carvalho 1988a,Carvalho 1988b; Fontes, 1989; Carvalho & Costa, 1991; Coelho et al., 2012). The lack of records in other Brazilian regions and other tropical countries can be probably attributed to lack of collections.
The higher proportion of endemics in South and Central America coupled with the larger species ranges found in North America might have a similar explanation. If the Restheniini have a Neotropical origin (Wheeler, 2001; Cassis & Schuh, 2012), it is to be expected a higher diversity in that area. If the Nearctic species are younger invaders, they might be predicted to exhibit a larger power of dispersion, and wider habitat preferences that would produce a reduced number of endemics having larger ranges (Wilson, Davies, & Thomas, 2010).
Biogeographic regions and subregions are widely accepted and highly supported areas of endemism (e.g. Humphries & Parenti, 1999). The general arrangement of the UCs of Prepops species shows a close correlation with those regions and subregions: 1) two UCs and one diad in the Nearctic region; 2) five UCs in Mexico and Central America (Mexican Transition Zone and Caribbean subregion, Morrone, 2001, Morrone2006, Fig. 3); 3) five UCs in the Northern portion of South America (including the SA Transition Zone and Amazonian subregion); and 4) ten UCs and 1 diad in part of the Amazonian, the Chacoan and Paranaense subregions (tropical and subtropical South America).
In the Nearctic, Western and Eastern biogeographic components are recognized in other taxonomic groups (Ortiz-Jaureguizar & Cladera, 2006; Heads, 2012; Molineri & Salles, 2013). UC3 forms a clear Eastern group, while diad 1 represents a SW group.
The Mexican Transition Zone, a geobiotic complex area was intensively studied biogeographically (e.g. Halffter, 1987; Morrone, Espinosa, Aguilar, & Llorente, 1999). Our UC17 closely resembles this area, and is connected to UC16 by an intermediary species, forming a larger group more or less coincident with the Caribbean subregion of the Neotropical region (Morrone, 2001). Also in this area, two UCs (UC1 and UC4) representing smaller areas confirm the high diversity and "border" signature of the region as found, for example, by Halffter (1987) and Torres-Miranda et al. (2013). The identity of the Cuban-Puerto Rican biota (our UC9) was also recovered in other studies (Crother & Guyer, 1996; Morrone, 2001).
UC11, restricted to dry forests and savannas from Argentina and Uruguay, forms an arched pattern of points resembling other findings (pleistocene arch, Prado, 2000). UC20 also forms a similar arch, but extends more to the North in Bolivia and Southern Brazil.
UC21 and diad 2 are interesting because, as large subtropical groups, they include records from the Chacoan (Chaco, Caatinga and Cerrado) and the Paranaense subregions, together with records from the NW Argentinean area (Yungas province of the Amazonian subregion and South American Transition zone) but not from other Amazonian provinces. Furthermore, diad 2 shows additional records in Northern Venezuela (Caribbean subregion), forming an uncommon vicariant pattern that should be explored with other taxa.
UC10, UC19 and UC18 occupy different areas of the Atlantic forests of the Paranaense subregion, a highly endemic area recognized by numerous biotic groups (Morrone, 2001; Heads, 2012; Molineri & Salles, 2013). UC12 also conforms to this pattern except that some records are from dry forests of the Chacoan subregion in NW Argentina.

