


Services on Demand
Journal
Article
 English (pdf)
 Article in xml format
 Article references
 Send this article by e-mail
Indicators
-
 Cited by SciELO
 -
 Access statistics
Related links
-
 Similars in
SciELO
Similars in
SciELO  uBio
uBio
Share

 Permalink
Revista de Biología Tropical
On-line version ISSN 0034-7744Print version ISSN 0034-7744
Rev. biol. trop vol.58 n.1 San José Mar. 2010
Morphometric and molecular differentiation between quetzal subspecies of Pharomachrus mocinno (Trogoniformes: Trogonidae)
1. UBIPRO, FES Iztacala, Universidad Nacional Autónoma de México (UNAM). Av. Barrios No. 1. Los Reyes Iztacala, Tlalnepantla, Estado de México, 54090, México; solorzanols@campus.iztacala.unam.mx
2. Centro de Investigaciones en Ecosistemas, UNAM. Ant. Carr. A Pátzcuaro 8701. Col. ExHda. De San José de la Huerta. Morelia, Michoacán, 58190, México; akoyama@oikos.unam.mx
Abstract: The resplendent Quetzal (Pharomachrus mocinno) is an endemic Mesoamerican bird species of conservation concern. Within this species, the subspecies P. m. costaricensis and P. m. mocinno, have been recognized by apparent morphometric differences; however, presently there is no sufficient data for confirmation. We analyzed eight morphometric attributes of the body from 41 quetzals: body length, tarsus and cord wing, as well as the length, wide and depth of the bill, body weight; and in the case of the males, the length of the long upper-tail cover feathers. We used multivariate analyses to discriminate morphometric differences between subspecies and contrasted each morphometric attribute between and within subspecies with paired non-parametric Wilcoxon test. In order to review the intraspecific taxonomic status of this bird, we added phylogenetic analysis, and genetic divergence and differentiation based on nucleotide variations in four sequences of mtDNA. The nucleotide variation was estimated in control region, subunit NDH6, and tRNAGlu and tRNAPhe in 26 quetzals from eight localities distributed in five countries. We estimated the genetic divergence and differentiation between subspecies according to a mutation-drift equilibrium model. We obtained the best mutation nucleotide model following the procedure implemented in model test program. We constructed the phylogenetic relationships between subspecies by maximum parsimony and maximum likelihood using PAUP, as well as with Bayesian statistics. The multivariate analyses showed two different morphometric groups, and individuals clustered according to the subspecies that they belong. The paired comparisons between subspecies showed strong differences in most of the attributes analyzed. Along the four mtDNA sequences, we identified 32 nucleotide positions that have a particular nucleotide according to the quetzals subspecies. The genetic divergence and the differentiation was strong and markedly showed two groups within P. mocinno that corresponded to the quetzals subspecies. The model selected for our data was TVM+G. The three phylogenetic methods here used recovered two clear monophyletic clades corresponding to each subspecies, and evidenced a significant and true partition of P. mocinno species into two different genetic, morphometric and ecologic groups. Additionally, according to our calculations, the gene flow between subspecies is interrupted at least from three million years ago. Thus we propose that P. mocinno be divided in two independent species: P. mocinno (Northern species, from Mexico to Nicaragua) and in P. costaricensis (Southern species, Costa Rica and Panama). This new taxonomic classification of the quetzal subspecies allows us to get well conservation achievements because the evaluation about the kind and magnitude of the threats could be more precise. Rev. Biol. Trop. 58 (1): 357-371. Epub 2010 March 01.
Key words: phylogenetic trees, Mesoamerica, mitochondrial DNA, morphometry, quetzals.
The Resplendent Quetzal (Pharomachrus mocinno) is a bird listed at global level in the Near Threatened category (IUCN 2009). It ranges from Southern Mexico through Guatemala, El Salvador, Nicaragua, Honduras, Costa Rica and Western Panama. However, this distribution is not continuous; there is an insular distribution pattern in the remnantisolated cloud forests along these seven countries (Solórzano et al. 2003). Within the current species P. mocinno, there are two subspecies, P. m. mocinno and P. m. costaricensis, which were proposed according to apparent morphometric differences. The Mexican naturalist Pablo de la Llave named the first quetzal specimens collected in Guatemala in 1832 as species Pharomachrus mocinno. Later, in 1869, the German ornithologist Jean Louis Cabanis classified the specimens of quetzals collected in Costa Rica as subspecies P. m. costaricensis, considering that males of this country were smaller than the Guatemalan specimens. Subsequently, ornithologists of the 20th century following this naming mode into the subspecies P. m. mocinno, which includes the populations of Mexico, Guatemala, Honduras, El Salvador and Nicaragua, and the subspecies P. m. costaricensis, which includes quetzal populations of Costa Rica and Panama (Sibley & Monroe 1990). However, presently detailed studies have not been carried out to confirm real morphometric differences between these subspecies. The morphometric analyses have been widely used to resolve taxonomic uncertain or to support such type of questions, both in plants as in animals (ie. Beolchini & Corti 2004, Kynd et al. 2005, Leth 2005). Here, we used this focus, together with genetic data, in order to elucidate a potential differentiation within P. mocinno.
Recently, were found strong genetic differences in a short sequence (255 bp) of the control region of mtDNA, which we interpreted as evidence of a historical isolation that shaped two genetic groups within P. mocinno (Solórzano et al. 2004). These two monophyletic groups were named evolutionary significant units (ESUs). These ESUs clustered individuals according to the traditional division of quetzal into two subspecies, suggesting that further analysis is necessary within P. mocinno.
In addition, telemetry studies (Powell & Bjork 1994) showed that quetzals from Costa Rica (P. m. costaricensis) do not migrate to Nicaraguan localities (P. m. mocinno), implicating an interrupted current gene flow between the quetzal subspecies. It is probably, that the Nicaragua Lake (~8000 km2), and the extensive lowland region close to the frontiers between Costa Rica and Nicaragua are operating as geographic barriers.
According to genetic analysis, this isolation is of historic origin (Solórzano et al. 2004). However, apparently this isolations has not bring out differences in breeding behavior and life cycle. For example, during the fieldwork of this study we used voices of tape-records from Costa Rica (P. m. costaricensis) to attract quetzals, that were recognized by quetzals of both subspecies. Additionally, the telemetry studies carried out in Costa Rica (Powell & Bjork 1994) and Mexico (Solórzano 1995) showed that P. mocinno has very similar reproductive cycle. This is divided into breeding season (January to June) and migratory season (July to December-early January) (Solórzano 2010). However, in some years, the breeding season begins until April and it finishes in August (Skutch 1944). According to the literature information the breeding behavior, chicks care, reproductive season and feeding source (ie. Skutch 1944, LaBastille et al. 1972, Wheelwright 1983, Ávila et al. 1996, Solórzano et al. 2000) are very similar in both subspecies. Additionally, the radio-tagged quetzals trapped in Mexico, showed that males and females established one single pair that was maintained in the following three breeding seasons. This result suggested that P. mocinno could be a monogamous species and probably maintain the same pair during its whole life cycle.
In quetzals the sexual dimorphism is evident in adults (Sibley & Monroe 1990) but not in the juveniles stages because they are very similar in feather coloration, and practically they can only be distinguished by bill color (yellow in males and dark-brownish in females) (Howell & Webb 1995). Hence, the few available data suggest that both subspecies exhibit very similar reproductive life cycle and breeding behavior and probably the apparent morphometric differences between subspecies still are not significant. Additionally, the strong differences found between subspecies in the hypervariable mtDNA control region (Solórzano et al. 2004), are not expected to be find in other more conserved sequences as tRNAs and protein subunits. Hence, in the present study, we analyzed the morphometric variation in eight morphometric attributes of quetzals, and in the case of males, we summed the morphometric variation in the long-cover feathers. In addition, we analyzed the genetic variation in four sequences of mtDNA in order to assess the intraspecific differentiation within P. mocinno, in order to elucidate the taxonomic classification of the subspecies.
Material and methods
Study sites: The Resplendent Quetzal is endemic to Mesoamerican cloud forests (Wege & Long 1995) thus our study sites were located in Mexico and Central America. All trapped individuals were ringed to avoid re-sampling. Most of quetzals were caught from its nests so they were different individuals, but the relatedness level among them still unknown. We added the blood sample of one male of unknown origin since it was recuperated from a species dealer. This dealer told to the Mexican authorities that this male was from Guatemala. However, a recent genetic analysis clustered this quetzal with other ones from Mexico (Solórzano et al. 2009). Seven of sampled localities corresponded to the Northern populations (P. m. mocinno): Northern Mountains (NM-Mex: 16°12’N, 93°08’W, N=1 sample), Sierra Madre 1 (SM1-Mex: 16°10’N, 93°36’W, N=8), and Sierra Madre 2 (SM2-Mex: 15°09’N, 92°30’W, N=1) in Mexico; Sierra de las Minas Biosphere Reserve (SM-Gua: 15°02’N, 89°59’W; N=3) and Biotopo Quetzal (BQ-Gua: 15°11’N, 90°12’W, N=1) in Guatemala; National Park Montecristo in Salvador (PM-Sal: 14°23’N, 89°22’W, N=1); and National Park Arenal in Nicaragua (PA-Nic: 13°02’N, 85°50’W, N=1). The Southern population (P. m. costaricensis) was represented by the Bajo Grande locality in Panama (BG-Pan: 08°51’N, 82°30’W, N=9). These localities represent all range distribution of quetzals excepting Honduras and Costa Rica. The tissue samples of outgroup are from Ecuador (vouchers 5732 and 5485 of P. pavoninus) were facilitated by Academy of Natural Sciences of Philadelphia, USA.
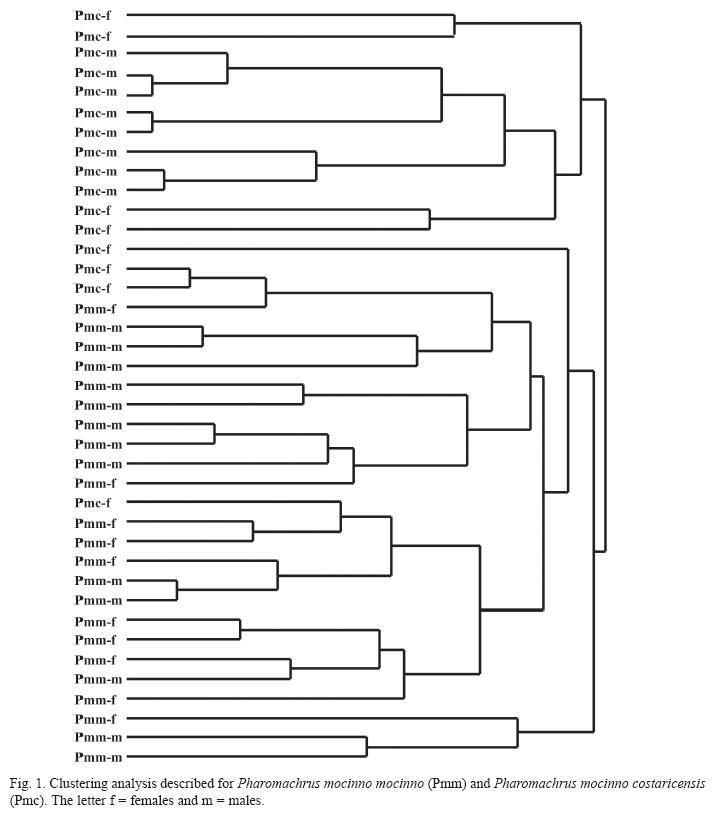
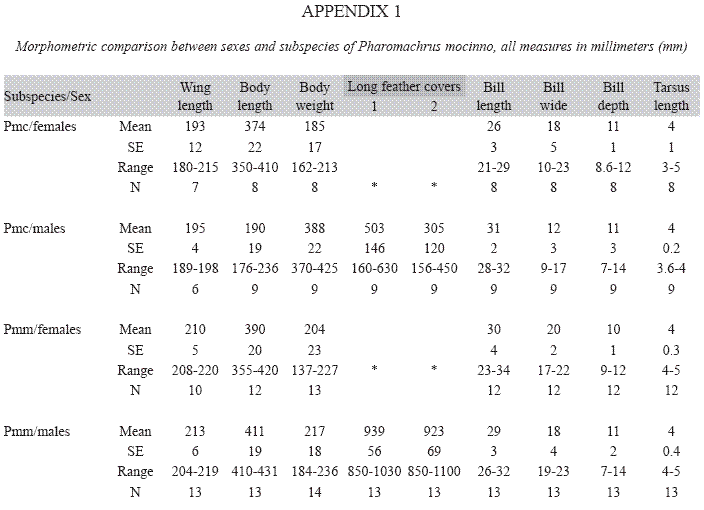
Morphometric analysis: Morphometry analyses find similarities among taxa based on phenetic attributes (continuous characters) in order to determine its relationships (Stuessy 1990). Here, we carried out a morphometry analysis only in adult quetzals,17 quetzals caught during the blood sample collection were adults of P. m. mocinno and nine of P. m. costaricensis. These adult individuals were sexed, weighed using a spring scale and the right wing cord was measured with a wing rule. The length of the body (measured from the beak to the end of the tail) and the long cover feathers of adult males were measured with a tape measure, the tarsus length, and the length, wide and depth of the bill were measured with a digital vernier caliper. In addition, in our morphometric analysis we integrated for P. m. mocinno data from nine individuals caught in 1991-1992 in a telemetry project conducted at El Triunfo Biosphere Reserve. For P. m. costaricensis we added to our analysis measurements (excepting body weight and wing lenght) of 6 other specimens available in museums. The statistical morphometric analyses were carried out with JMP V 8.0.1 (SAS 2009). All data were adjusted to normality distribution through its natural logarithm. A canonical linear test based on variances was used to discriminate differences between subspecies. Additionally, we generated a hierarchical clustering averaging the values of all morphometric data excepting long cover feathers only present in males. We obtained paired comparisons both within as between subspecies with the non-parametric Wilcoxon test given the small sample size (Sokal & Rohlf 2002).
Blood sample collection: For genetic analysis, we used 26 blood samples (25 samples from trapped quetzals and one of a male of unknown origin) obtained during the breeding seasons of 2000 and 2001. We collected 25 blood samples from eight breeding localities in five countries during the breeding season to guarantee the geographic origin of quetzals. These blood samples were collected from the major brachial wing vein (instead of muscular or liver tissue) to avoid killing individuals of this threatened species. After the blood samples were taken, all individuals were released close to the point where they had been caught. The samples were stored at ambient temperature in buffer solution (Hillis et al. 1996), and transported to the laboratory for long-term storage at -70°C.
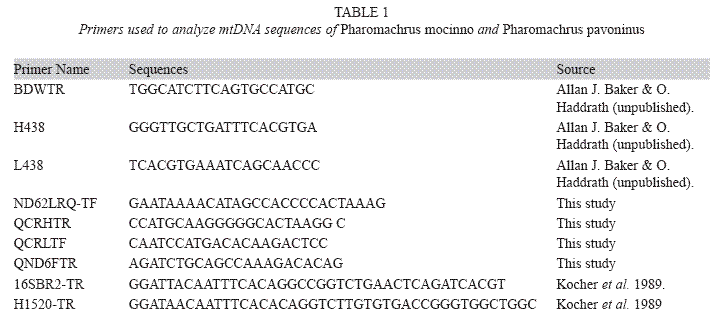
DNA extraction, PCR amplification and sequencing: Total genomic DNA was isolated from blood using standard protocols of proteinase K-SDS digestion and phenol-chloroform extraction, and the DNA was precipitated with ethanol (Sambrook et al. 1989). We used both non-specific as well as specific quetzal primers to amplify NDH6, tRNAGlu, tRNAPhe and complete control region of mtDNA (Table 1). We carried out standard PCR to amplify DNA segments up 2kbp. These PCR reactions contained 0.1μM each primer, 100μM each dNTP, 2.0mM MgCl2, 10mM Tris-HCl pH 8.3, 50mM KCl, 5 units TaqPol (Boehringer, Mannheim) and 1μL (~ 100ng) of total genomic DNA. Sequencing reactions were performed with the ThermoSequenase fluorescent DYEnamic direct cycle sequencing kit (Amersham Biosciences, Chalfont St. Giles, UK) and the products were run in polyacrylamide–urea gels using the LICOR 4200L automated DNA sequencer (LICOR, Lincoln, Nebr.). Because both strands were read simultaneously in the two directions, we obtained two overlapping 1000bp sequences that permitted immediate confirmation of reads. The sequencing results of control region of 10 individuals showed noisy peaks that suggested more than one nucleotide in the same position. To confirm that these double peaks were not technical artifacts, we repeated these samples using labeled 33P-ddNTPs (manual sequencing) and we obtained the same results. Therefore, we designed long-template amplifications and cloning experiments to analyze the following possibilities: 1) the control region has a copy within a single mitochondrion (partial or complete control region), 2) single individuals have mitochondria with different sequences (heteroplasmy), and 3) quetzals have pseudogenes (nuclear copies of partial or complete control region mtDNA). The long-template PCR amplified DNA segments between 10kbp to 15kbp and were conducted using an Accutaq kit LA DNA Polymerase mix according to the manufacturer’s recommendations (Sigma, St. Louis, Missouri). These PCR reactions contained 40pM each primer, 500μM dNTPs, PCR buffer 3 (50μM Tris-HCl pH 9.2, 16mM (NH4)SO4, 2.25mM MgCl2, 2% DMSO), 0.5U AccuTaq LA DNA Polymerase enzyme mix and 40ng/μL total genomic DNA. For long amplifications, we used primers designed for other bird species (Table 1). The annealing temperatures were changed from 50-62°C according to Tm of each primer. For cloning experiments, we used a kit (pCR® 2.1 Vector kit, Invitrogen).
The sequences were aligned by eye and further improved with Clustal X (Thompson et al. 1997). The genetic diversity was estimated as nucleotide diversity (π) within each subspecies using Arlequin 3.01 (Excoffier 2006). The genetic divergence between subspecies was estimated as net distance of Nei (1987) based on complete control region sequence, and separately with NADH6, tRNAGlu and tRNAPhe, as well as joining all these sequences using the DnaSP 4.0 program (Rozas et al. 2005). In addition, we estimated the divergence (Ð) based on a drift model (Reynolds et al. 1983), as well as the pairwise differences within and among subspecies using MEGA 3.1 (Kumar et al. 2004). These pairwise differences were correlated with geographic distance using a Mantel test (Liedloff 1999).
We estimate the genetic differentiation index (FST) between subspecies assuming that mutation is the main evolutionary force explaining the current differentiation within a certain lineage (neutral evolution). We estimated the historical gene flow (Nm) using control region data with the method based on Monte Carlo chain that estimates the migration rate and the time since the two populations diverged from a common ancestral population (TMRCA) (Nielsen & Wakeley 2001).
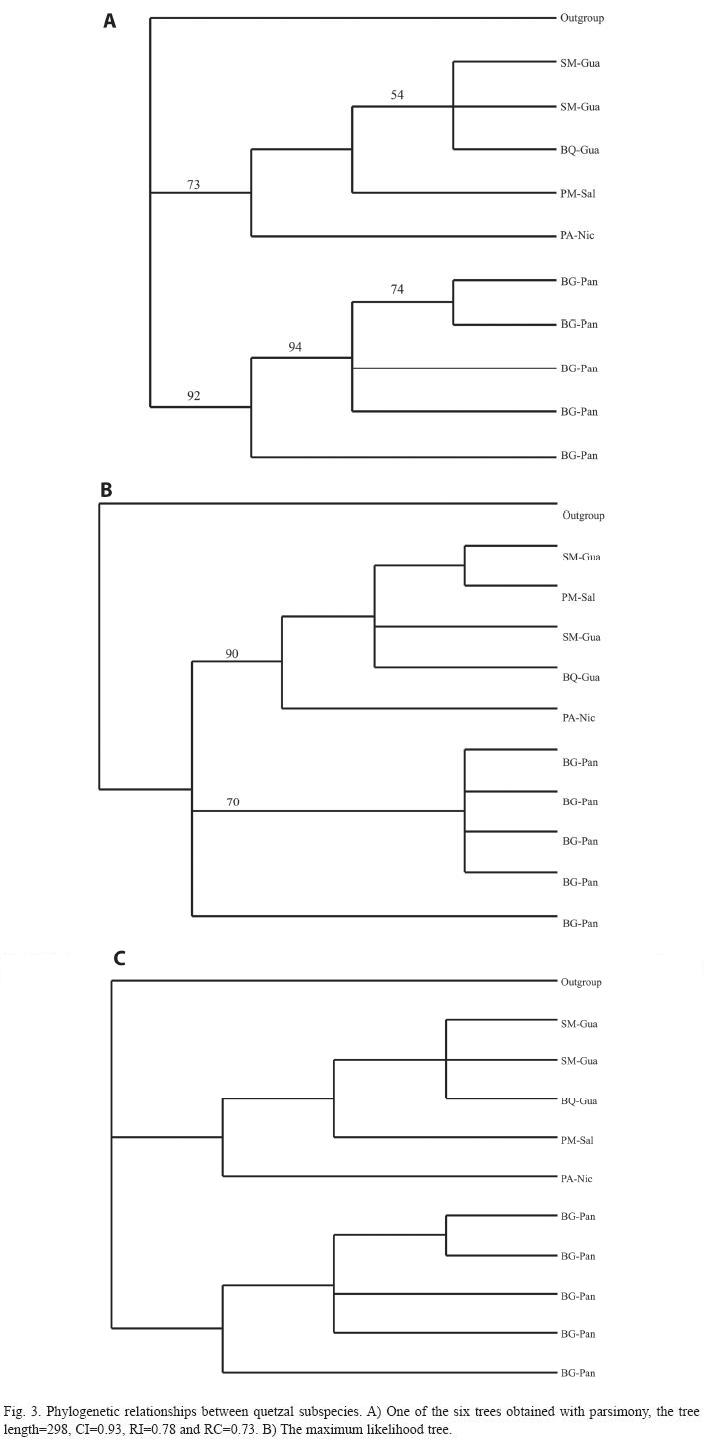
The phylogenetic analyses were conduced using the available 600bp of control region of P. pavoninus of outgroup and the 10 different haplotypes found in 26 quetzals. We estimated the best evolutionary nucleotide model with ModelTest V. 3.8 (Posada 2006), the parameters obtained from this model were used in further phylogenetic analyses to construct the phylogenetic tree. The phylogenetic trees were constructed using maximum parsimony and maximum likelihood and its robustness calculated with a bootstrap analysis was carried out with PAUP V.4.10 software (Swofford 2002). Additionally a phylogenetic tree was obtained with Bayesian statistics using MrBayes program (Huelsenbeck & Ronquist 2003) with 2.5 106 generations ran.
Results
Morphometric differences: The linear canonical analysis discriminated two morphometric groups that corresponded to the two quetzal subspecies (Wilki’s λ=0.22, P=0.001). The hierarchical clustering described a branching pattern according to the subspecies correspondence of the individuals and only a single female of P. m. costaricensis is found among the branches of P. m. mocinno (Fig. 1). The comparison of females and males irrespective of its subspecies origin found only a difference in the bill of males that is longer (X=3.44±0.02 SE; Z=-4.16, P=0.0001) than the bill of females (X=3.29±0.03). The paired comparisons between subspecies found significant morphometric differences between Northern (P. m. mocinno) and Southern (P. m. costaricensis) subspecies. The individuals from Northern populations have wings longer (Z=-4.15, P=0.03), are heavier (Z=-4.51, P=0.0001), have a wider bill (Z=-3.39, P=0.0007) and a more depth bill (Z=-2.04, P=0.04) than those from the southern populations. The tarsus is marginally longer in P. m. mocinno (Z=1.83, P=0.058) than in P. m. costaricensis (Appendix 1). In addition, males of P. m. mocinno have longer cover feathers than those of P. m. costaricensis: the longest feather (Z=-3.7, P=0.0002) and the second one (Z=-2.6, P=0.01) are longer in P. m. mocinno than in P.m. costaricensis (Appendix 1). Within P. m. costaricensis the males and females have differences in the length (Z=3.32, P=0.0009) and in the wide of the bill (Z=-2.5, P=0.01). Within P. m. mocinno we found differences in the bill of females and males (length Z=-2- 32, P=0.02; wide Z=-2.32, P=0.02; and depth Z=-2.8, P=0.006) (Appendix 1).
Genetic differences: The long template amplifications and cloning experiments showed that both subspecies of P. mocinno were heteroplasmic in the control region. Of the 26 quetzals analyzed, 11 did not show heteroplasmy, which served to describe the complete control region. The other three sequences (NDH6, tRNAGlu and tRNAPhe) did not show heteroplasmy in any quetzal.
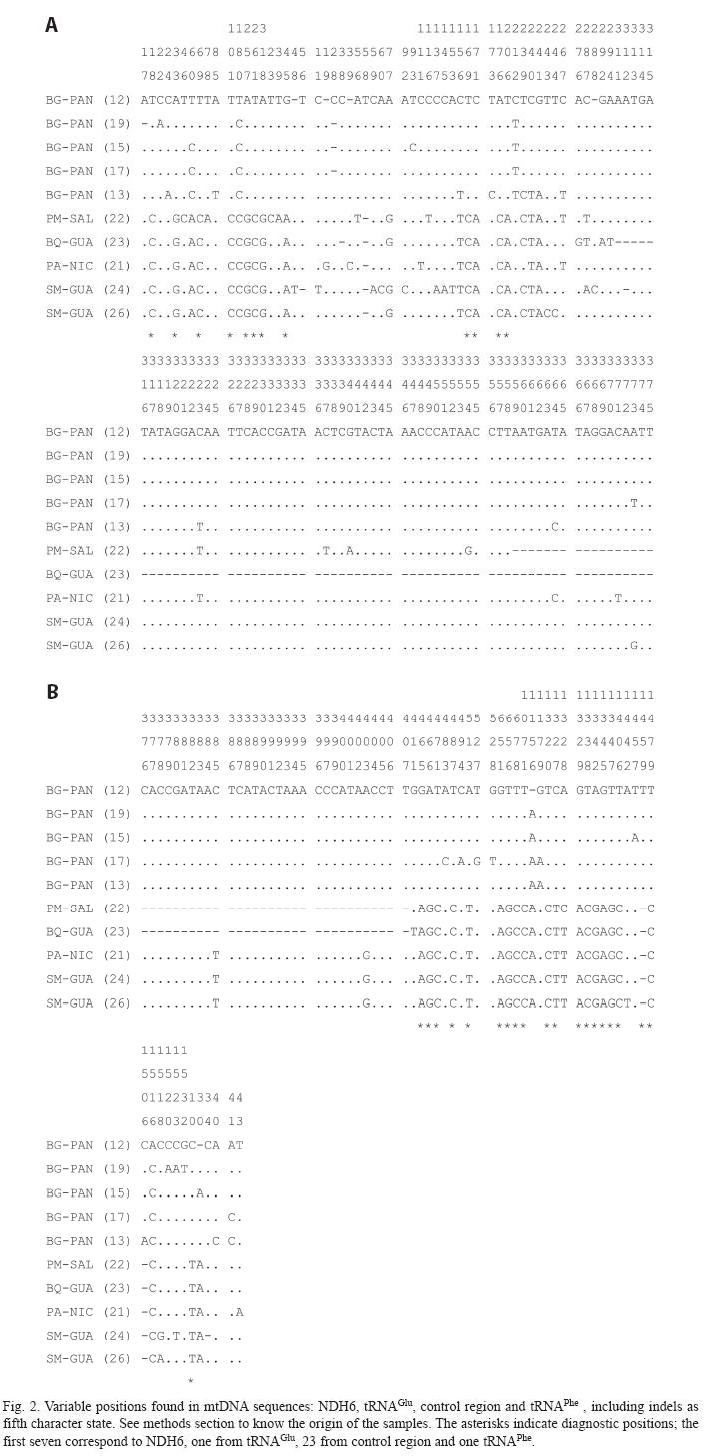
The four sequences (5’-NDH6, tRNAGlu, control region and tRNAPhe-3’) have 2016 aligned characters, including 200 polymorphic positions (Fig. 2). Two individuals have a long deletion in control region (a female from El Salvador with a deletion of 48bp, and a male from Guatemala with a deletion of 96bp, which we identified as VNTRs). If these two samples are eliminated from analysis, the number of segregated sites is reduced to 102. Notably, we found 32 distinct nucleotide positions (seven variable sites in NDH6, one in tRNAGlu, 23 in control region and one in tRNAPhe) associated with specific Northern or Southern origin of individuals, thus these sites are referred here as diagnostic sites (Fig. 2). According to the variable sites found in NDH6 and tRNAs there are only two genetic groups corresponding each one to the subspecies (trees not showed here).
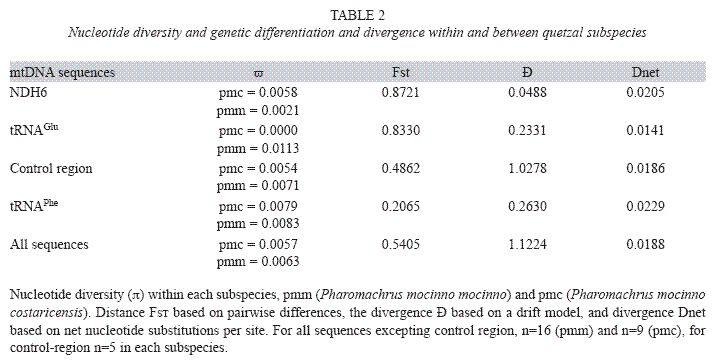
Based on the four sequences, we found that the nucleotide diversity of quetzals varied across mtDNA, and the lowest values were observed in the subspecies P. m. costaricensis (Table 2). The genetic comparisons between subspecies showed interesting results; in particular, the genetic differentiation (FST, Table 2) between NDH6 and tRNAGlu was very high (Table 2). The genetic divergence expressed as net distance of Nei was approximately 2% (Table 2) analyzing both as separated sequences as one joined sequence. In contrast, the divergence based on a drift model ranged from approximately 5% to 112% (Table 2). The pairwise distances were lower within subspecies (4.2 to 4.8 in P. m. costaricensis and from 3.4 to 6.3 in P. m. mocinno,) than between subspecies (7 to 9), reflecting a strong genetic differentiation. The correlation analysis between these distances and geographical distances confirmed a gene flow pattern according to an isolation by distance model (R2=0.78, P=0.002).
The appropriate evolutionary nucleotide model selected was TVM + G according to Akaike criterion. The parameters estimated were the equilibrium nucleotide frequencies for A=0.32, C=0.26, G=0.15 and T=0.25. The lnL=1919.63, AIC=3893.26, nst=6 and gamma distribution shape parameter=0.859.
The phylogenetic trees constructed by maximum parsimony (Fig. 3A), maximum likelihood (Fig. 3B), and with Bayesian statistic (Fig. 3C) showed a very similar topology. These trees recovered two monophyletic groups that correspond to each subspecies. Additionally, the Monte Carlo results showed that the historical gene flow between quetzal subspecies was interrupted at least three million years ago and TMRCA estimated a gene interruption of three to six million years ago.
Discussion
The current distribution of quetzals shows a geographic isolation between Northern and Southern subspecies. The telemetry studies conduced in Costa Rica (Southern populations) did not document migratory events to the closest Northern populations (Nicaraguan populations) (Powell & Bjork 1994). On the other side, our results indicated a genetic isolation and restricted gene flow Northern and Southern subspecies as well, occurred at least three million years ago. The evolutionary consequences of such isolation have allowed the current significant genetic and morphometric differences here documented between quetzal subspecies. Although some morphometric variables as body weight and length body could be strongly affected by environmental conditions, they showed a differentiation between subspecies (see Results section and Appendix 1).
The evolutionary biology does not recognize an evolutionary significance of subspecies (Ball & Avise 1992), in conservation practice the subspecies are operationally useful to identify areas or populations at intraspecific level (Cracraft 1983, Ball & Avise 1992, Primack 1998) with specific conservation concerns. Particularly, when the evolutionary value of subspecies is demonstrated, for example if they are identified as ESU (Moritz 1994), as was already showed for quetzals (Solórzano et al. 2004). The results of the present study confirmed a strong morphometric and genetic partition of P. mocinno into two groups. Based on our results we propose that quetzal subspecies be considered as two independent species, given the current allopatric distribution of subspecies with current gene flow interrupted, the strong genetic differentiation and the clear divergence, the phylogenetic and the morphometric separation. Thus, the current P. m. mocinno be P. mocinno species and P. m. costaricensis be P. costaricensis. This taxonomic division will bring out benefits in conservation of this species since the magnitude and kind of threats differ along the distribution of quetzals in Mesoamerica.
To support this new quetzal taxonomic classification, we must consider that presently there is no agreement on the magnitude of genetic distance or other criteria to establish the boundaries between species (Frankham et al. 2002, Helbig et al. 2002, Sites & Marshall 2003). However, in most cases the genetic distances are between 2 to 4% in well-established species. For example, genetic distances in macaques varied from 2 to 10%; in Catharus birds, ranged from 1 to 2.8%; and in Anolis lizards, varied from 0.4 to 6.5% (Frankham et al. 2002). In closely related species, Johns & Avise (1998) proposed that a divergence of approximately 2% can be found using cytochrome b of mtDNA. These values of genetic distances reported for various vertebrate species are similar to those found between quetzal subspecies (Table 2). Recent data based on sequence divergence obtained by Hebert et al. (2003a) found that the divergence among higher taxonomic groups varied from 0.0 to 53.7% based on cytochrome oxidase I subunit of mtDNA. Hebert et al. (2003b) proposed that, considering a standard mutation rate of 2% per million years in vertebrates, a 2% divergence among closest species is expected.
Thus, if we take a 600bp sequence, this potentially could have 12 diagnostic nucleotide differences due to reproductive isolation. In our study, the mtDNA sequences showed 32 nucleotide positions (Fig. 2), this result corresponds to the number expected from Herbert’s proposed mutation model. The isolation time estimated to have 32 variable positions requires approximately at least a period of three million years that coincides with the TMRCA. Additional to the genetic differentiation we found a strong genetic divergence between quetzals subspecies.
The genetic divergence (close to 2%) between quetzal subspecies (Table 2) is similar to that described for other independent species (Frankham et al. 2002). The divergence estimated with a drift model showed relatively high values (Table 2). In addition, we found significant differentiation found between subspecies. The high Fst values could have originated from many diverse factors such as genetic drift, differential mutation rates and selective forces, as well as geographical isolation. The coalescence theory establishes that the high values of Fst index may be explained if we assume a mutation process involving exclusively as evolutionary force occurring in allopatric populations separated by at least 4N generations (Avise 2000). In this context, the genetic differentiation found between quetzals subspecies supports a genetic isolation larger than 4N generations.
These genetic differences between subspecies are supported by the phylogenetic analyses. The individuals of each subspecies are separated in two principal monophyletic clades (Fig. 3). Thus all results here obtained indicated that within P. mocinno there are two different genetic clades, corresponding to each subspecies, which we stressed out as two independent species. Additionally, it is important to consider that the genetic flow interrupted means a historical reproductive isolation of quetzal subspecies. However, apparently this genetic isolation has not bring out differences in cycle life and reproductive behavior or periods, since the few available data indicate, but considering that this isolation continues the intrinsic demographic, evolutionary and genetic processes it is probably that occurs a strongest differentiation. In addition, the genetic isolation in the case of quetzal subspecies means a reproductive isolation, thus the genetic and morphometric differences already present in these subspecies could not be reverted.
Implications for conservation: According to our molecular and morphometric data, we suggest that P. mocinno be separated into two independent species: P. mocinno and P. costaricensis. We recognize that quetzals and its allies require more detailed taxonomic study in order to give more strength to our proposal. However, it is relevant to mention the sample size here used, which could be perceived as very low, but even in this sample size strong differences were found in quetzal, such results can not been explained by random processes.
This taxonomic decision is fundamental in conservation issues. At global level, P. mocinno is classified as a species in Near Threatened (IUCN 2009). Both current subspecies are exposed to loss and habitat degradation, but apparently the rate of loss is more severe for P. m. mocinno (Solórzano et al. 2003) than for P. m. costaricensis, therefore the conservation concerns could be more astringents for Northern species (P. mocinno) than for P. costaricensis.
Acknowledgments
Thanks to B. Granados and M. Grosselet for field assistance and O. Haddrath for help in laboratory work. Allan J. Baker, ROM, Ca, partially supported the genetic analysis. Thanks to NGO and Governmental Ministries of Guatemala, Nicaragua, El Salvador, Mexico and Panama that kindly supported the permissions to conduct fieldwork. The CITES authorizations 13788, 13569, 08-2001 and 05312 were obtained for this study. The tissue samples of outgroup were facilitated by Academy of Natural Sciences of Philadelphia, USA. We enriched the morphometry data with museum vouchers from ROM, CNAV and alive quetzals of ZOOMAT. R. McCauley, RBT editor and two anonymous reviewers suggested important comments to improve the quality of this manuscript. M. Ventura (FC-UNAM) helps us to carry out the phylogenetic analyses. SS was granted by WWF- PCBM (Project PT37); Idea Wild; AMNH, New York; Posgrado Ciencias- Biomédicas, UNAM; and CONACyT (93860).
Resumen
El Quetzal (Pharomachrus mocinno) es un ave endémica mesoamericana de interés en conservación. Dentro de esta especie, se reconocen a las subespecies P. m. costaricensis y P. m. mocinno por aparentes diferencias morfométricas, sin embargo, hasta el momento no hay datos suficientes que las confirmen. En este estudio, analizamos ocho rasgos morfométricos de 41 quetzales: la longitud del cuerpo, del tarso y de la cuerda alar, así como la longitud, el ancho y la profundidad del pico, el peso corporal, y en el caso de los machos, la longitud de las plumas cobertoras supracaudales. Usamos análisis multivariados para discriminar diferencias morfométricas entre las subespecies. Comparamos cada rasgo morfométrico dentro y entre las subespecies a partir de comparaciones pareadas con el análisis no-paramétrico de Wilcoxon. Realizamos análisis filogenéticos, y de diferenciación y divergencia genéticas fundamentados en las variaciones nucleotídicas de cuatro secuencias de ADNm con la finalidad de revisar el estatus taxonómico de esta ave. La variación nucleotídica fue estimada en la región control, la subunidad NDH6 y los tRNAGlu y tRNAPhe en 26 quetzales de ocho localidades de cinco países. Estimamos la divergencia y la diferenciación genética entre subespecies con base en el modelo de equilibrio mutación-deriva. Obtuvimos el mejor modelo de mutación nucleotídica siguiendo el procedimiento implementado en el programa Model test. Construimos las relaciones filogenéticas entre las subespecies con máxima parsimonia y máxima verosimilitud usando PAUP, así con estadística Bayesiana. Los análisis multivariados discriminaron dos grupos morfométricos, y los individuos se agruparon de acuerdo con la subespecie a la que pertenecen. Las comparaciones pareadas entre las subespecies mostraron fuertes diferencias en la mayoría de los rasgos analizados. En las cuatro secuencias de ADNmt identificamos 32 posiciones nucleotídicas que tienen un nucleótido particular de acuerdo con la subespecie de quetzal. La divergencia genética y la diferenciación fueron marcadas y mostraron dos grupos dentro de P. mocinno que correspondieron a las subespecies de quetzales. El modelo seleccionado para nuestros datos fue el TVM+G. Los tres métodos filogenéticos usados recuperaron dos clados monofiléticos robustos correspondiendo a cada una de las subespecies. Consideramos que nuestros resultados muestran una significativa y real división de P. mocinno en dos grupos genéticos, morfométricos y ecológicos. Además de acuerdo con nuestras estimaciones, el flujo génico está interrumpido entre las subespecies desde al menos hace tres millones de años. Por ello, proponemos que P. mocinno sea dividido en dos especies independientes: P. mocinno (especie norteña, desde México hasta Nicaragua) y P. costaricensis (especie sureña, Costa Rica y Panamá). Esta nueva clasificación de las subespecies de quetzal permitirá mejores logros en su conservación, dado que la evaluación de la clase y magnitud de las amenazas serán más precisas.
Palabras clave: árboles filogenéticos, Mesomérica, ADN mitochondrial, morfometría, quetzales.
References
Ávila, M.L., V.H. Hernández & E. Velarde. 1996. The diet of Resplendent Quetzal (Pharomachrus mocinno mocinno: Trogonidae) in a Mexican cloud forests. Biotropica 28: 720-727. [ Links ]
Avise, J.C. 2000. Phylogeography. The history and formation of species. Harvard University Press, Boston, Massachusetts, USA. [ Links ]
Ball, R.M. Jr. & J.C. Avise. 1992. Mitochondrial DNA phylogeographic differentiation among avian populations and the evolutionary significance of subspecies. Auk 109: 626-636. [ Links ]
Beolchini, F. & M. Corti. 2004. The taxonomy of the genus Tachyorytes: a geometric morphometric approach. Ital. J. Zool. 71: 35-43. [ Links ]
Cracraft, J. 1983. Species concepts and speciation analysis. Curr. Ornit. 1: 159-187. [ Links ]
Excoffier, L. 2006. Arlequin: Computational and Molecular Population Genetics Lab CMPG. Version 3.01. Zoological Institute, University of Berne, Berne, Switzerland. [ Links ]
Frankham, R., J.D. Ballou & D.A. Briscoe. 2002. Introduction to conservation genetics. Cambridge University Press, Cambridge, Cambridge, England. [ Links ]
Hebert, P.D.N., S. Ratnasingham & J.R. de Waard. 2003a. Barcoding animal life: cytochrome c oxidase subunit 1 divergences among closely related species. Proc. Royal Soc. London B (Supp) 270: S96-S99. [ Links ]
Hebert, P.D.N., A. Cywinska, S.L. Ball & J.R. de Waard. 2003b. Biological identifications through DNA barcodes. Proc. Royal Soc. London B (Supp) 270: 313- 321. [ Links ]
Helbig, A.J., A.G. Knox, D.T. Parkin, G. Sangster & M. Collinson. 2002. Guidelines for assigning species rank. Ibis 144: 518-525. [ Links ]
Hillis, D.M., C. Moritz & B.K. Mable. 1996. Molecular systematics. Sinauer Associates Inc. Publishers, Sunderland, Massachusetts, USA. [ Links ]
Howell, S.N.G. & S. Webb. 1995. A guide to the birds of Mexico and Northern Central America. Oxford University Press. Oxford, Oxford, England. [ Links ]
Huelsenbeck, J.P. & F. Ronquist. 2003. MrBayes V3.1.2. GNU Public License, USA. [ Links ]
IUCN 2009. IUCN Red List of Threatened Species. Version 2009.1. (Downloaded on: 17 June 2009, http://www.iucnredlist.org/). [ Links ]
Johns, G.C. & J.C. Avise. 1998. A comparative summary of genetic distances in the vertebrates from the mitochondrial cytochrome b gene. Mol. Biol. Evol. 15: 1481-1490. [ Links ]
Kocher, T.D., W.K. Thomas, A. Meyer, S.V. Edwards, S. Paeaebo, F.X. Villablanca & A.C. Wilson. 1989. Dynamics of mitochondrial DNA evolution in animals: Amplification and sequencing with conserved primers. Proc. Natl. Acad. Sci. USA 86: 6196-6200. [ Links ]
Kumar, S., K. Tamura & M. Nei. 2004. MEGA 3: Integrated software for molecular evolutionary genetics analysis and sequence alignment. Brief Bioinformatics 5: 150-163. [ Links ]
Kynd T., E. Romeijn-Peeters, B. Van Droogenbroeck, J.P. Romero-Motochi, G. Gheysen & P. Goetghebeur. 2005. Species relationships in the genus Vasconcellea (Caricaceae) based on molecular and morphological evidence. Am. J. Bot. 92: 1003-1044. [ Links ]
LaBastille, A., D.G. Allen & L.W. Durrell. 1972. Behavior and feather structure of the quetzal. Auk 89: 339- 348. [ Links ]
Leht, M. 2005. Cladistic and phenetic analyses of relationships in Vicia subgenus Cracca (Fabaceae) based on morphological data. Taxon 54: 1023-1032. [ Links ]
Liedloff, A. 1999. Mantel Version 2.0. Mantel non-parametric test calculator. Queensland University of Technology, Queensland, Australia. [ Links ]
Moritz, C. 1994. Defining evolutionary significant units for conservation. Trends Ecol. Evol. 9: 373-375. [ Links ]
Nei, M. 1987. Molecular evolutionary genetics. Columbia University Press, New York, USA. [ Links ]
Nielsen, R. & J. Wakeley. 2001. Distinguishing migration for isolation: a Markov chain Monte Carlo approach. Genetics 158: 885-896. [ Links ]
Posada, D. 2006. ModelTest server: a web-based tool for the statistical selection of models of nucleotide substitution online. Nucleic Acids Res. 34: W700–W703. [ Links ]
Powell, V.N.G. & R. Bjork. 1994. Implications of altitudinal migration for conservation strategies to protect tropical biodiversity: a case study of quetzal Pharomachrus mocinno at Monteverde, Costa Rica. Bird Cons. Int. 4: 243-255. [ Links ]
Primack, R.B. 1998. Essentials of conservation biology. Sinauer Associates, Massachusetts. [ Links ]
Reynolds, J., B.S. Weir & C.C. Cockerham. 1983. Estimation on the coancestry coefficient: basis for a shortterm genetic distance. Genetics 105: 767-779. [ Links ]
Rozas, J., J.C. Sánchez-Del Barrio, X. Messeguer & R. Rozas. 2005. DnaSP 4.10, DNA polymorphism analyses by the coalescent and other methods. Bioinformatics 19: 2496-2497. [ Links ]
Sambrook, J., E.F. Fritsch & T. Maniatis. 1989. Molecular cloning. A Laboratory manual. Cold Spring Harbor Laboratory Press, New York, USA. [ Links ]
SAS Institute Inc. 2009. JMP 8.0.1. SAS Campus Drive, Cary, North Caroline, USA. [ Links ]
Sibley, C. & B.L. Monroe Jr. 1990. Distribution and taxonomy of the birds. A study in molecular evolution. Yale University Pres, New Haven, Michigan, USA. [ Links ]
Sites, J.W. Jr. & J.C. Marshall. 2003. Delimiting species: a Renaissance issue in systematic biology. Trends Ecol. Evol. 18: 462-470. [ Links ]
Skutch, A.F. 1944. Life history of the Quetzal. Condor 46: 213-235. [ Links ]
Sokal, R.R. & J. Rohlf. 1995. Biometry. Freeman Press, New York, USA. [ Links ]
Solórzano, S. 2010. La Historia Natural del Quetzal y sus Perspectivas en Conservación. In M. A. Pérez- Farrera, C. Tejeda-Cruz & E. Silva-Rivera (eds.). [ Links ]
Los bosques mesófilos de montaña de Chiapas. Situación actual, diversidad, endemismo, biogeografía y conservación. Ed. UNICACH, Guadalajara, Jalisco, México. pp: 113-146. [ Links ]
Solórzano, S., M. García-Juárez & K. Oyama. 2009. Genetic diversity and conservation of the Resplendent Quetzal Pharomachrus mocinno in Mesoamerica. Rev. Mex. Biod. 80: 241-248. [ Links ]
Solórzano, S., A.J. Baker & K. Oyama. 2004. Conservation priorities for resplendent quetzals based on analysis of mitochondrial DNA control region sequences. Condor 106: 449-456. [ Links ]
Solórzano, S., M.A. Castillo-Santiago, D.A. Navarrete- Gutiérrez & K. Oyama. 2003. Impacts of the loss of Neotropical highland forests on the species distribution: a case study using resplendent quetzal an endangered bird species. Biol. Conserv. 114: 341-349. [ Links ] Solórzano. S., S. Castillo, T. Valverde & L. Avila. 2000. Quetzal abundance in relation to fruit availability in a cloud forest in Southeastern Mexico. Biotropica 32: 523-532. [ Links ]
Solórzano, S. 1995. Fenología de 22 especies y su relación con la migración altitudinal del quetzal (Pharomachrus mocinno mocinno, De La Llave 1832) en la reserva de la biosfera El Triunfo, Chiapas, México. Undergraduate Thesis. Facultad de Ciencias, Universidad Nacional Autónoma de México, Mexico City, Mexico. [ Links ]
Stuessy, T.F. 1990. Plant taxonomy: the systematic evaluation of comparative data. Columbia University Press, New York, USA. [ Links ]
Swofford, D.L. 2002. PAUP*: Phylogenetic Analysis Using Parsimony (*and other methods). Version 4.0. Sinauer Associates Inc., Sunderland, Massachusetts, USA. [ Links ]
Thompson, J.D., T.J. Gibson, F. Plewniak, F. Jeanmougin & D.G. Higgins. 1997. The Clustal X windows interface: flexible strategies for multiple sequence alignment aided by quality analysis tools. Nucleic Acids Res. 24: 4876-4882. [ Links ]
Wege, D.C. & A.J. Long. 1995. Key areas for threatened birds in the Neotropics. Bird Life International. The Burlington Press, London, England. [ Links ]
Wheelwright, N.T. 1983. Fruits and the ecology of Resplendent Quetzal. Auk 100: 286-301. [ Links ]

