


 English (pdf)
 Article in xml format
 Article references
 Send this article by e-mail
 Cited by SciELO
  Similars in
SciELO
Similars in
SciELO 
 Permalink
Introduction
Since ancient times, the Earth has experienced fluctuations in climate due to variations in temperature, humidity, atmospheric pressure, and precipitation, among other phenomena. These fluctuations include changes in average weather conditions that result in abnormal climatic behavior across spatial scales. Such changes may represent either a temporary transition, known as the climatic variability, or a prolonged modification, indicative of a long-term process such as climate change (Ruíz Murcia et al., 2015).
The increase in greenhouse gas (GHG) emissions due to anthropogenic activities has shown a significant upward trend, with interannual statistics indicating an average increase of 1,3 % between 1970 and 2000, and of 2.2 % between 2000 and 2010 (Intergovernmental Panel on Climate Change (IPCC), 2023). This has become a global issue, affecting socioeconomics process (e.g., increaded incidence of diseases and pests), agro-environmental factors (e.g., greater reliance on agrochemical inputs), ecological aspects (e.g., glacier melting and deforestation), and sociocultural dynamics (e.g., loss of traditional knowledge and forced migrations). Consequently, the planet’s average temperature could rise by up to 2.5 °C (Andrade et al., 2022; Leonel et al., 2023).
In Colombia, El Niño-Southern Oscillation is the primary phenomenon driving interannual precipitation variability, significantly influencing on rainfall patterns, particularly in the southwest of the country (Cerón et al., 2021). This climatic imbalance has substantial socioeconomic consequences, as agriculture heavily depends on rainfall patterns and seasonal cycles. Changes in precipitation have led to an increase in pests, alterations in crop vegetative cycles, reduced yields, and threats to food security, among other impacts (Canchala et al., 2022; Ruíz Murcia et al., 2015). As a response, alternative strategies have been sought, including the adoption of agricultural practices that enhance carbon sequestration in the soil. This natural resource plays a crucial role in supporting planetary and community well-being through the ecosystem functions and services it provides (Burbano-Orejuela, 2016).
In Latin America, research has provided insights into various knowledge systems, techniques, and practices that could contribute to climate change mitigation and adaptation. Among these strategies, the adoption of carbon sinks- represented by vegetation, soil, and ocean- has gained attention (Delgado-Vargas, Ballesteros Possú, et al., 2022; Leonel et al., 2023). In particular, agroforestry has been recognized for its incorporation of multiple biodiversity levels through tree species with the potential to be integrated into various agroforestry designs. This approach provides multiple ecosystem services, including soil organic carbon (SOC) storage (Ramos-Prado et al., 2023; Somarriba et al., 2024). Through plant interactions and organisms activity, carbon is transformed into organic matter that can be stored in the soil extended periods (Burbano-Orejuela, 2018).
Despite this progress, research on coffee production systems and agroforestry alternatives in coffee-growing regions as potential carbon sinks remains limited. Therefore, it is crucial to develop studies exploring these interaction and assessing the carbon storage potential of agricultural systems associated with perennial woody species in different coffee production systems in Nariño. This research evaluated the relationship between floristic and structural diversity of coffee production systems and soil organic carbon (SOC) storage.
Materials and methods
Study places
The research was conducted from 2019 to 2020 in the southwestern region of Nariño, Colombia, specially in the municipality of Sandoná (N: 1°17’05”, O: 77°28’16”), in the villages of San Gabriel, Plan Ingenio, San Andrés and San Fernando; in the municipality of San Pablo (N: 1º36’06’’, O: 77º00’15’’) in the villages of El Alto and Alto Llano; and in the municipality of Buesaco (N: 1°23’05”, O: 77°09”23”), in the villages of Veracruz, Hatillo Medina, and Medina Espejo (Table 1).
Table 1 Agroclimatic conditions of the localities Buesaco, San Pablo, and Sandoná, Nariño, Colombia. 2019 - 2020.
| Location | Altitude (meters) | Average temperature (¡C) | Precipitation (mm) | Soil order | Soil taxonomy | Range of the farm area (ha) |
| Buesaco | 1692 | 18 | 1400 | Molisol | Entic Hapludolls, Typic Argiudolls | 0.25 - 2 |
| San Pablo | 1700 | 19 | 1998 | Molisol | Entic Hapludolls, Typic Hapludands | 0.75 - 1.8 |
| Sandoná | 1817 | 18.1 | 1091 | Molisol | Entic Hapludolls | 0.75 - 7 |
The study area is located in a Premontane Moist Forest (bh - PM) according to the Holdridge life zone system (Holdridge, 1982). The soils are classified as Class II - III, characterized by undulating topography (9 % slope), moderate susceptibility to water and wind erosion, moderate acidity, and moderately restricted drainage (Instituto Geográfico Agustín Codazzi (IGAC), 2004).
Traditional agroforestry systems (AFS) with coffee were selected based on productive age (4 - 5 years), following the methodology proposed by Delgado-Vargas, Ballesteros Possú, et al. (2022), Pinoargote et al. (2017 , and Somarriba et al. (2013). A Randomized Complete Block design was used across the study localities (municipalities of Buesaco, San Pablo and Sandoná) with four treatments and three repetitions: coffee in full sun (T1), coffee and banana (T2), coffee and multipurpose trees (T3), and coffee and diverse mix pf species, including Musaceae, multipurpose trees, timber, and fruit trees (T4). A total of twelve experimental units were evaluated.
Floristic and structural diversity of the production systems
To obtain the information, comprehensive agroforestry inventories were conducted, recording all canopy-shading plant species on each farm. The density and floristic composition of the production system were determined, as well as the diversity of plant species.
Dasometric measurements were taken, including tree height, diameter at breast height (DBH), and basal area (measured at 1.30 m). These measurements were categorized by type of multipurpose woody perennial, including fruit trees, forage, firewood species, timber trees, ornamentals, and Musaceae. Additionally, the percentage of shade was estimated using visual method, and species diversity was assessed using the Shannon-Weiner and Simpson indices.
Estimation of organic carbon storage in the soil
An experimental plot of 10,000 m2 (100 x 100 m) was established for each treatment, following the methodology proposed by Aguilar & Guharay (2002). For soil sampling, 10 random subsamples were collected from each treatment at a depth of 30 cm. These subsamples were the combined to obtain a composite sample of 1 kg. In the laboratory, carbon content was determined using the combustion method (MacDicken, 1997), and bulk density using the combustion method (Forsythe, 1975), and bulk density was measured using the “cylinder of known volume” method. Additionally, the samples were analyzed to determine various physical and chemical soil properties across the different coffee production systems, as shown in the Table 2.
Table 2 Chemical and physical variables analyzed in soil samples in the Specialized Soil Laboratory. Universidad de Nariño. San Juan de Pasto, Colombia. 2020.
| Parameter | Method | References |
| Soil organic carbon | Wet digestion (Walkley-Black) | Icontec, 2006 |
| Soil organic matter | Wet digestion (Walkley-Black) | Icontec, 2006 |
| Total soil nitrogen | Modified Kjeldahl | IGAC, 2006 |
| Apparent density | Graduated cylinder | Icontec, 2006 |
| Real density | Pycnometer | IGAC, 2006 |
| Soil texture | Bouyoucos | IGAC, 2006 |
| Total porosity | P = 1-(Da/Dr)*100 | IGAC, 2006 |
| Fertility | Different methods | Icontec, 2006 |
Statistical analysis
A completely randomized block design was established in the municipalities of Buesaco, San Pablo, and Sandoná, with four treatments and three repetitions. The treatments corresponded to different coffee production systems: coffee in full sun (T1), coffee and banana (T2), coffee and multipurpose trees (T3), and coffee with a diverse mix of Musaceae, multipurpose trees, timber, and fruits trees (T4).
A modified Shapiro-Wilks test was used to assess data normality, followed by a one-way analysis of variance (ANOVA) to determine the significant statistical differences between treatments. Tukey’s test was applied to separate treatment means. Additionally, principal component analysis (PCA) was performed to identify potential groupings of variables and production systems, considering only variables with a coefficient of variation (CV) greater than 30 %. Data analysis was conducted using R software version 4.3.0 (R Core Team, 2023) with a 95 % confidential level.
Results
Floristic and structural diversity of the production systems
A total of 359 individuals belonging to 37 species and 25 families were recorded. The highest density of woody tree and shrub species was observed in T4 across the three locations, with a total of 108 individuals/ha. Species richness in T3 and T4 ranged between four and twelve multipurpose woody perennial species. The most abundant species recorded were Trichanthera gigantea (Bonpl.) Nees, Musa × paradisiaca L., Cyphomandra betacea (Cav.) Sendtn., Citrus limon (L.) Osbeck, Carica papaya L., Psidium guajava L. On average, four species per coffee plantation were classified, classified by use as follows: 58 % fruit-bearing, 13 % forage, 13 % ornamental, 13 % timber, and 1 % wood energy (firewood), as presented in Table 3.
Table 3 Diversity indices and percentage of shade in the C. arabica production systems in the municipalities of Buesaco, Sandoná, and San Pablo, Nariño, Colombia. 2019 - 2020.
| Indexes | Buesaco | Sandoná | San Pablo | |||||||||
| T1 | T2 | T3 | T4 | T1 | T2 | T3 | T4 | T1 | T2 | T3 | T4 | |
| S-W | 0 (b) | 0.65 (b) | 1.40 (a) | 2.2 (a) | 0 (b) | 0.61 (b) | 2.1 (a) | 1.85 (a) | 0 (b) | 0.54 (b) | 1.9 (a) | 1.7 (a) |
| S | 1 (b) | 0.54 (b) | 0.20 (a) | 0.12 (a) | 1 (b) | 0.58 (b) | 0.12 (a) | 0.21 (a) | 1 (b) | 0.64 (b) | 0.14 (a) | 0.19 (a) |
| J | 0.13 (a) | 0.18 (a) | 0.15 (a) | |||||||||
| Shade | 0 (b) | 11.8 (b) | 38.8 (a) | 84.4 (a) | 0 (b) | 45.9 (b) | 56.7 (a) | 62.4 (a) | 0 (b) | 19.3 (b) | 86.3 (a) | 66.1 (a) |
S-W means Shannon-Weiner index. S means Simpson’s index. J means Jaccard index. Shade means percentage of shade. Parameters with different letters differ statistically (p < 0.05). / S-W significa índice de Shannon-Weiner. S significa índice de Simpson. J significa índice de Jacard. Shade significa porcentaje de sombra. Parámetros con letras diferentes difieren estadísticamente (p < 0,05).
Higher diversity index values were observed in T3 and T4. Regarding the Jaccard similarity coefficient, the values were close to 0, indicating a decrease in shared species between municipalities. The highest percentage of shade was recorded in T3 and T4, with the most shading species being Palicourea amethystina (Ruiz & Pav.) DC. (90 %), Tabebuia chrysantha (Jacq.) G. Nicholson (83 %), and Mangifera indica L. (71 %) in the municipalities of Sandoná and San Pablo.
Estimation of carbon stored in the soil - SOC
No significant statistical differences were observed in the soil organic carbon (SOC) concentration among the production systems (p > 0.51) (Table 4). However, a trend toward greater carbon accumulation was noted in T4 (coffee, banana, fruit trees, and leguminous plants), with values ranging from 66.63 Mg ha-1 to 86.83 Mg ha-1. Conversely, the lowest accumulation was observed in T1, which values ranging from 38.55 Mg ha-1 to 76.14 Mg ha-1.
Table 4 Total carbon stored in the soil across C. arabica production systems in the municipalities of Buesaco, Sandoná, and San Pablo, Nariño, Colombia. 2019 - 2020.
| Treatments | SOC (Mg ha-1) | N (kg·ha-1) | OM (%) |
| T4 | 80.43ª | 7.24ª | 4.75ª |
| T2 | 71.57ª | 6.07ª | 4.43ª |
| T3 | 68.56ª | 5.53ª | 3.85ª |
| T1 | 58.32ª | 5.02ª | 3.52ª |
SOC: Soil organic carbon; OM: Organic matter. / SOC: carbono orgánico del suelo; OM: materia orgánica.
Principal component analysis
The Principal Component Analysis (PCA) made it possible to form four large factors to explain 81 % of the total variation evaluated (Table 5). The first factor explains 28 % of the variability and is mainly composed of the variables boron (-72.84), phosphorus (-70.5), Shannon (-52.96), and shade (-49.05). This shows that the lack of the tree component that casts shade on the coffee makes the soil present greater phosphorus retention, due to the traditional tillage management. The second factor, which explained 50 % of the variability observed, was mainly composed of the variables total trees per hectare (-50.10), organic matter (-36.93), and diameter at breast height (-25.068), where bulk density and pH stood out. The third factor, which explained 69 % of the total variation related to cation exchange capacity (CEC) (-57.82), soil potassium content (-31.38), shade (-30.37), and Shannon index (-30.31). Finally, the fourth factor showed an 81 % explanation of the variability with the highest contribution of organic matter (-51.55) in this component (Table 6).
Table 5 Total variability of the different components of the production systems of C. arabica in the municipalities of Buesaco, Sandoná, and San Pablo, Nariño, Colombia. 2020.
| Component | Value | Percent | Cumulative (%) |
| C1 | 3.3337 | 3.3340 | 28 |
| C2 | 2.6732 | 6.0070 | 50 |
| C3 | 2.3056 | 8.3130 | 69 |
| C4 | 1.3654 | 9.6780 | 81 |
| C5 | 1.0599 | 10.7380 | 89 |
| C6 | 0.6804 | 11.4180 | 95 |
| C7 | 0.2625 | 11.6810 | 97 |
| C8 | 0.1561 | 11.8370 | 99 |
| C9 | 0.1003 | 11.9370 | 99 |
| C10 | 0.0473 | 11.9840 | 100 |
| C11 | 0.0156 | 12.0000 | 100 |
Table 6 Relative contribution of variables to different components of C. arabica production systems in the municipalities of Buesaco, Sandoná, and San Pablo, Nariño, Colombia. 2019 - 2020.
| Variable | Components | |||
| C1 | C2 | C3 | C4 | |
| pH | 12.6629 | 41.2917 | -21.7935 | -17.90954 |
| OM | -0.0515 | -36.9307 | -5.6915 | -51.55449 |
| Phosphorus | -70.5330 | 13.5905 | 4.8983 | 0.34569 |
| CEC | 22.0365 | -1.7344 | -57.8151 | 11.64876 |
| Magnesium | 30.3755 | 16.6955 | -26.2119 | 11.0904 |
| Potassium | -1.9272 | 1.6961 | -31.379 | -2.66205 |
| Boron | -72.8396 | 4.2052 | 0.3492 | 0.03514 |
| DBH | -2.2276 | 74.2125 | -1.4609 | -2.18829 |
| Shadow | -49.0486 | -0.2291 | -30.3069 | 2.54917 |
| Total trees | -1.0475 | -50.1029 | -12.4585 | -5.3115 |
| Shannon | -52.9596 | 1.5612 | -30.3703 | -2.86928 |
pH: Indication of the acidity or alkalinity of soil; OM: Organic matter; CEC: Cation exchange capacity; DBH: Diameter at breast height. / pH: medición de la alcalinidad o acidez del suelo; MO: Materia orgánica; CIC: Capacidad de intercambio catiónico; DBH: Diámetro a la altura de pecho.
The principal component analysis ordination (Figure 1) showed a slight clustering of the variables Shanon-Weiner Index, amount of shade, and boron content, which were represented in the coffee systems with fruit trees and coffee with Musaceae. Similarly, total trees, OM, pH, bulk density, and DBH had a strong influence on component 2.
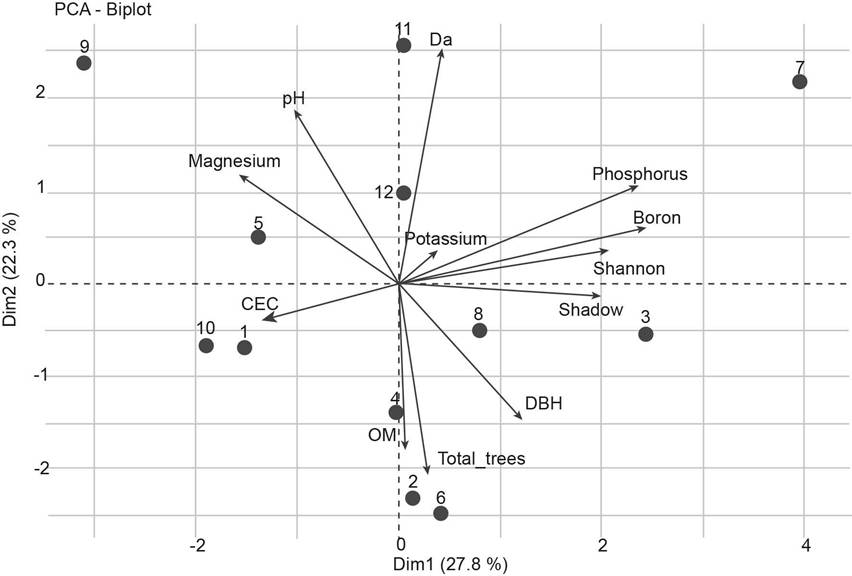
Figure 1 Principal Component Analysis (PCA) of the physical and chemical properties of the soil, diameter at breast height, shade canopy, and total trees associated with the types of productive systems in C. arabica production systems in the municipalities of Buesaco, Sandoná, and San Pablo, Nariño, Colombia. 2019 - 2020.
Hierarchical classification analysis
The hierarchical classification analysis allowed the identification of three hierarchical groups or clusters, characterized by the similarity withing each group and by the differences between the accessions that formed the groups (Figure 2).
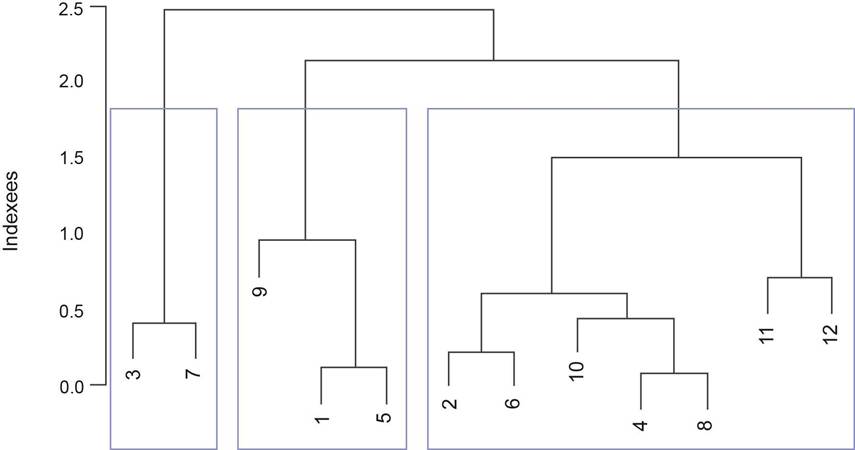
Figure 2 MCL dendrogram of the variables evaluated in the C. arabica production systems in the municipalities of Buesaco, Sandoná and San Pablo, Nariño, Colombia. 2019 - 2020.
Cluster one groups coffee farms with various crops (coffee, bananas, fruit trees, legumes). In this cluster, there is a significant contribution of boron and phosphorus, equal to or higher than the average of 0.41 and 60 ppm, respectively, compared to the overall average of 0.24 and 20.88 ppm. In cluster two, the coffee systems with free exposure are agglomerated, showing low variability due to the presence of only one component (coffee). There are no woody plants contributing to the DBH, and there is no shade. The variables of this system present mean values lower than the general averages in the Shannon index, DBH, and shade index variables. This correlates with the low amount of organic matter accumulated and, consequently the low capacity of this production system to accumulate carbon. In cluster three, the largest number of production systems is found. These farms contain coffee systems with bananas and coffee with fruit trees. They are the farms with average values in all the indices, having OM percentage of 4.14 %, pH of 5.6, boron content of 0.24, P of 20 ppm, and bulk density of 0.97, among others.
Discussion
The department of Nariño has two agroecological zones with a warm climate and similar agroclimatic characteristics, corresponding to ecotopes 220A and 221A. These areas feature Entic Hapludolls and Typic Argiudolls soils, which belong to the Mollisol order. These are mineral soils (sediments and organic residues) with a high clay content, rich in cations that form bases and nutritive salts (Criollo Escobar et al., 2016; Gómez Cardozo et al., 2018).
In the stratified agroforestry system associated with coffee, a higher carbon/nitrogen (C/N) ratio was observed compared to conventional coffee (T4: 11.10 and T1 11.61). When the C/N ratio ranges between 10 and 14, microbial proliferation is favored, as microorganisms have sufficient carbon as energy source and nitrogen to synthesis. This process enhances the mineralization of nitrogen for protein synthesis. This process enhances the mineralization of nitrogen, making it available for plant uptake (Gamarra Lezcano et al. 2018). An average bulk density of 0.97 gm/cm3 was recorded, which is below the ideal range (1.3 - 3 gm/cm3). However, this does not negatively affect root growth, proper drainage, aeration, and nutrient flow were observed (Alvarado et al., 2013; Forsythe, 1975).
Increasing plant species diversity in coffee system promotes greater carbon accumulation in the soil (Somarriba et al., 2024). This positive interaction between biodiversity indices, organic matter, and Soil Organic Carbon (SOC) stocks is essential for ecosystem functioning, soil health, water cycle regulation, and climate change mitigation (Delgado-Vargas, Leonel et al., 2022; Laban et al., 2018). Therefore, SOC correlates with the abundance of perennial woody plants, which contribute to litter deposition and root biomass, enhancing soil carbon storage and organic matter content. Organic matter alone contains over 1.4 x 10¹² Mg ha-1 of carbon, nearly twice the amount found in the atmosphere (Organización de las Naciones Unidas para la Alimentación y la Agricultura, 2002; Villanueva et al., 2023).
Land use and management play a crucial role in carbon storage dynamic, as evidenced by the variability among different production systems (treatments). This variability is associated with factors such as species composition, botanical diversity, and soil cover. Although organic matter content and carbon storage influenced variability, they had relatively low values, leading to no significant differences in carbon storage reports (Somarriba et al., 2024).
Thus, agroforestry emerges as a viable alternative, integrating multipurpose woody perennials (trees/shrubs) into productive systems. This approach fosters biodiversity, contributing to system resilience in the medium and long term. Consequently, the Shannon Index, Simpson Index, and absolute species abundance show significant contrasts in treatments T2, T3, and T4, compared to the monoculture system T1 (Burbano-Orejuela, 2018; Vega Orozco et al., 2014).
Diversity increases as the system is established and reaches a certain level of maturity. Meanwhile, other theories suggest that the incorporation of species into the system- and consequently, the increase in diversity- depends on the producers’ experience and the technical support provided by projects that help achieve productive objectives (Somarriba et al., 2024).
In agroforestry systems (AS) with higher biodiversity (Shannon-Weaver 1.9 and Simpson 0.2), with various perennial woody species but with low abundance, which may represent a diversity of products. So, it is important to plan and design agroforestry to optimize and direct the coffee system to a production of differentiated quality (Delgado-Vargas, Leonel et al., 2022).
In AS, carbon storage rates depend on agro-climatic factors such as plant density, fertility, soil type, site climatic characteristics, age, and forestry management of the production system (Rousseau et al., 2021). When estimating the storage of SOC in coffee production systems under agroforestry systems (AS with coffee and nut, AS with banana and coffee in full sun exposure), no statistical differences were found between AS in the first 30 cm of soil, with an average carbon storage between 33.6 and 72.3 Mg ha-1 (Alvarado et al., 2013). Besides, coffee cultivation in association with Eucalyptus deglupta and Erythrina poepiggiana at different ages, with sampling at 30 cm of soil, showed carbon storage of 66.2 and 87.3 Mg ha-1, respectively (Ávila et al. 2001).
The difference between the storage values may be associated with the life zone where the systems are established and sometimes the sampling depth, since soil C is mainly stored in the surface layer with a tendency to decrease towards the lower layers (Carvajal et al., 2009), in addition to soil processes over time, mainly due to litterfall, as well as mortality and exudation of fine roots, which depends on their distribution and activity (Alvarado et al., 2013). A wide range of carbon accumulation in soils have been found, between 3.9 Mg ha-1 and 90.0 Mg ha-1 (Poveda et al., 2013). On the Ecuadorian coast, in two agroecological zones, values of 66.9 Mg ha-1, 72.0 Mg ha-1, and 78.8 Mg ha-1 were found in AS with coffee and Schizolobium parahybum, coffee and Guadua spp., and coffee and Cordia alliodora, respectively (Hernández Núñez et al., 2021). In seven-year coffee plantations in PBS with Inga densiflora, values of 25.2 Mg ha-1 were reported, while in coffee monocultures, 9.8 Mg ha-1 were found (Hergoualc’h et al., 2012).
It is important to note that fine roots (diameter <2 mm) are the main source of SOC accumulation due to senescence at depths of 0-15 cm, decreasing progressively as the soil depth increases (Delgado Vargas et al., 2016), with up to 75 % of fine roots. Similar trends are reported by Goçalves Tonucci et al. (2023), Siles et al. (2010), and Villanueva et al. (2023) when evaluating the dynamics of SOC in other production systems in the tropics, which is directly proportional to the biological productivity of the system in the first 30 cm of soil (Alvarado et al., 2013; Rodríguez et al., 2022). It has been verified that the selection of tree species can significantly affect the ability of agroecosystems to capture and store atmospheric carbon and maintain nutrient cycles; therefore, the agroforestry planning and the farm plan for its management is essential for the coffee grower, the family organization, and the commitment to carry out the practices for the optimization of the agroforestry system (Leonel et al., 2023). A careful selection of species could optimize the provision of ecosystem services (Ontong, et al., 2023); similarly, it is corroborated that various agroforestry systems cannot store more carbon than monocultures (Xiang et al. 2022).
Conclusions
There was evidence of greater diversity and species abundance in the multi-stratum agroforestry system (semiannual crops, timber trees, fruit trees, mosses, and firewood) in association with coffee (T4), which correlates with a higher accumulation of organic carbon in the soil compared to the coffee monoculture (80.43 t C ha-1 vs. 58.32 t C ha-1, respectively). Such diversification in tree cover is promising for carbon capture and storage efforts, contributing to climate change mitigation.
The principal component analysis allowed the identification of four factors or components, explaining 81 % of the total variability in the evaluated production systems. The variables that contributed the most were P and B content, the Shannon index, number of trees, density, IC, and organic matter. These are associated with diverse agroforestry systems that enhance soil dynamics, improving soil structure and fertility, as well as creating a favorable microclimate for coffee cultivation, thereby promoting greater carbon accumulation and cycling.

