


 text in
  English (pdf)
 Article in xml format
 Article references
 Send this article by e-mail
 Cited by SciELO
  Similars in
SciELO
Similars in
SciELO 
 Permalink
The mentonian foramen is considered one of the most important anatomical landmarks in the anterolateral aspect of the mandibular body due to the terminal neurovascular branches running from this structure (Goyushov et al., 2018). It is formed from the opening of the anterior end of the lower dental canal. In adults, it is located between 13 to 15 mm from the lower edge of the mandible, equidistant from the basal edge and alveolar ridge (Cabanillas & Quea, 2014). However, its final location will depend on variations according to age and other characteristics of each individual, such as race (Fernandez, 2016; Mendoza, 2015).
To determine the location more accurately, base and stable structures should be used, thus relating the location of AM with other anatomical structures such as the basilar margin and the alveolar ridge that are used as references in other situations of clinical practice (Andrade et al., 2020). That is why, in this research, the distance of the mentonian foramen in relation to the alveolar ridge and the mandibular base was determined by using Cone Beam CT scans of dentate patients.
The relative vertical position of the mentonian foramen is influenced by the bone loss of the alveolar ridge (Chrcanovic et al., 2011). The mandibular bone is much more porous in its posterior area, specifically in the molar area. Additionally, there is a greater thickness of cortical bone in the premolar and molar areas (Garcia, 2020; Garcia & Gálvez, 2020).
Accurate knowledge of the location, borders, and size of the mentonian foramen is crucial in clinical dentistry, particularly when administering mentonian nerve block anesthesia and performing surgical interventions affecting the mandible, such as apical surgery, implant treatment, and other osteotomy procedures. This knowledge helps in avoiding iatrogenic injuries (Goyushov et al., 2018; Orhan, 2013). The mentonian foramen is an area with anatomical peculiarities and complexity, which could lead to temporary sensory consequences for the patient, such as labiomental paresthesia. Therefore, dentists must take all necessary precautions to protect the mentonian nerve during surgical interventions (Pelé et al., 2021).
Through the utilization of Cone Beam CT scans, a high spatial resolution image of the craniofacial complex in 3D can be obtained, demonstrating its effectiveness in capturing images of the head and neck for both clinical and anthropological/ forensic studies without distortion or image overlap. This allows for real visualization and is considered a standard method for evaluating bone and dentoalveolar structures (Lenguas et al., 2010; Roque et al., 2015; Angel et al., 2011; Do Nascimento et al., 2016). The main advantages of CBCT include lower radiation exposure for the patient and the affordability of devices for tomographic imaging (Angel et al., 2011; Abboud et al., 2013).
Method
A non-probabilistic convenience sampling method was employed to select the sample, consisting of 109 CBCT scans from individuals of both sexes (69 women and 40 men) aged between 18 and 50 years. These scans were collected from the Instituto de Diagnóstico Maxilofacial in Lima, Peru, and were distributed across three age groups: 18 to 28 years, 29 to 39 years, and 40 to 50 years. The tomographies were conducted using a Promax 3D mid device from Planmeca, Finland, with parameters set to 11.0 mA and 10.0 Kv, a field of view (FOV) of 20.0x20.0mm, voxel size of 200 um, and an exposure time of 25 seconds. For tomographic analysis, the Planmeca Romexis Viewer 5.3.3.5 software was utilized. Tomographic readings were performed on a computer running Windows 10 Pro 64-bit, equipped with an Intel® Core™ i9-9900k CPU @ 3.60 GHz and 32.0 GB RAM.
The CT scans evaluated were of dentate individuals who attended between March and October 2020. Images featuring bilateral teeth from 36 to 46, without periodontal disease or systemic diseases compromising bone loss in the evaluated area, were included. CT scans of edentulous patients, those with poor quality, distortion, or any artifacts present, along with those wearing orthodontic appliances or dental implants, were excluded.
To analyze the distances, measurements were taken from the upper edge of the mentonian foramen to the alveolar ridge and from the lower edge of the mentonian foramen to the base of the jaw. The data were grouped according to sex, age group, and side (right and left) (Figure 1).
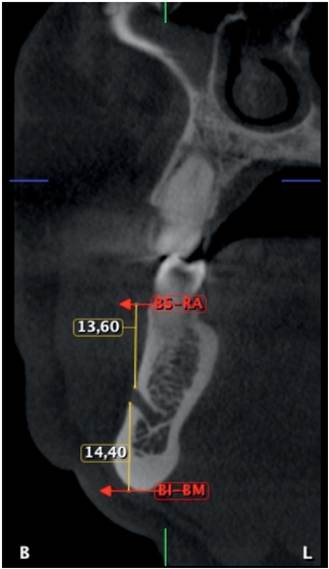
Figure 1 Transaxial CBCT slice of right mandible, showing measurements from the superior border of the mentonian foramen to the alveolar ridge (BS-RA) and from the inferior bode of the mentonian foramen to the mandibular base (BI- BM).
The data were processed employing SPSS Statistics version 26.0. Quantitative variables, determined by the distance from the upper edge of the mentonian foramen to the alveolar ridge and from the lower edge of the mentonian foramen to the mandibular base, were evaluated by side and presented as minimum, maximum, means, and standard deviations.
Student’s t-test for related samples was applied to evaluate the differences between the right and left sides, Student’s t-test for independent samples to analyze the measures by sex (female and male), and one-way ANOVA to analyze differences across age groups were conducted. All tests were conducted at a significance level of 5%.
Results
Table 1 Measurements of distances from the upper edge of the mental foramen to the alveolar ridge and from the lower edge of the mental foramen to the mandibular base according to side.
| Parameters | Distance from the upper edge of the mentonian foramen to the alveolar ridge | Distance from the lower edge of the foramen mentonis to the mandibular base | ||
| Side | Right | Left | Right | Left |
| N | 109 | 109 | 109 | 109 |
| Mean | 13.98 | 14.02 | 13.64 | 13.98 |
| Minimum value | 8.40 | 10.20 | 8.00 | 10.00 |
| Maximum value | 20.40 | 18.00 | 18.80 | 19.40 |
| standard deviation | ±2.53 | ±1.70 | ±2.29 | ±1.67 |
| P value | 0.629 p ≥ 0.05 | 0.769 p ≥ 0.05 | ||
Table 2 Distance from the upper edge of the mental foramen to the alveolar ridge by age group according to side.
| Age group | Distance from the upper edge of the mentonian foramen to the alveolar ridge | |
| right side X ± S | Left side X ± S | |
| 18-28 years | 13.97 ± 2.88 | 14.03 ± 1.72 |
| 29-39 years | 13.84 ± 2.39 | 14.35 ± 1.46 |
| 40-50 years | 14.22 ± 2.2 | 13.44 ± 1.90 |
| P value | 0.84 p ≥ 0.05 | 0.09 p ≥ 0.05 |
Table 3 Distance from the inferior border of the mentonian foramen to the mandibular base by age group according to side.
| Age group | Distance from the lower edge of the foramen mentonis to the mandibular base | |
| Right side X ± S | Left side X ± S | |
| 18-28 years | 13.55 ± 2.43 | 14.06 ± 1.50 |
| 29-39 years | 13.64 ± 2.26 | 14.28 ± 1.71 |
| 40-50 years | 13.80 ± 2.17 | 13.40 ± 1.74 |
| P value | 0.90 p ≥ 0.05 | 0.09 p ≥ 0.05 |
Table 4 Distance from the upper edge of the mentonian foramen to the alveolar ridge and from the lower edge of the mentonian foramen to the mandibular base by sex according to side.
| Distance from the upper edge of the mentonian foramen to the alveolar ridge | Distance from the lower edge of the foramen mentonis to the mandibular base | |||
| Gender | Right side X ± S (mm) | Left side X ± S (mm) | Right side X ± S (mm) | Left side X ± S (mm) |
| FEMALE | 13.49 ± 2.27 | 13.54 ± 1.40 | 13.36 ± 2.14 | 13.63 ± 1.31 |
| MALE | 14.82 ± 2.76 | 14.84 ± 1.86 | 14.14 ± 2.47 | 14.59 ± 2.02 |
| P VALUE | p < 0.05 | p < 0.05 | 0.10 p ≥ 0.05 | p < 0.05 |
A total of 109 CBCT scans were evaluated, comprising 69 females (63.3%) and 40 males (36.7%), divided into three age groups: 18 to 28 years (37.6%), 29 to 39 years (38.5%), and 40 to 50 years (23.9%). In the measurement of the distance from the upper edge of the mental foramen to the alveolar ridge, no statistically significant differences were found between the sides (p = 0.629) (Table 1).
Similarly, in the measurement of the distance from the lower edge of the mentonian foramen to the mandibular base, no statistically significant difference was found between the sides (p = 0.769) (Table 1).
When examining distances within age groups, no significant differences were found in the distance to the alveolar ridge (p ≥ 0.05) (Table 2). Similarly, there were no statistically significant differences between age groups in the means for the distance to the mandibular base on both the right and left sides of the mandible (p ≥ 0.05) (Table 3).
When evaluating distances according to sex, statistically significant differences were found between the sexes for both sides (p < 0.05) (Table 4). Likewise, significant differences were found on the left side in the distance to the base of the mandible (p < 0.05) (Table 4).
Discussion
Studies conducted in the Peruvian population (Cabanillas & Quea, 2014; Delgadillo & Mattos, 2017; Zea, 2020; Concha, 2014), along with our research, have established the location of the MA using nearby anatomical structures as a guide. Consequently, to pinpoint its location, base and stable anatomical structures that connect the position of the AM with those of other anatomical features such as the basilar border and the alveolar ridge, which are used as a reference in other clinical practice scenarios, should be utilized (Andrade et al., 2020).
Considering more stable anatomical components, such as the aforementioned references, to locate the position of the mental foramen will provide us with results having more accurate values. This is due to the fact that we are a multiracial culture, thus possessing greater knowledge of the ethnic component of our population in relation to the mental foramen by correlating it with adjacent anatomical structures.
The sample size is comparable to that employed in other studies (Cabanillas & Quea, 2014; Zea, 2020; Delgadillo & Mattos, 2017; Concha, 2014), while larger samples were used in other works (Muinelo et al., 2017; Gungor et al., 2017; Çaglayan et al., 2014; Von Arx et al., 2013).
By using a larger sample, it is possible to obtain more knowledge of the results in different populations; however, this research contributes to the literature by evaluating the position of the mentonian foramen through the use of CBCT is reliable in the evaluation of bone and dentoalveolar structures, which will be of much help in diagnosis in different areas of Dentistry because it offers greater accuracy, no distortions, lower radiation dose, and no overlapping of images (Do Nascimento et al., 2016; Buitrago et al., 2020; Montoya, 2011).
When evaluating the distance from the inferior border of the AM to the mandibular base on each side, similar results to those obtained by Cabanillas and Quea (2014) were found: 13.6 ± 2.0 mm on the right side and 13.9 ± 1.80 mm on the left side.
They indicated that there were no significant differences between the sides. Von Arx et al. (2013) reported 13.7 mm on the right side and 13.5 mm on the left side. However, lower measurements were found in other studies (Nimigean et al., 2022; Gungor et al., 2017; Concha, 2014).
Muinelo et al. (2017) conducted their study according to dental status, dividing patients into three subgroups: dentate, partially edentulous, and edentulous. They found that in dentate patients, the distance from the MA to the lower border of the mandible was 13.52 ± 1.59 mm.
They determined that the position of the mentonian foramen did not differ according to the side. On the other hand, a small discrepancy was found with the study by Mashyakhy et al. (2021), who reported a total distance of 14.03 ± 1.58 mm. This difference was attributed to the point of measurement, as they started from the center of the MA, whereas in this study, measurements started from the inferior margin of the MA.
In this study, as in others, it was found that the highest distances according to sex were observed in men compared to women on both sides. Generally, when differences in distances between the sexes were identified, these values were higher in males.
Previous studies have consistently shown the presence of sexual dimorphism, with higher values for males (Zea, 2020; Gungor et al., 2017; Çaglayan et al., 2014; Villavicencio, 2018; Dos Santos et al., 2018; Kalender et al., 2012; Pelé et al., 2021; Cavalcante et al., 2023; Abu-Ta’a et al., 2023).
Sex steroid hormones affect bone size, shape, and density, with estrogen deficiency increasing bone turnover in women. Hormonal changes during female development, such as puberty, pregnancy, and menopause, can impact the periodontium significantly (Garcia, 2002). Conversely, men exhibit a greater continuity of bone formation (Çaglayan et al., 2014) and typically have a wider, squarer jaw with a more prominent chin (Concha, 2014).
According to the age group, individuals aged 40 to 50 years old presented lower values on the left side for both sexes, a result similar to the study conducted by Zea (2020), who obtained that this age group has the smallest distances on both sexes and sides. Muinelo et al. (2017) indicate that the mentonian foramen distance decreases with increasing age. Çaglayan et al. (2014) indicate that the values of the distances will be higher in the 21 to 40 years age group, which can be attributed to the fact that with advancing age, the skeletal structure undergoes qualitative, quantitative, and microarchitectural changes.
The latter is related to the change in the shape of the trabeculae, the increase in anisotropy, and the decrease in the bone volume fraction caused by the thinning of the trabeculae (Piña et al., 2018). Likewise, Quevedo and Hernandez (2011) indicate that past the age of 35 years, bone mineral density in men and women gradually decreases as age increases, mainly in females after menopause.
Conclusions
It is concluded that the mentonian foramen in a dentate Peruvian population is 13.81 mm closer to the mandibular base than to the alveolar ridge.
The age group of 40 to 50 years presented, on average, lower values in the distance of the mental foramen to the alveolar ridge and mandibular base, although the measurements on the right side were greater than on the left side in both the measurements from the upper edge of the foramen to the alveolar ridge and from the lower edge of the mental foramen to the mandibular base.
The female sex had shorter distances than the male sex, on both sides and in both measurements.
Author contribution statement:
Conceptualization and design: IAL Literature review: IAL.
Methodology and Validation: IAL and SGL Formal analysis: IAL
Investigation and data collection: IAL Resources: IAL, and SGL
Data analysis and interpretation: IAL
Writing-original draft preparation: IAL and SGL Writing-review & editing: IAL and SGL Supervision: SGL
Project administration: IAL and SGL

