


 English (pdf)
 Article in xml format
 Article references
 Send this article by e-mail
 Cited by SciELO
  Similars in
SciELO
Similars in
SciELO 
 Permalink
Introduction
Researchers have recognized the coexistence of food insecurity and excess body weight, especially among women (Adams, Grummer-Strawn, & Chavez, 2003; Kac, Pérez-Escamilla, Moura da Silva, & Schlussel, 2013; Pan, Sherry, Njai, & Blanck, 2012; Townsend, Peerson, Love, Achterberg, & Murphy, 2001). The relationship between food insecurity and excess body weight in relation to race/ethnicity has also been found. For example, a study that used California Women’s Health Survey found that food insecurity was associated with an increased likelihood of obesity, and this risk was greatest in non-White participants (Adams et al., 2003).
The direction of the association between food insecurity and obesity in women has not yet been established (Institute of Medicine, 2011). The more common assumption has been that food insecurity leads to obesity, however, there are several studies that suggest that the relationship between food insecurity and obesity may be bidirectional. Behavioral factors such as, diet and exercise have been proposed as mediators of this relationship (Gortmaker et al., 1993; Martínez Jaikel, 2017; Sobal & Stunkard, 1989), but other additional factors might explain this relationship, for example, depression and anxiety.
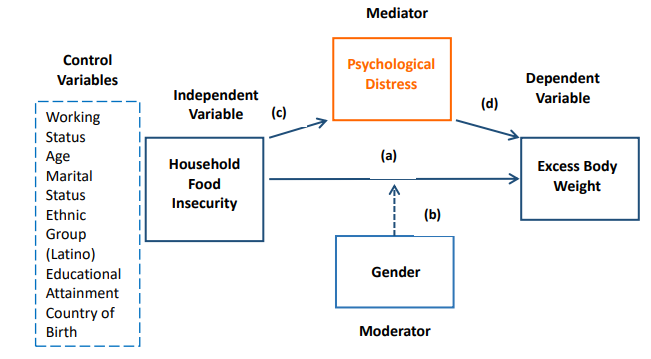
Both food insecurity and excess body weight have been associated with depression and anxiety (Becerra, Sis-Medina, Reyes, & Becerra, 2015; Castañeda et al., 2016; de Wit et al., 2010; Hadley & Patil, 2006; Heflin, Siefert, & Williams, 2005; Luppino et al., 2010; Whitaker, Phillips, & Orzol, 2006). Hence, depression and anxiety may partially explain this relationship. However, we lack evidence on whether depression and anxiety themselves explain the relationship between food insecurity and excess body weight. Our study aims to understand the relationship between food insecurity, excess body weight and psychological distress in the Latino population in California using data from the 2014 California Health Interview Survey (CHIS). Based on our conceptual model (Figure 1), we present three hypotheses. First, food insecurity will be associated with excess body weight in the Latino population (Hypothesis 1). Second, the direction of the relationship between food insecurity and excess body weight will vary by gender (Hypothesis 2). Finally, psychological distress will mediate the relationship between food insecurity and excess body weight (Hypothesis 3).
Theoretical Framework
Food insecurity is defined as “limited or uncertain availability of nutritionally adequate and safe foods or limited or uncertain ability to acquire acceptable foods in socially acceptable ways” (United States Department of Agriculture, 2014, p. 6). Food insecurity may have negative health consequences such as obesity, anxiety, depression, and poor pregnancy outcomes (Franklin et al., 2012; Institute of Medicine, 2011; Ivers & Cullen, 2011).
In 2014 in the United States (U.S.), 17.4 million households (14%) were food insecure and Black and Hispanic households were at the greater risk of food insecurity (Coleman-Jensen, Gregory, & Singh, 2014). In the CHIS of 2011 and 2012, around one in four Latino adults (26.8%) reported being food insecure, which was significantly higher than overall food insecurity in California (14.9%) (UCLA Center for Health Policy Research, 2012). Food security can also be also influenced by assistance program like Supplemental Nutrition Assistance Program (SNAP) program. The SNAP is a national assistance program in the U.S. that aims to improve food security in the households with low-income (Kaiser et al., 2015).
Overweight (BMI ≥25 kg/m2) and obesity (BMI ≥30 kg/m2), which is defined as excess body weight in this study, is a global health problem. In the U.S., the prevalence of obesity has largely increased over the past decades, especially among minority and low-income groups, including the Latino population (Flegal, Carroll, Kit, & Ogden, 2012; World Health Organization, 2015). Excess body weight has negative health and psychosocial consequences such as cardiovascular disease, depression and anxiety (Azarbad & Gonder-Frederick, 2010; World Health Organization, 2015).
Food insecurity and excess body weight coexists, especially among women. Mechanisms that have been suggested to explain the relationship between food insecurity and excess body weight include limited access to healthy and affordable foods in low income neighborhoods, fewer resources to practice physical activity, limited access to health care, and greater levels of stress, depression and anxiety (Franklin et al., 2012; Ivers & Cullen, 2011). For example, Becerra and colleauges used the 2007, 2009, and 2011-2012 CHIS to evaluate whether low food security and very low food security were significantly associated with past-month serious psychological distress (SPD) among Hispanic adults living in poverty (≤200% of the federal poverty level) (Becerra et al., 2015). These authors found that food insecurity in the Hispanic population was significantly associated with past-month serious psychological distress (SPD). Also, Heflin and collaborators (2005) showed that household food insufficiency has potentially serious consequences for low-income women's mental health. A study aimed to determine the association of individual-level food insecurity with mental health status across all global regions concluded that food insecurity was associated with poorer mental health and specific psychosocial stressors across global regions independent of socio-economic status (Jones, 2017). Hadley & Patil (2006) suggested three possible explanations for the relationship between food insecurity and depression and anxiety: first, food insecurity may be related to “poor diets” which in turn may lead to anxiety and depression. Second, food insecurity may produce feelings of inequality, which in turn may increase anxiety levels, and third women in that study, may have used expressions of food insecurity, as a way to manifest anxiety and stress.
In contrast, the evidence has shown mixed results (Kodjebacheva, Kruger, Rybarczyk, & Cupal, 2015) with regard to the relationship between depression and excess body weight; it seems to be that the relationship between depression/depressive mood and excess body weight may depend on gender, the severity of the excess body weight, race and age (Kodjebacheva et al., 2015; Onyike, Crum, Lee, Lyketsos, & Eaton, 2003). For example, Onyike et al. (2003) found that obesity was associated with past-month depression in women but was not significantly associated in men. Additionally, they suggested that obesity is associated with depression mainly among persons with severe obesity.
Stress and poor mental health may lead to excess body weight through different mechanisms (Kodjebacheva et al., 2015). First, stress-induced hormonal and metabolic changes may lead to higher levels of cortisol, which may, promote the accumulation of abdominal fat (Adam & Epel, 2007). Second, negative emotions may lead to unhealthy eating behaviors, such as higher consumption of sugar and energy-dense foods. A 2016 study in Costa Rica found that both food insecurity and excess body weight led women to feelings of discouragement. In turn, discouragement resulted in anxiety, which women perceived caused them to lose control and want to eat even without being hungry, especially foods that were sweet and high in carbohydrates and energy (Martinez-Jaikel & Frongillo, 2016). Finally, another possible explanation is that people who feel depressed may lose their motivation for practicing physical activity (Stults-Kolehmainen & Sinha, 2013).
Methods
Study Design:
We conducted a secondary analysis of the public use database of CHIS, 2014 that pertains to adults. The CHIS is a cross-sectional population health telephone survey that was conducted every other year between 2001 and 2011. When it became an annual survey, the data was collected continually over a 2-year cycle. The CHIS sample is representative of California’s non-institutionalized persons living in households. The sample design aims to 1) provide estimates for large, medium and small counties of the state, as well as, 2) provide estimates of the entire population of California, including its major racial and ethnic groups and several racial and ethnic subgroups. To accomplish both purposes, this survey uses a dual-frame, multi-stage sample design. It uses a dual-frame random digit dial (RDD) technique (i.e. it includes both traditional landline RDD and cell phone RDD sampling frames) to get a sample of telephone numbers in each geographic area. During the 2014 CHIS, the RDD sample was designed with 80% landline and 20% cellular phone numbers. The survey used 44 geographic areas, 41 of which were individual counties. The remaining three geographic areas were comprised of the state’s 17 smaller counties. These 44 geographic areas are representative of the entire state because all 58 counties of the state were included in the survey. To provide sub-county estimates for survey results, some counties (San Diego, Calaveras, Siskiyou, and Tuolumne) were oversampled. As a multi-stage sample design, the survey first selected residential telephone numbers to sample households from each geographic area, and, second, randomly assigned one adult of each selected household to answer the questionnaire (UCLA Center for Health Policy Research, 2012).
3.2 Study Population:
Our analytic sample was restricted to CHIS respondents who self-identified as Latino. The U.S. Office of Management and Budget (OMB) defines "Hispanic or Latino" as “a person of Cuban, Mexican, Puerto Rican, South or Central American, or other Spanish culture or origin regardless of race”(United States Census, 2018). Missing data on items were minimal because the CHIS used two imputation procedures to fill in missing responses for items needed for weighting the data (see http://healthpolicy.ucla.edu/chis/Pages/default.aspx for additional information). After the imputation procedures, our sample size was 3,793. We deleted 14 missing values (0.37% of the total population) using case-wise deletion, all of which were on the variable measuring severe psychological distress (SPD) in the last month. Our final sample size totaled 3,779.
3.3 Data Collection
The data collection was conducted by Westat-a private firm specializing in statistical research and large-scale surveys-under contract with the UCLA Center for Health Policy Research. The data were collected between February 2013 and early January 2015, with half of the interviews conducted in 2013 and half in 2014. The 2014 CHIS survey was conducted in many languages-English; Spanish; Chinese, including Cantonese and Mandarin; Vietnamese; Tagalog and Korean-with the purpose of representing the diversity of the entire California population in the survey. The 2014 CHIS includes questions that are shared across age groups and other questions that are specific for each age group: children, adolescents and adults. An average adult interview was completed in around 36 minutes.
3.4 Measures
Excess Body Weight : Respondents self-reported their height and weight, which was then used to construct a measure of BMI. We categorized respondents as having excess body weight if their BMI was ≥ 25kg/m2.
Household Food Insecurity: The CHIS assessed household food security using the six-itemed tool which is a short form of the United States Department of Agriculture Household Food Security Module (Blumberg, Bialostosky, Hamilton, & Briefel, 1999). According to CHIS protocol, study participants who were above 200% federal poverty level (FPL), was coded as “food secure”. People living below 200% of the FPL were asked the following questions that refer to the past 12 months. 1) “The food that (I/we) bought just didn’t last, and (I/we) didn’t have money to get more; 2) “(I/We) couldn’t afford to eat balanced meals ; 3) “In the last 12 months, did you or other adults in your household ever cut the size of your meals or skip meals because there wasn’t enough money for food?”; 4) “How often did this happen?”; 5) “In the last 12 months, did you ever eat less than you felt you should because there wasn’t enough money to buy food?”; and 6) “In the last 12 months, were you ever hungry but didn’t eat because you couldn’t afford enough food?”. Responses of ‘sometimes true’, ‘often true’ to questions 1 and 2, ‘almost every month’, ‘some months but not every month’ to question 4 and ‘yes’ to questions 3, 5 and 6, were coded as affirmative. Each affirmative response was scored as “1”. The six items were summed, and the households were classified as: less than two affirmative responses indicated food security and two or more, food insecurity. The scale demonstrated good internal reliability (Cronbach’s α = 0.94).
Severe Psychological Distress (SPD): The self-reported Kessler-6 (K6) scale was used to measure SPD in the last month. This validated scale (Kessler et al., 2002) contains 6 questions about anxiety and depressive symptoms during the past month: 1) “About how often during the past 30 days did you feel nervous?”; 2) “During the past 30 days, about how often did you feel hopeless?”; 3) “During the past 30 days, about how often did you feel restless or fidgety?”; 4) “How often did you feel so depressed that nothing could cheer you up?”; 5) “During the past 30 days, about how often did you feel that everything was an effort?”; 6) “During the past 30 days, about how often did you feel worthless?” The response categories ranged from 1= “all of the time" to 5=" none of the time." The six items are summed to yield a number between 0 and 30 (Cronbach’s α = 0.84). The K6 score of ≥13 was operationalized as a serious mental illness (Prochaska et al., 2012).
Other covariates: Age was a continuous variable measured in years. Gender was self-reported (male versus female). Latino ethnicity was defined as Mexican or other Latino ethnicities. Marital status was categorized as living with a partner or not living with a partner. Working status was coded as employed or unemployed. Educational attainment was categorized as less than high school, high school, or more than high school. Participation in a food stamp program or SNAP was coded as yes versus no.
3.5 Data Analysis
Analyses were survey- weighted and conducted using Stata version 14.1 (StataCorp,L.P., 2016). Descriptive statistics are presented as means and standard errors (se) or percentages. To determine the distribution of food security and food insecurity by each population characteristics, we conducted bivariate analyses. We estimated the association between food insecurity and excess body weight using logistic regression after adjusting for potential confounders: marital status, educational attainment, age, participation in SNAP, ethnicity, working status and country of birth. In Model 1, we tested for moderation, which examines if the relationship between food insecurity and excess body weight varies by gender. We included the variable female and an interaction term between gender and food insecurity (female x food insecurity). In Model 2, we additionally included psychological distress to examine its role as a mediator in the relationship between food insecurity and excess body weight. Because mediation analysis includes testing the relationship between independent and dependent variable, accounting for the influence of a third variable (Lockwood, DeFrancesco, Elliot, Beresford, & Toobert, 2010), Stata’s khb command was used to compare the estimated coefficients between both models and perform the Sobel Test when assessing mediation.
Results
4.1 Sample Characteristics
One-quarter of our study sample were food insecure (Table 1), and about 74% reported excess body weight. The mean score in the K-6 scale was 4.1. On average, 12% of the sample received food stamps benefits. Slightly more than half of the sample were women; the mean age of respondents was around 38 years old. Most respondents were of Mexican descent, lived with a partner, and were employed full-time. Around 66% of the population surveyed had a high school diploma or a higher education.
Table 1. Sample’s characteristics of Latino Population (n= 3,779). Weighted Data, California Health Interview Survey, 2013-2014.
| Variables | Mean (se) | Percentage (%) |
|---|---|---|
| INDEPENDENT VARIABLE | ||
| Food Security Status | ||
| Food Secure | 75.0 | |
| Food Insecure | 25.0 | |
| DEPENDENT VARIABLE | ||
| Not excess body weight ( BMI<25) | 26.7 | |
| Excess Body Weight (BMI >25) | 73.3 | |
| MEDIATOR | ||
| Psychological Distress in the last month | 4.1(0.13) | |
| CONTROL VARIABLES | ||
| Female | 50.4 | |
| Age, years | 38.7 (0.30) | |
| Latino Ethnicity | ||
| Mexican | 79.5 | |
| Other | 20.5 | |
| Marital Status | ||
| Living with partner | 55.7 | |
| Not living with a partner | 44.3 | |
| Place of Birth | ||
| U.S. | 44.2 | |
| Outside U.S. | 55.8 | |
| SOCIO-ECONOMIC | ||
| Working Status | ||
| Employment | 62.3 | |
| Unemployed | 33.7 | |
| Educational attainment | ||
| Less than High School diploma | 33.9 | |
| High School Diploma | 29.3 | |
| More than High school | 36.8 | |
| Food Stamp Participation, Yes | 12.1 | |
| Notes: Means and standard errors are presented for continuous variables; percentages are shown for categorical measures. | Source: Own Elaboration, 2015 |
4.2 Bivariate Analysis
We found significant differences between the mean score of psychological distress in the last 30 days at the two different levels of food insecurity (3.6 food security vs 5.6 food insecurity, p<0.05) (Table 2). We did not find any significant differences in average BMI at different food insecurity levels. We found significant differences in food insecurity with most of the control variables, except with age, marital status, and Latino ethnicity. There were more women experiencing food insecurity than men (50.4% vs 40.7%). There were more food insecure people unemployed than food secure people are (41.9% vs 31.3%). People with food security had higher educational attainment than food insecure ones (41.5% vs 22.8%). More people with food insecurity participated in a SNAP than food secure people (24.1 % vs 8.1%).
Table 2. Bivariate associations by food insecurity levels. Latino Population (n= 3,779). Weighted Data, California Health Interview Survey, 2013-2014.
| Variables | Food Security | Food Insecurity |
|---|---|---|
| % or Mean (se) | % or Mean (se) | |
| DEPENDENT VARIABLE | ||
| Not excess body weight ( BMI<25) | 27.7 | 23.6 |
| Excess Body Weight (BMI >25) | 72.3 | 76.4 |
| MEDIATOR | ||
| Psychological Distress in the last month b) | 3.6(0.1) | 5.6 (0.3) |
| CONTROL VARIABLES | ||
| Gender | ||
| Female | 47.4 | 50.4 |
| Male | 52.6 | 40.7 |
| Age, years | 38.7(0.5) | 38.6(0.7) |
| Latino Ethnicity | ||
| Mexican | 79.4 | 79.8 |
| Other | 20.6 | 20.2 |
| Marital Status | ||
| Living with partner | 55.6 | 56.3 |
| Not living with a partner | 44.4 | 43.7 |
| Place of Birth a) | ||
| U.S. | 50.6 | 25.2 |
| Outside U.S. | 49.4 | 55.8 |
| SOCIO-ECONOMIC | ||
| Working Status a) | ||
| Employment | 68.7 | 58.9 |
| Unemployed | 31.3 | 41.9 |
| Educational attainment a) | ||
| Less than High School diploma | 29.3 | 47.5 |
| High School Diploma | 29.2 | 29.7 |
| More than High school | 41.5 | 22.8 |
| Food Stamp Participation a) | ||
| Yes | 8.1 | 24.1 |
| No | 91.9 | 75.9 |
| Chi-square, p<0.05 F-Test, p<0.05 |
Source: Own Elaboration, 2015
4.3 Multivariate Regression Analysis
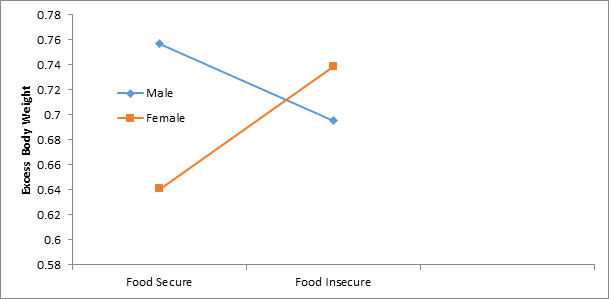
The relationship between food insecurity and excess body weight was positive and significant among women, but not significant among men after adjusting for marital status, educational attainment, age, participation in SNAP, Latino ethnicity, working status and country of birth (Table 3, Model 1). Additionally, after controlling for marital status, educational attainment, age, participation in SNAP, Latino ethnicity, working status and country of birth, food insecurity was inversely associated with the predicted probability of excess body weight for men, though this relationship was not significant. In contrast, for food insecure women the predicted probability of excess body weight was higher than for food secure women. We found a crossover effect; i.e., the slope of the relationship for men is negative, while for women it is positive (Figure 2).
Notes: Adjusted by marital status, educational attainment, age, participation in SNAP, Latino ethnicity, working status and country of birth.
Source: Own Elaboration, 2015
Figure 2: Level of predicted excess body weight by food insecurity or food security for male and female. Latino Population, California Health Interview Survey, 2013-2014
To test whether psychological distress is a mediator, we estimated a regression model, and psychological distress was positive and significant associated with food insecurity (b=2.36, se=0.44, p=0.01); however, Model 2 shows that the variable psychological distress in the last month is not statistically significant. In other words, psychological distress was not related to excess body weight i.e. it was not working as a mediator in the relationship. The Sobel Test confirmed our results: the difference between Model 1 (reduced model) and Model 2 (full model) was not statistically significant.
Table 3 Coefficients from Logistic Regression Models predicting excess body weight for Latino Population (n= 3,779), Weighted Data, California Health Interview Survey, 2013-2014
| Variables | Excess Body Weight | |
|---|---|---|
| Model 1 a | Model 2 b | |
| b(SE) | b(SE) | |
| INDEPENDENT VARIABLE | ||
| Food Security Status | ||
| Food Secure c. | ---- | ---- |
| Food Insecure | -0.31(0.30) | -0.36(0.32) |
| CONTROL VARIABLES | ||
| Age, years | 0.02 (0.00)** | 0.02(0.00)* |
| Latino Ethnicity | ||
| Mexican c. | ---- | ---- |
| Other | -0.29(0.16) | -0.30(0.16) |
| Marital Status | ||
| Living with partner c. | ---- | ---- |
| Not living with a partner | -0.38(0.15)* | -0.39 (0.15)* |
| Place of Birth a) | ||
| U.S. c. | ---- | ---- |
| Outside U.S. | -0.13 (0.16) | -0.12(0.16) |
| SOCIO-ECONOMIC | ||
| Working Status | ||
| Unemployed c. | ---- | ---- |
| Employment | 0.19(0.15) | 0.21 (0.15) |
| Educational attainment | ||
| Less than High School diploma c. | ---- | ---- |
| High School Diploma | -0.50 (0.16 )** | -0.47(0.17)* |
| More than High school | 0.61(0.20)** | -0.59 (0.20)* |
| Food Stamp Participation | ||
| No c. | ||
| Yes | 0.42(0.25) | 0.43(0.26) |
| MODERATOR | ||
| Female d. | -0.56 (0.15)** | -0.57(0.15)** |
| Female X Food Insecurity | 0.77(0.36)* | 0.79(0.37)* |
| MEDIATOR | ||
| Psychological Distress in the last month | ---- | 0.018(0.02) |
| Intercept | 1.14(0.31) | 1.05(0.32 ) |
| a Adjusted for marital status, educational attainment, age, participation in SNAP, Latino ethnicity, working status and country of birth. b: Model 1 adding psychological distress in the last month c. Reference Group | d. Men is the reference group | *p<0.05 **p< 0.01 |
Source: Own Elaboration, 2015
Discussion
We examined the relationship between food insecurity, psychological distress and excess bodyweight in Latino populations in California. Overall, there was no relationship between food insecurity and excess body weight in the Latino populations, but we found this relationship among Latinas (Hypothesis 1). Thus, as we hypothesized (Hypothesis 2) the relationship between food insecurity and excess body weight varies by gender. We found that psychological distress was related to food insecurity but not with excess body weight; hence, we did not found any evidence for mediation (Hypothesis 3).
According to United States Department of Agriculture (USDA), in 2014 about 22.4% of Latino population were food insecure in the U.S (USDA, 2014). This is consistent with our study, in which around 25% of the people had food insecurity but significantly higher than the US average (14%) ( Rabbit, Coleman-Jensen, Gregory & Singh (2016). As reported by the US Department of Health and Human Service, 78.8% of women with Hispanic origin were overweight or obese between 2013 and 2018. Our study also had similar findings (74%) (National Center for Health Statistics, 2019).
We did not find a relationship between excess body weight and food insecurity across the whole Latino population because we found a crossover interaction. The moderation by gender allowed us to find a positive relationship in women. Finding the relationship between food insecurity and excess body weight in Latino women, but not Latino men was expected because the relationship between food insecurity and excess body weight has been found for women, but not men in many studies (Adams et al., 2003; Kac et al., 2013; Pan et al., 2012; Townsend et al., 2001). The significant relationship between food insecurity and excess body in only women could be due to several reasons. First, women are more vulnerable to the cycles of deprivation and overeating. That is, when there is not enough food, they sacrifice their own food intake to safeguard their children and husbands, who work outside the home, from hunger. On the other hand, when the food is available, they tend to overeat (Aguirre, 2000; Food Research & Action Center, 2015). Additionally, women face socio-economic disadvantages and excess body weight is a physiologically regulated response to limited food supply which occurs commonly in socio-economically disadvantaged populations (United Nations Development Program, 2015). Women also may have heavier social burdens that lead them to feel depressed and anxious and leave them little-to-no time for self-care, exposing them to a higher risk of excess body weight (Martinez-Jaikel & Frongillo, 2016; Peña, Bacallao, Pan American Health Organization, & Pan American Sanitary Bureau, 2000; World Health Organization, 2016). Consistent with our findings, a study based on the 2011-2012 CHIS found household food insecurity was associated with overweight and obesity among Mexican-American women but not among Mexican-American men or Non-Mexican group, suggesting that country of origin and gender may influence the associations between household food insecurity and excess body weight (Smith, Colón-Ramos, Pinard, & Yaroch, 2016).
We found that psychological distress did not mediate the relationship between food insecurity and excess body weight, but food insecurity and psychological distress were significantly associated. It is also in accordance with previous studies (Becerra et al., 2015; Castañeda et al., 2016; Hadley & Patil, 2006; Heflin, Siefert, & Williams, 2005). Even though it is conflicting with some previous research that has found a relationship between excess body weight and depression and anxiety (de Wit et al., 2010; Luppino et al., 2010; Pan et al., 2012).
This finding also differs from other studies that have found this relationship in women or the Latino population. A study (Heo, Pietrobelli, Fontaine, Sirey, & Faith, 2005) found that the prevalence of a depressive mood within the previous month among U.S. adults was very high among young women who had excess body weight compared to young women who did not have excess body weight and this was especially prominent among Hispanic women. Another study (Bay-Cheng, Zucker, Stewart, & Pomerleau, 2002) concluded that femininity, weight concern and depressive symptoms were positively inter-correlated among Latino women. Some authors (Kodjebacheva et al., 2015; Lewis-Fernández, Das, Alfonso, Weissman, & Olfson, 2005) have even argued that Latinas may have reduced access to mental health care. Thus, their depressive symptoms may remain untreated or inadequately treated for a long time, which consequently could lead to excess body weight.
We propose explanations for these results: First, the excess body weight in Latino women in California is greater than 75%, so it is possible that having excess body weight does not affect their psychological distress because to have excess body weight could be the norm and not the exception. Second, the negative perception of obesity may vary across cultures. For example, a study (Jáuregui Lobera, M Plasencia, Rivas Fernández, Rodríguez Marcos, & Gutiérrez Ferrer, 2008) found that the perceptions about people with excess body weight were more negative in people from Spain than in people from Cuba.
These perceptions may depend not only on ethnicity but also on the level of acculturation. For example, a study (Lopez, Blix, & Blix, 1995) compared perceptions of body image in Hispanic and White women with lower socio-economic status by assessing their selection of silhouette. White and Hispanic women born in the U.S. or emigrated before age 17 years reported a similar degree of body dissatisfaction. On the contrary, Hispanic women who were born outside the U.S. and emigrated after age 17 years chose larger silhouettes as their ideal body image and reported less body dissatisfaction. Around half of our sample was born outside the U.S. so their ideal body image may be closer to their country of origin. Third, the perceptions about the excess body weight may be different among high- income and low-income populations, especially for women. Aguirre (2000) suggested that for the high income-professional women her body is part of her own value, thus they care for them in different ways: they practice exercise, eat healthy and use surgical procedures. For these women being “slim” allows them to fit in the society, meeting the criteria of health and beauty. On the contrary, poor women’s bodies are devaluated work tools, except when supporting the social value of motherhood. For their social class, the perception of beauty is to have a “strong” body, thus she does not need to meet the expectations of “thinness” of the high-income populations. Even for low-income populations, having excess weight may be a sign of prosperity, social status and wealth (Gutiérrez-Fisac, 1998). Finally, in our sample seven percent of Latino women had psychological distress, so it is difficult to detect significant statistical differences due to the lack of variability.
5.1 Strengths and Limitations
Strengths of this study are relatively large sample size, inclusion of non- English-speaking Latinos, few missing values, and the use of reliable scales to measure food insecurity and psychological distress, however, K6 scale, as currently used, may fail to capture individuals struggling with more moderate mental distress (Prochaska et al., 2012). Also, feelings like “restless”, “fidgety”, “depressed” or “worthless” may be perceived differently by different individuals.
On the other hand, the self-reported height and weight may have led to a misclassification of excess weight in some study participants, because individuals with excess weight tend to underestimate their weight and overestimate their height (Bowie, Juon, Rodriguez, & Cho, 2006; Kuczmarski, Kuczmarski, & Najjar, 2001; Rowland, 1990). Moreover, other self-reported data, including self-identified as Latino, may have increased the chance of reported biases. Additionally, the survey only includes people in households and with phones, thus some disadvantaged populations that may be food insecure could have been excluded. Our study is based on the cross-sectional data and future studies based on longitudinal may be helpful to determine the causality. Finally, this survey is representative of the Latino population in California; thus, it may not be generalizable to other Latino populations or populations of another ethnic group.
Conclusions
Our findings suggests that food insecurity and obesity coexist in Latino women. In addition, psychological distress is positively related with food insecurity but it did not appear to be a mediator in the food insecurity-body weight association in this sample. These results have important implications for public health.
The Latino population is the single largest minority group in the U.S. and face significant disparities (Ramirez & De La Cruz, 2003). Moreover, people with food insecurity showed greater levels of psychological distress than food secure ones. Women deserve special attention due to the positive association between food insecurity and excess body weight. Additional research in other ethnicities and Latino populations of other geographical areas is needed to determine whether psychological distress is a mechanism between food insecurity and excess body weight, and whether this mechanism is dependent on race /ethnicity or severity of the excess weight.

