


 English (pdf)
 Article in xml format
 Article references
 Send this article by e-mail
 Cited by SciELO
  Similars in
SciELO
Similars in
SciELO  uBio
uBio 
 Permalink
Introduction
Network analysis is an important element in understanding the structure, function, and dynamics of ecological systems. These systems are complex because they involve relationships and interactions that are not easily quantifiable. However, progress has been made in understanding some interactions whose identity may change in space and time, such as food webs, patch dynamics, and population fluctuations (Anand et al., 2010). Although networks have provided fundamental representations of ecological complexity, they need to be extended to systematically and simultaneously capture these multifaceted interactions (Pilosof et al., 2017).
The importance of aquatic macroinvertebrates as indicators of environmental conditions lies in the benthic life form of these organisms, their longer life cycles compared other aquatic organisms like bacteria and algae, and their specialized adaptation to specific environmental characteristics (Castillo-Figueroa et al., 2018; Roldán-Pérez, 2016). These aspects become a response to the assessment of the space-time conditions of the environment in which they are found (National Academy of Sciences, 1988; Rosenberg & Resh, 1993). The energy and nutrient transfer in aquatic food webs depends mainly on the diversity, quality, and quantity of resources available in the system, as well as on the species composition, the number of individuals and their trophic relationships (Cummins et al., 2005).
Food webs are important in the ecological processes that occur in river ecosystems. As such, information on food web relations serve as a relevant part of the scientific basis for the planning and management of river ecosystems (Tamaris-Turizo et al., 2018). In the case of aquatic macroinvertebrate communities, these trophic relationships relate to life cycles, habitat choice, behavior, predation, and other factors (Chará-Serna et al., 2010).
The complexity involved in analyzing these interactions, especially the species classification and taxonomy in tropical rivers in Colombia, has prompted studies in fields such as functional ecology (Schmera et al., 2013; Schmera et al. 2017), whereby functional traits are assigned that allow the measurement of morphological, physiological or phenological characteristics at the individual level (Violle et al., 2007). In this respect, some authors have made advances in the analysis, study and functional classification of the aquatic insects feeding groups in the Neotropics (Chará-Serna et al., 2010; Ramírez & Gutiérrez-Fonseca, 2014; Tamaris-Turizo et al., 2018; Tomanova et al., 2006). This has improved the understanding of the predator-prey relationship function among organisms, and thereby the determination of the balance of the communities that inhabit a biotope.
In Colombia, the altitudinal variation influences the physicobiotic structure of the rivers because at short distances in the Colombian Andean it is possible to have changes in the biotopes and species composition. These changes are also accompanied by rheological variability due to the annual cycles of rainfall and dry seasons (Latrubesse et al., 2005). For example, in the rainy season the rivers are abundant and turbid, while in the dry season the rivers significantly reduce their flow and increase their transparency of water (Gutiérrez, 2018). Thus, spatial variability - meters elevation - and variability in time, i.e., annual rainfall cycle, influence the structure and functioning of aquatic macroinvertebrate.
According to Ramírez and Gutiérrez-Fonseca (2014), aquatic macroinvertebrates can be classified into six major categories. Scrapers (Sc) generally live attached to rocks and other substrates and feed on periphyton (algae, bacteria, and fungi). Piercers (Pc) feed mainly on vascular plants by cutting the tissue and consuming its fluid. Shredders (Sh) chew up plant and wood debris, breaking down large particles into smaller ones that can be assimilated by other organisms, and generally facilitating the organic matter decomposition process. Collectors (GC) can screen small particles, although, having smaller oral devices, they also feed on material that can be re-suspended in the water column. Filter feeders (Ft) remove particles from the water column; some may consume bacteria and suspended organic particles by filtering. Finally, predators (Pr) are those that can consume other organisms, some of which have mouth structures like jaws.
In ecology, the idea of modularity is widely used (Olesen et al., 2007; Ruiz-Toro et al., 2020). One application of it is to measure the degree of compartmentalization of food webs, which can be used to indicate the stability relations of communities. A network with high modularity would be considered as more resilient to external disturbances or changes because influences to a limited number of the parts would less intensely propagate throughout the network (Gauzens et al., 2015; Stouffer & Bascompte, 2011). The idea that a modular organization would be beneficial for the local stability of ecological communities and their ability to recover from small perturbations (Grilli et al., 2016).
The question that this paper seeks to answer is whether the altitudinal gradient and temporal variation influence the distribution and resistance of aquatic macroinvertebrate communities in a river basin. Therefore, this research aims to analyze the distribution of aquatic macroinvertebrates according to the altitudinal gradient in two rivers and a stream in the same basin in Antioquia, Colombia. This is done using ecological networks analysis and modularity as a response variable, to determine whether there are differences in the resistance characteristics of macroinvertebrate communities according to the typology of each river or stream.
Materials and methods
Study area and site characteristics: The study area is located in the department of Antioquia in Colombia (Fig. 1) and includes three different catchment areas: a micro-basin where the La Nitrera stream is located; an intermediate basin whose main drainage is the San Juan, between the municipality of Jardin and its mouth on the Cauca River in the place known as Peñalisa; and a section of the Cauca River forming a macro-basin, between the village of Bolombolo and the municipality of Caucasia in the North of the department.
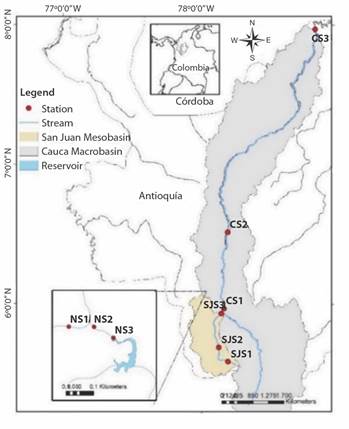
Fig. 1 Sampling site locations with the three streams: La Nitrera stream (NS1, NS2, NS3), San Juan River (SJS1, SJS2, SJS3) and Cauca River (CS1, CS2, CS3).
Three sampling stations were located at different altitudinal gradients at each study site. At each of the sites, the physicochemical, hydraulic, and biological variables were measured. La Nitrera stream is in the Southwest of the department of Antioquia, in the municipality of Concordia. Its source is 2 190 elevation meters, and it is one of the main tributaries of the reservoir located in La Nitrera protected area that supplies water to the municipality of Concordia. This natural park is classified as low mountain rainforest with a highly rugged topography (Morales-Quintero et al., 2019; Ruiz-Toro et al., 2020).
The San Juan River basin is in the Southwest region of the Department of Antioquia, with an area of approximately 1 400 km2, and elevations between 534 and 3 920 meters elevation San Juan River, within the classification of types of streams, can be classified as a river or mountain stream. The Cauca River originates in the Colombian Massif between the Western and Central Andes Mountains and has a drainage area of 59 000 km2, which represents 5 % of the national territory (Puertas et al., 2011).
The fluvial system of the Cauca River runs 1 350 km from its source in the Colombian massif (Cauca Department) to its mouth in the “Brazo de Loba” (Bolivar Department). The basin is polluted by mining, agro-industrial waste and wastewater treatment plants and hydroelectric activities, resulting in large amounts of sediments with heavy metals, xenobiotics, and cyanides along its path (López, 2013; Torres & Pinilla, 2011).Table 1 presents the geographical information on latitude, longitude, and altitude.
Field sampling collection: The information for site description was gathered at each of the nine stations (Table 1). Hydraulic and physicochemical data, as well as information on aquatic macroinvertebrates, were sampled. Each of these variables was repeatedly recorded. The fieldwork was carried out over dry (February, July), rainy (April, September) and transition (August, September) seasons.
Table 1 Geographic information
| Site | Longitude (North) | Latitude (West) | Altitude (m) |
| NS1 | 6°2.129’ | 75°56.026’ | 2 220 |
| NS2 | 6°2.139’ | 75°55.669’ | 2 183 |
| NS3 | 6°2.119’ | 75°55.951’ | 2 096 |
| SJS1 | 5°35’ 14’’ | 75°48’ 44’’ | 2 134 |
| SJS2 | 5°35’ 58’’ | 75°49’ 03’’ | 1 892 |
| SJS3 | 5°55’ 56’’ | 75°51’ 34’’ | 556 |
| CS1 | 5°58’ 31’’ | 75°50’14’’ | 555 |
| CS2 | 6°2.13’ | 75°56.026’ | 453 |
| CS3 | 6°2.14’ | 75°55.669’ | 50 |
Environmental and biological variables: The parameters measured in the field were: dissolved oxygen, electrical conductivity, pH, turbidity, and water temperature. WTW 3330 multiparametric cells were used for this purpose. The aquatic macroinvertebrates were collected with a Surber net of 0.09 m2 area placed against the current. Large material such as stones was extracted and the material in the quadrant was removed by hand, ensuring that the sediment and organisms remained in the net. This process was carried out for one minute in one of the margins of each stream. Also, a semiquantitative sampling using a triangular net was carried out in a 10 m section for five minutes and the sampling effort in each station was the same. The extracted material was separated in situ in plastic trays and later stored in plastic bottles with 70 % alcohol duly labeled with date, place, type of substrate, replica, responsible, to later be taken to the Laboratory of Sanitary Hydrobiology of the University of Antioquia.
All these measurements were taken in duplicate. Different substrates were chosen according to the station: leaf and rock for La Nitrera and rock for San Juan and Cauca. The extracted material was separated in situ in plastic trays and later stored in plastic bottles with 70 % alcohol, labeled with date, place, type of substrate, replicate, and person responsible. These were then transported to the sanitary hydrobiology laboratory of the University of Antioquia. In the laboratory, all samples of the organisms were determined to the lowest possible taxonomic level using taxonomic keys (Álvarez & Daza, 2005; Boltovskoy et al., 1995; Cummins et al., 2005; Domínguez & Fernández, 2009; Govedich & Moser, 2015; Lasso et al., 2018; Petersen, 2002; Ramírez & Gutiérrez-Fonseca, 2014; Roldán, 1988, Roldán, 2003; Thorp & Covich, 2009). A BST-606 stereomicroscope was used for this purpose.
Stomach analysis of functional feeding groups: The protocol proposed by Muñoz et al. (2009) in the trophic relationships chapter for the river ecosystem was used to analyze the stomach contents of aquatic macroinvertebrates (Elosegui & Sabater, 2009). The digestive analysis was performed for the most representative morphotypes (Table 2). From these three specimens were selected. This was to identify the food preference of each organism reported in the literature.
Table 2 Diversity indices in the three streams
| Index | Nitrera | San Juan | Cauca | ||||||
| Mean (x̅) | Standard deviation (σ) | Variance coefficient (VC) | Mean (x̅) | Standard deviation (σ) | Variance coefficient (VC) | Mean (x̅) | Standard deviation (σ) | Variancecoefficient (VC) | |
| Richness | 9.541 | 2.604 | 27.29 | 6.65 | 2.158 | 32.46 | 4.5 | 3.326 | 73.92 |
| Diversity | 1.812 | 0.283 | 5.66 | 1.329 | 0.387 | 29.18 | 0.979 | 0.738 | 75.41 |
| Evenness | 0.820 | 0.080 | 9.816 | 0.723 | 0.122 | 16.87 | 0.773 | 0.211 | 27.34 |
| Dominance | 0.198 | 0.080 | 40.47 | 0.354 | 0.164 | 46.25 | 0.407 | 0.348 | 85.41 |
For this analysis, the digestive material closest to the mouth was extracted with the help of dissection forceps and deposited on a slide before a drop of glycerol (85 %) was added. The sample was then homogenized with the assistance of a coverslip, and the observation was made under the inverted microscope, making an inventory of the material present in each plate (Muñoz et al., 2009). The observations were made with an inverted Boeco BIB100 microscope using the 40X (0.05 mm) objective, except for the Phylloicus, where the 10X objective was used.
Biomass determination: The biomass was determined in the sanitary hydrobiology laboratory by relative dry weight following the protocol of Puerta et al. (2009) his purpose, semi-quantitative sampling of La Nitrera stream was performed, integrating the biotopes (rock and leaf litter), which were then arranged in porcelain crucibles. Initially, the sample was filtered for 30 minutes, removing as much alcohol as possible. The organisms were then separated according to their functional feeding group and placed in an MF-2001 electric muffle furnace at 105 ºC for two hours. The fixed solids determination (inorganic matter) was then performed, first calcining the sample at 550 ºC for half an hour, then weighing the sample on a Shimadzu TX323L analytical balance with a sensitivity of 0.001 mg. This procedure was performed by replication. In this way, the volatile solids were determined via the difference in weight, indicating the available biomass that can be used as energy for higher-order organisms (Ruiz-Toro et al., 2020).
Modularity Analysis using ecological network: The modularity value was obtained through the software Gephi 0.9.2. This metric indicates the feeding relationships of the aquatic macroinvertebrates present in three rivers under altitudinal gradient distributions. This modularity value allows the determination of the clustering intensity degree of a network. This measures the quality of the resulting partitions and can have a scalar value between -1 and 1, with positive values indicating the possible presence of community structure. If the value is negative, it indicates a bad grouping (Blondel et al., 2008).
Gephi 0.9.2 software was used as an easily accessible tool for the representation and analysis of ecological networks (Bastian et al., 2009; Martin, 2015). This software was applied to the data of the functional feeding groups of the semi-quantitative sampling. The networks were made up of two components: the list of nodes that made up the network (functional feeding groups and morphospecies abundances) and a list of interactions between the nodes (biomass).
Analysis and processing of data: Descriptive analyses were performed using inferential statistics relating to the physicochemical, hydro morphological, and biological variables for each environment, considering averages, maxima, and minima, to visualize trends and extremes in each of the variables. The modularity associated with trophic interactions was used as a response variable. In this way, through multifactorial ANOVA of two factors, it was possible to determine whether there were significant differences associated with time or site of sampling. Finally, the diversity indices were determined through the Biodiversity Pro software.
Results
Abundance and ecological structure of aquatic macroinvertebrates: A total of 7 702 benthic macroinvertebrates were collected and identified, comprising 150 taxa. Smicridea. (N = 1 096) was the most abundant taxon in all streams, followed by Thraulodes sp. (N = 971) and Anacroneuria. (N = 576). In La Nitrera, the most abundant taxa were Smicridea and Phylloicus (N = 935 and 431). In the San Juan River, Thraulodes (N = 546) Traverella (N = 325) had the highest abundances in the Cauca River. Table 2 presents in terms of richness, La Nitrera had the highest mean value per station (x̅ = 9.5) followed by San Juan (x̅ = 6.6) and Cauca (x̅ = 4.5).
Analysis of stomach content and FFG assignment: Stomach contents of the most representative morphotypes were analyzed and grouped according to their feeding groups’ preferences. The material found was classified according to the nutrition types according to Cheshire et al. (2005). Classifications were as follows: FPOM (fine particulate organic matter, < 50 µm); CPOM (coarse particulate organic matter, 50 µm - 1 mm); OR (organisms’ remains); PA (periphytic algae); and PT (plant tissue, > 1 mm).
Table 3 presents comparative information with the FFG allocation found through the diet presented in the stomach analysis of some representative taxa from tropical rivers in this study, and that reported by previous authors.
12 taxa were analyzed. 5 taxa had FPOM in their stomachs; 7 taxa had CPOM; 8 had plant tissue; 4 had traces of organisms, and only one had periphytic algae. This made it possible to assign a feeding function to each of them. The findings for nearly 92 % of the groups are consistent with reports by authors such as (Ramírez & Gutiérrez-Fonseca, 2014).
Table 3 Diet and Feeding Functional Group of some taxa identified in this research and reported in the literature
| Taxa | Food diet | FFG in the current study | FFG reported in the literature |
| Traverella | FPOM, OR | CG, Pr | CG |
| Baetodes | FPOM, PT | Ft, Sc | Sc |
| Prebaetodes | FPOM | CG | CG |
| Lepthoyphes | CPOM, PT | CG, Sh | CG |
| Hetaerina | FPOM, CPOM, OR, PA, PT | Pr | Pr |
| Smicridea | PT | Ft | Ft |
| Phylloicus | CPOM, PT | Sh | Sh |
| Anacroneuria | CPOM, OR, PT | Pr | Pr |
| Chironomidae | CPOM | CG, Sh | CG |
| Simulium | FPOM, PT | Ft | Ft |
| Physa | CPOM, PT | Sc | Sc |
| Gammarus | CPOM, OR | Pr | Sh |
CPOM: Coarse particulate organic matter, FPOM: Fine particulate organic matter OR: Organism remins, PA: Periphytic algae PT: Plant tissue, CG: Collector gatherers, Pr: Predator, Ft: Filter feeder, Sc: Scrapers, Sh: Shredders.
Table 4 presents the summary of the multifactorial ANOVA relating the abundances of the functional groups to the hydrological season and altitude factors, as well as the interaction between these factors.
Table 4 Multifactorial variance analysis for the functional feeding groups
| MAIN EFFECTS | Ft | CG | Pr | Sc | Sh | |||||
| F | P Value | F | P Value | F | P Value | F | P Value | F | P Value | |
| A: Season | 0.49 | 0.6186 | 0.83 | 0.4444 | 0.48 | 0.6243 | 1.94 | 0.1583 | 0.76 | 0.4733 |
| B: Altitude | 4.70 | 0.0005 | 3.39 | 0.0051 | 5.14 | 0.0002 | 5.45 | 0.0001 | 4.75 | 0.0005 |
| AxB | 0.74 | 0.7394 | 0.24 | 0.9983 | 0.37 | 0.9809 | 1.88 | 0.0561 | 0.98 | 0.5002 |
These values show that statistically significant differences occur between FFG and Altitude. This last factor is directly related to the sampling site. The season does not appear to have a significant effect on the abundance of the functional feeding groups in the three streams.
Fig. 2 illustrates the spatial changes along the different basins studied. Pie charts, in different shades of gray, show the composition in percentages of the abundance of the functional feeding groups in the semi-quantitative sampling for each of the monitored stations. The numerical value in each segment of the pie chart corresponds to richness which, in the case of Nitrera, is higher than for the other two rivers. However, no differences are observed between the sampling stations in La Nitrera. Meanwhile, for the San Juan River, there is a variation of the FFG in each period. Filter feeders were abundant at the time, while collectors were abundant in the middle and lower parts.
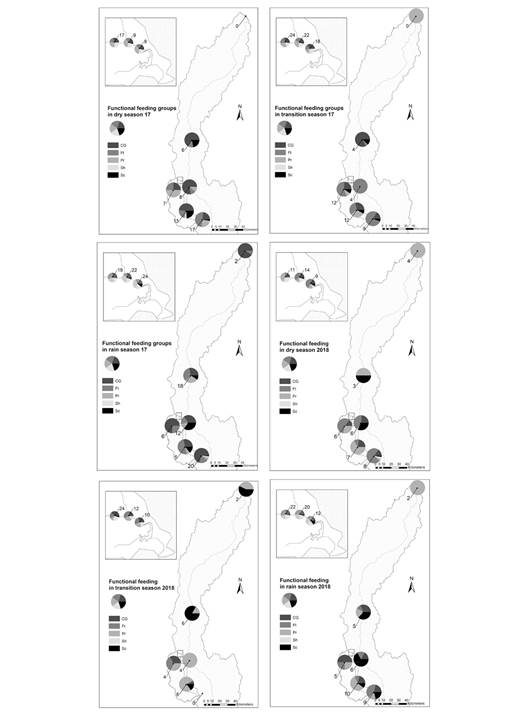
Fig. 2 Abundance and Richness distribution of the FFG following the altitudinal gradient in dry, transition and rainy seasons in 2017 and 2018.
The diagrams presented in Fig. 3 shows the configuration of the ecological network through the relationships of the FFG with the modularity value for each of the stations in September 2018.
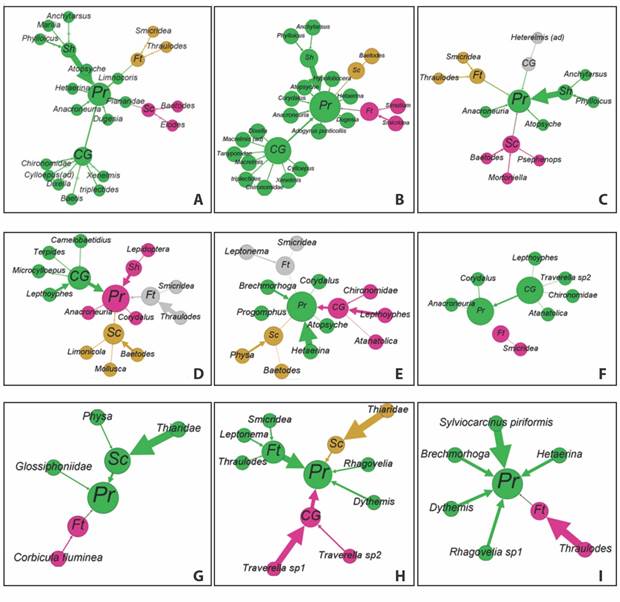
Fig. 3 Trophic relationship diagrams for September 2018 at the different stations for the three riverine scenarios using ecological networks. A. Nitrera S1 September 2018 B. Nitrera S2 September 2018 C. Nitrera S3 September 2018 D. San Juan S1 September 2018 E. San Juan S2 September 2018 F. San Juan S3 September 2018 G. Cauca S1 September 2018 H. Cauca S2 September 2018 I. Cauca S3 September 2018. Each color indicates the number of modules
In the case of La Nitrera, the number of nodes is higher due to the presence of a greater number of morphotypes compared to the other rivers. The Shredder have then greatest contribution of biomass in La Nitrera (Fig. 3A, Fig. 3B, Fig. 3C), while in the San Juan River it is from collectors (Fig. 3D, Fig. 3E, Fig. 3F). In the Cauca River, the contribution of biomass varies between stations. At the station (Fig. 3G), the main contribution is from scrapers, especially the Thiaridae family; at (Fig. 3H) it is from filter feeders although other groups contribute, while at CS3 (Fig. 3I) filter feeders were found as the only biomass contributors.
The analysis of variance components (AVC) using modularity as a dependent variable showed that the altitude is the factor that contributes most to the variance, with 65.49 %, followed by the season, with 27.57 %. Hence, a multifactorial ANOVA was carried out to establish whether there are statistical differences for each principal or interaction effect in each watercourse studied. Table 5 presents multifactorial ANOVA indicating significant statistics differences between season and La Nitrera modularity.
Table 5 Multifactorial variance analysis for Modularity
| MAIN EFFECTS | La Nitrera | San Juan | Cauca | |||
| F | Value P | F | Value P | F | Value P | |
| A: Season | 3.15 | 0.0720 | 4.14 | 0.0490 | 2.64 | 0.1124 |
| B: Altitude | 3.24 | 0.0678 | 6.18 | 0.0179 | 0.01 | 0.9912 |
| AxB | 0.52 | 0.7207 | 3.37 | 0.0542 | 0.08 | 0.9856 |
Fig. 4 shows the variation of the modularity values in the different hydrological periods. Fig. 4A and Fig. 4B corresponding to July, Fig. 4C and Fig. 4D corresponding to August. Finally, Fig. 4E and Fig. 4F corresponding to September in 2017 and 2018 respectively. The bars indicate the modularity value for each station. The shades of grey change according to the season. Spatial and temporal changes can be seen. The range of modularity in each figure varies from 0 to 1. If the value is closer to 1 then the degree of compartmentalization of the food web is greater, by contrast negative values indicate there are not a community structure base in the net. Nevertheless, all stations present a positive value. If the polygon remains spatially stable then it will close completely, which means that the modularity is homogeneous throughout the changes in elevation.
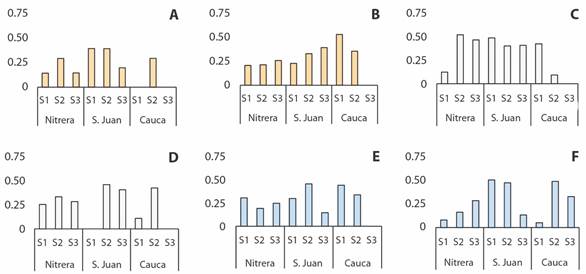
Fig. 4 Modularity value hydrologic periods: dry ( ), transition ( ), rainy ( ) in the three streams in 2017 and 2018. A. July de 2017 B. July de 2018 C. August de 2017 D. August de 2018 E. September de 2017 F. September de 2018.
The most compartmentalized months are July 2018 (Fig. 4B) and September 2018 (Fig. 4F). It is important to bear in mind that, by August 2018 (Fig. 4D), the sample of organisms could not be taken because of a flood in the river at the SJS1 station. August 2018 for SJS1, CS3 stations and July, August, and September of 2017 for CS3 station were not possible to calculate modularity value due to the low or no number of organisms.
Discussion
To the functional feeding groups analysis, the stomach determination show that fine organic matter was predominant, followed by organic matter in most of the digestive systems. There were some remains of organisms, generally mouthparts and antennae of Diptera sp. Additionally, there were plant structures (leaf litter, parts of internodes, seeds, shells, fibers, etc.). These results are in line with the statements of several authors that highlight the importance of FPOM as a dominant food for most aquatic invertebrates (Ferreira et al., 2015; Moore et al., 2004; Tamaris-Turizo et al., 2018).
In the lower altitude areas, the richness of species is significantly reduced due to the reduction in slopes and the topology of the rivers, which results in a greater amount of deposition, which does not promote the availability of substrates. In general terms, La Nitrera presents a great abundance of FFG, mainly in the rainy season, due to the high heterogeneity of microhabitats (Tamaris-Turizo et al., 2018). Ft and CG are the most abundant in this stream in 2017, and Pr in 2018. The results indicate that, for the San Juan River, there is no significant variation between the FFGs during the hydrological seasons. The predominant FFGs are CG in the rainy season and Pr in the dry season. A high variation of FFGs based on the gradient was expected. However, lower richness was observed in the Cauca River, which is mainly due to aspects reported by other authors such as the geomorphology of the river, the short length of the main channel and the steep slopes of the river (Tamaris-Turizo et al., 2018; Webster & Meyer, 1997). Another point to consider is the impact of human activities as the gradient decreases, which have a significant effect on the composition of aquatic organisms. Baumgartner and Robinson (2017) mention due to natural gradients (stream order, substratum, altitude, etc.) and the dendritic structure of river networks cumulative environmental factors affecting biotic assemblages are expected in human dominated sites.
The changes in the distribution of aquatic macroinvertebrates according to their FFG showed a statistically significant variation due to altitude, which is associated with the sampling altitude gradient. If the gradient is lowered, the abundance of these FFGs also decreases. This variation occurs due to factors such as biotopes colonization availability and increases in water turbidity and water temperature (Dallas, 2007). The utilization of the model of ecological networks using the modular structure showed that the stations that presented greater FFG, that is to say, a greater diversity of biotopes related to the number of ecological functions, may be able to buffer the propagation of disturbances, determining the resistance of these networks (Gauzens et al., 2015).
In the study, a variety of community responses were observed, depending on the type of stream and the intensity of hydrological alteration (Serna López et al., 2020). During the dry and rainy periods, the food webs had a smaller number of organisms, which can be seen in the modularity and compartmentalization of the webs. These aspects show how tributaries can influence longitudinal recovery trends (Mellado-Díaz et al., 2019). If a network has a high modularity degree, then this is reflected in the compartmentalization degree of the food webs. High modularity could indicate the network is resilient to external disturbances or changes.
As presented in the transition period, the potential recovery of aquatic communities along longitudinal gradients in the basin is maintained. The bars indicated that the transition period presented the highest modularity, which is due to the recolonization of some chorotypes resulting from the decrease in the bed speed. La Nitrera stream and the San Juan River presented higher values than the Cauca River, which may indicate that the altitudinal change affects the ecological network, presenting a greater degree of compartmentalization due to the number of nodes. Finally, this study represents a contribution to the analysis of aquatic macroinvertebrate communities through functional feeding groups, using the modularity of ecological networks along an altitude gradient in rivers in Colombia. Although further studies are required, it can be shown that the habitat conditions and changes in the configuration of the watercourses alter the stability of these relationships and reduce the species richness in low areas < 50 m.
Ethical statement: the authors declare that they all agree with this publication and made significant contributions; that there is no conflict of interest of any kind; and that we followed all pertinent ethical and legal procedures and requirements. All financial sources are fully and clearly stated in the acknowledgements section. A signed document has been filed in the journal archives.

