


 English (pdf)
 Article in xml format
 Article references
 Send this article by e-mail
 Cited by SciELO
  Similars in
SciELO
Similars in
SciELO  uBio
uBio 
 Permalink
Introduction
The expansion and intensification of agriculture causes profound changes at a global scale, including the degradation of agricultural soils, which generates a strong impact on crop productivity and consequently, a decrease in the biodiversity associated (De la Fuente & Suárez, 2008). The productivity of Ilex paraguariensis St Hil. (Aquifoliaceae), popularly known as “yerba mate”, is severely affected by soil degradation (Bergotini et al., 2017). This species is native to Argentina, Brazil, Paraguay and Uruguay in South America. It has been introduced in the world market (e.g. Middle East, Europe, and United States) due to its multiple nutritional benefits and antioxidant properties (Heck & De Mejia, 2007).
It is essential to preserve the physical, chemical and biological soil properties in an optimum state for their agricultural sustainability. Plants rely on their interaction with a wide range of soil microorganisms for growth and survival. The microbial interactions and the relationship with plant growth responses and nutrition in the rhizosphere have been widely studied (Larsen, Jaramillo-López, Nájera-Rincon, & González-Esquivel, 2015). The arbuscular mycorrhizal fungi (AMF) (Phylum Glomeromycota) (Schüßler, Schwarzott, & Walker, 2001) are one of the rhizosphere microorganisms symbiotically associated with plants, which promote key ecosystem services related to soil fertility, plant health, and nutrition (Gianinazzi et al., 2010).
The association of plants of I. paraguarensis with AMF, especially under field conditions, has been scarcely reported so far. Andrade, Queiroz, Hermes, and Oliveira (2000) registered the presence of mycorrhizal colonization in roots of this species in Santa Catarina (Brazil) and Bergottini et al., (2017) detected the presence of AMF with high throughput sequencing of its root-associated microbiome. In addition, Velázquez, Fabisik, Abarca, Allegrucci, and Cabello (2018) studied the arbuscular mycorrhizal colonization in I. paraguayensis plants growing under different crop conditions and in natural environments. However, so far there are few data available on the species composition of AMF communities under field conditions.
Numerous edaphic factors, such as changes in soil pH, humidity, and availability of nutrients, anthropogenic disturbances and seasonality affect the structure and dynamics of Glomeromycota communities (Smith & Read, 2008). Jefwa et al. (2012) demonstrated that changes in land use can affect the spore density of AMF, and the species richness and diversity of their communities. Besides soil disturbance, intrinsic factors related to AMF life strategies, host physiology and environmental conditions can also modify their sporulation patterns. Gai, Feng, Cai, Christie, and Li (2006) reported that the AMF sporulation is reduced under drought conditions, whereas Shi et al. (2006) consider that their sporulation does not follow a predictable pattern.
In Argentina, more than 60 % of the surface cultivated with yerba mate has serious problems of soil degradation due to inadequate agricultural practices maintained over time. Their recoveries demand not only the application of already developed technologies, but also the advance in research and innovations of existing tools. In this sense, AMF would play an important role. For this reason, it is necessary to know the composition of Glomeromycota communities and identify the factors that can affect their structure and dynamics. The aim of this work was to assess the species composition, richness, spore density and diversity of Glomeromycota communities of I. paraguarensis under different crop and natural conditions, seasonally over a 2-year period.
Materials and methods
Study area and Sampling sites: This study was carried out in the provinces of Corrientes and Misiones, Northeastern Argentina. In this region, the soils are typical Kandihumultes of the Ultisol Order, and the climate is classified as humid subtropical, according to the Köppen classification. Samples were collected from five productive sites of I. paraguarensis in Corrientes, with contrasting crop situations with regard to historical management. As a reference situation (situation 6), we used an area located in Misiones, with native trees of this species that grow spontaneously in the undergrowth forest. The chemical characterization of the sampling sites is found in Velázquez et al. (2018). The sampling sites corresponded to the following situations: i) Situation 1 (Y28) was implanted in 1928, with a density of 450 plants/ha, there is no fertilizer application and there is continuous weed control by harrow disc. An intensive harvest is carried out at this site and the soil showed extreme deterioration; (ii) Situation 2 (Y24) is the oldest crop, implanted in 1920, with a density of 600 plants/ha, no fertilizers applied. In the last 15 years, it has been managed sustainably, and the harvest is moderate; (iii) Situation 3 (CU) was implanted in 1958, with a density of 1 000 plants/ha. It has fewer extractive harvests than the previous situations and the disk harrow was replaced by chemical weed control 10 years ago. Fertilizers are applied alternatively depending on resource availability; (iv) Situation 4 (CN) was implanted in 1984, with a density of 2 600 plants/ha, fertilization with 300 kg/ha/year N:P:K, and mechanical harvest; (v) Situation 5 (L49) was implanted in 1992, with a density of 4 000 plants/ha, fertilization with 400 kg/ha/year of N:P:K, and mechanical harvest; and (vi) Situation 6 (NAT), correspond to native trees growing spontaneously in the rainforest and not exploited commercially.
Sampling: Samples of soil from the rhizosphere of I. paraguayensis plants were collected in winter (July-August) and summer (November-December), which are respectively the stages of lower and higher physiological activity of yerba mate, during the years 2013 and 2014. At situations 1-5, we defined three transects along the plantation lines, which constituted the repetitions. Each transect was separated from the other by 10 plantation lines. At each transect, we collected a composite sample that consisted of 5-6 subsamples of rhizosphere soil. In the case of situation 6 (NAT), the distance between repetitions was 100 meters. We collected a total of 72 samples (6 sampling situations x 3 repetitions x 2 seasons x 2 years).
In the productive sites (situations 1-5), the mean rainfall of the last 15 years was 1 923 mm, being the mean annual rainfall of 1 697 mm and 2 462.9 mm in 2013 and 2014, respectively. The mean temperatures at these sites were 20.7 °C and 20.8 °C for 2013 and 2014, respectively. In the case of situation 6 (NAT), the mean rainfall of the last 15 years was 1 995 mm, being the mean annual rainfall of 1 995.5 mm and 2 925 mm in 2013 and 2014, respectively. The mean annual temperatures at NAT for 2013 and 2014 were 20.9 °C and 20.7 °C, respectively. Fig. 1 shows the rainfall distribution during 2013-2014 in the sampling sites.
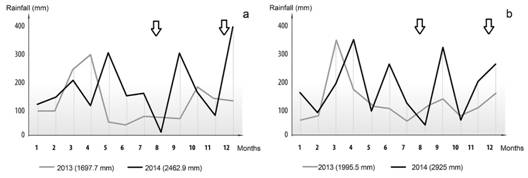
Fig. 1 Distribution of monthly rainfall (2013-2014). A. Situation 1-5, productive sites. B. Situation 6, native trees. The arrows indicate sampling dates.
Isolation and identification of AMF spores: Arbuscular mycorrhizal fungi spores were obtained from 100 g (dry weight) of each soil sample by wet sieving using sieves of different mesh sizes (450-105-75-30 μm), and decanting (Gerdemann & Nicolson, 1963). The supernatant was then centrifuged in a sucrose gradient (Walker, Mize, & Nabb, 1982). Arbuscular mycorrhizal fungi species were identified following original species descriptions, taxonomically accepted criteria (Blaszkowski, 2012) of INVAM (International Culture Collection of Arbuscular and Vesicular-Arbuscular Mycorrhizal Fungi: http://invam.caf.wvu.edu), and http://www.arbuscular-mycorrhiza.net/amphylo_home.html
The structure of AMF community was analysed by the species richness (S, total number of different AMF taxa present in a sample), abundance (number of spores of each taxon in the sample), frequency observed (percentage of samples in which a taxon is recorded), total density of spores (total number of spores recorded), and Shannon´s diversity index (H′; H′ = -∑pi ln pi, where pi is the relative abundance of the its species compared with the total of the species identified in the sample) (Magurran, 1988). All parameters were referred to 100 g of dry soil.
Statistical analyses: To evaluate the effect of the different sampling situations, seasons and years on the total spore density and diversity index, a multi-factor analysis of variance (ANOVA model I) followed by Tukey´s test (P ≤ 0.05) was used. All analyses were performed with InfoStat version 2012 (Di Renzo et al., 2012). A principal component analysis (PCA) was employed to explore the effect of years on the structure of AMF communities (MVSP, version 3.1).
Results
Twenty-three taxa of Glomeromycota belonging to 11 genera in the families Acaulosporaceae, Claroideoglomeraceae, Diversisporaceae, Entrophosporaceae, Gigasporaceae, Glomeraceae, and Pacisporaceae were recovered (Table 1).
TABLE 1 Mean spore abundance (number of spores/100g of dry soil) and frequency (F %) of each taxon of Glomeromycota obtained over the study period (2013-2014) and in the two seasons (winter-summer)
| Phylum Glomeromycota | 2013 | 2014 | |||||||||||||||||||||||
| Y28 | L49 | Y24 | CN | NAT | CU | Y28 | L49 | Y24 | CN | NAT | CU | F% | |||||||||||||
| Acaulosporacea | WIN | SUM | WIN | SUM | WIN | SUM | WIN | SUM | WIN | SUM | WIN | SUM | WIN | SUM | WIN | SUM | WIN | SUM | WIN | SUM | WIN | SUM | WIN | SUM | |
| Acaulospora bireticulata | 1 | <1 | 5 | 8 | |||||||||||||||||||||
| A. capsicula | 101 | 43 | 89 | 9 | 83 | 127 | 68 | 26 | 69 | 0 | 84 | 95 | 9 | 19 | 23 | 11 | 15 | 44 | 26 | 61 | 13 | 6 | 30 | 53 | 96 |
| A. denticulate | <1 | <1 | 4 | ||||||||||||||||||||||
| A. excavate | <1 | 5 | 4 | ||||||||||||||||||||||
| A. laevis | <1 | 2 | 2 | 4 | 2 | 1 | 2 | 2 | 29 | ||||||||||||||||
| A. mellea | 5 | 8 | 16 | 4 | 15 | 9 | <1 | 2 | 34 | 5 | 10 | 1 | 3 | 2 | 2 | 11 | 3 | 2 | 71 | ||||||
| A. rehmii | <1 | 4 | |||||||||||||||||||||||
| A. scrobiculata | 1 | 1 | 3 | 2 | 1 | 1 | 1 | 29 | |||||||||||||||||
| A. spinose | 1 | 4 | |||||||||||||||||||||||
| Acaulospora sp | <1 | 1 | 4 | ||||||||||||||||||||||
| Claroideglomeraceae | |||||||||||||||||||||||||
| Clareidoglomus claroideum | 2 | 4 | |||||||||||||||||||||||
| C. etunicatum | <1 | 2 | 84 | ||||||||||||||||||||||
| Diversisporaceae | |||||||||||||||||||||||||
| Diversispora spurca | 6 | 6 | 2 | 2 | 4 | <1 | 2 | 3 | 4 | 4 | 2 | 4 | 7 | 9 | 3 | 6 | 5 | 2 | 5 | 5 | 79 | ||||
| Entrophosporaceae | |||||||||||||||||||||||||
| Entrophospora infrequens | 1 | <1 | 4 | ||||||||||||||||||||||
| Gigasporaceae | |||||||||||||||||||||||||
| Gigaspora sp. | 2 | 5 | 13 | ||||||||||||||||||||||
| Racocetra fulgida | 3 | 2 | 1 | 1 | 21 | ||||||||||||||||||||
| Scutellospora Gilmore | 1 | 2 | 8 | ||||||||||||||||||||||
| Glomeraceae | |||||||||||||||||||||||||
| Funneliformis geosporum | 18 | 6 | 5 | 25 | |||||||||||||||||||||
| F. mosseae | 7 | 1 | 2 | 1 | 1 | 33 | |||||||||||||||||||
| Glomus microaggregatum | 1 | <1 | <1 | 2 | 2 | 33 | |||||||||||||||||||
| Glomus sp. | 21 | 7 | 8 | 11 | 3 | 7 | 19 | 1 | 7 | 28 | <1 | 3 | 4 | 12 | 92 | ||||||||||
| Rhizophagus clarus | 3 | 13 | |||||||||||||||||||||||
| Pacisporaceae | |||||||||||||||||||||||||
| Pacispora sp. | 2 | <1 | 4 | ||||||||||||||||||||||
| Total abundance | 147 | 88 | 130 | 32 | 126 | 164 | 97 | 47 | 146 | 26 | 154 | 107 | 25 | 32 | 46 | 38 | 16 | 56 | 57 | 82 | 12 | 10 | 41 | 72 | |
Site 1 (Y28); Site 2 (Y24); Site 3 (CU); Site 4 (CN); Site 5 (L49) and Site 6 (NAT). The data correspond to the mean of three replicate.
All families were recovered throughout the 2-year period in at least one of the sampling sites (Table 2). Acaulosporaceae and Glomeraceae presented the highest spore densities in all sampling sites/ seasons/years. The rest of the families were scarcely represented, and some of them were present at only one sampling site per year. Six of the seven families were recorded during the first year (2013), in which Entrophosporaceae and Pacisporaceae were absent only in winter and summer, respectively. The lowest spore density was recorded in winter 2014, which is consistent with the lowest diversity of families found at this sampling date, due to the absence of Claroideoglomeraceae, Entrophosporaceae, and Gigasporaceae. Entrophoporacae was the only family not reported in summer 2014.
TABLE 2 Spore number for members of the families Acaulosporaceae, Claroideoglomeraceae, Diversisporaceae, Entrophosporaceae, Gigasporaceae, Glomeraceae, and Pacisporaceae over the study period (2013-2014) and in the two seasons (winter-summer).
| Spore number of the Glomeromycota families | 2013 | 2014 | ||||||||||||||||||||||
| Y28 | L49 | Y24 | CN | NAT | CU | Y28 | L49 | Y24 | CN | NAT | CU | |||||||||||||
| WIN | SUM | WIN | SUM | WIN | SUM | WIN | SUM | WIN | SUM | WIN | SUM | WIN | SUM | WIN | SUM | WIN | SUM | WIN | SUM | WIN | SUM | WIN | SUM | |
| Acaulosporaceae | 108 | 51 | 108 | 21 | 100 | 135 | 74 | 19 | 105 | 13 | 98 | 96 | 9 | 22 | 32 | 11 | 15 | 46 | 30 | 72 | 16 | 8 | 32 | 55 |
| Claroideoglomeraceae | 1 | 2 | 1 | |||||||||||||||||||||
| Diversisporaceae | 6 | 6 | 2 | 2 | 4 | 1 | 2 | 3 | 1 | 1 | 2 | 4 | 7 | 9 | 3 | 6 | 5 | 2 | 5 | 5 | ||||
| Entrophosporaceae | 1 | |||||||||||||||||||||||
| Gigasporaceae | 2 | 8 | 2 | 1 | 1 | 1 | 1 | 1 | ||||||||||||||||
| Glomeraceae | 31 | 23 | 17 | 9 | 23 | 21 | 21 | 18 | 39 | 10 | 52 | 9 | 13 | 5 | 7 | 19 | 1 | 7 | 28 | 3 | 4 | 2 | 5 | 12 |
| Pacisporaceae | 3 | 1 | ||||||||||||||||||||||
Site 1 (Y28); Site 2 (Y24); Site 3 (CU); Site 4 (CN); Site 5 (L49) and Site 6 (NAT).
Three species, Acaulospora capsicula (96 %), Glomus sp. (92 %), and Diversispora spurca (79 %), showed frequencies higher than 50 % and were registered in all sampling situations. Acaulospora capsicula is recorded for the first time in Argentina. Acaulospora denticulata, A. excavata, A. rhemii, A. spinosa, Acaulospora sp.1, Funneliformis geosporum, and Rhizophagus clarum were recorded with low frequency only during the first year of sampling, whereas Claroideoglomus claroideum and Scutellospora gilmorei were only found during the second year.
The total number of spores was significantly higher in 2013 than in 2014 (F = 24.7, df = 1, P = < 0.0001). No significant differences in the spore number were found between seasons or sampling sites (F = 3.51, df = 1, P = 0.067 and F = 1.3, df = 5, P = 0.2785, respectively). Significant differences were recorded only in the interaction Year x Season (F = 8.84, df = 1, P = 0.0046), with the highest numbers in winter 2013.
Fig. 2 shows the diversity index (H’) and the species richness (S) analysed by sampling site/seasons/years. Both indices showed higher values in 2013 (xH’ = 0.95 and xs = 4.5) than in 2014 (xH’= 0.77 and xs = 3.11), but only the species richness (S) was significantly different between years (F = 19.08, df = 1, P = 0.0001).
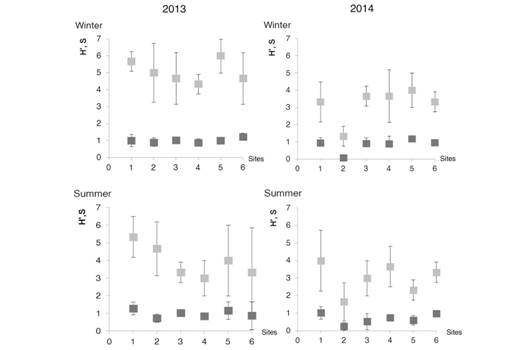
Fig. 2 Shannon´s diversity index (H’) and species richness (S) of Glomeromycota over the study period (2013- 2014) and in the two seasons (winter-summer). Site 1 (Y28); Site 2 (Y24); Site 3 (CU); Site 4 (CN); Site 5 (L49) and Site 6 (NAT). (Species richness; Shannon´s diversity index). The data correspond to the mean of three replicates.
Not significant differences were detected in H’ and S index at sites (F = 2.77, df = 5, P = 0.02 and F = 2.15, df = 5, P = 0.07 respectively). The H’ and S index was great in Y28 (xH’ = 1.08 and xs = 4 respectively) and the lowest in Y24 (xH’ = 0.5) and L49 (xs = 2).
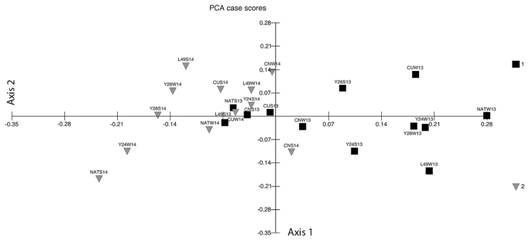
The PCA biplot (Fig. 3) showed that 52 % of the total variation was explained by the first two axes, which separated the samples into two groups on opposite sides of the graph according to the years (2013 on the right and 2014 on the left). The species A. capsicula, A. mellea, F. geosporum and Glomus sp. correlated positively with the first axis (0.48, 0.60, 0.43 and 0.34 respectively) and were associated to 2013 samples, while G. microaggregatum showed a negative correlation (-0.31) whit axis 1 and was associated to 2014 samples.
Discussion
In this study, 23 taxa of AMF were reported from the rhizospheric soil of I. paraguarensis plants, considering all sampling situations during the 2 year-period. This number is lower than that reported for protected areas (Palenzuela, Ferrol, Boller, Azcón-Aguilar, & Oehl,2008; Velázquez, 2010), but it is similar to that registered for agricultural soils (Oehl et al., 2003). The taxa recorded belong to seven families of Glomeromycota. The families Acaulosporaceae and Glomeraceae were present in all crop situations/seasons/years and showed the greatest numbers of species (Acaulosporaceae: 10, Glomeraceae: 5). These two families are often cited as contributing the most to the AMF total diversity in protected areas, natural ecosystems, and agricultural soils. It is important to note that Clareideoglomus claroideum and C. etunicatum, which were identified in the present study and are currently within the Claroideoglomeraceae (Schüßler & Walker, 2010), were considered in the Glomeraceae by previous studies, and therefore, contributed to the density of this family. A 75.7 % of the Acaulosporaceae reported for science have been found in protected areas and natural environments (Velázquez et al., 2008; Turrini & Giovannetti, 2012), whereas Glomeraceae have been registered mainly in agricultural soils (Jansa et al., 2002; Oehl et al., 2003). Aidar, Carrenho, and Joly (2004) and Stürmer and Siqueira (2011) suggested that Glomeraceae have a wide range of tolerance to environmental conditions and ecosystem disturbances and therefore, can be considered as generalists.
Entrophosporaceae, Gigasporaceae, and Pacisporaceae showed a low frequency, and their presence was occasional in the different crop situations/seasons/years, without showing any tendency. According to Lovelock and Ewel (2005), the distribution patterns of the relative abundances of fungal species are difficult to interpret, because there is not enough data on the ecology and physiology of most species. Among the species identified, the frequencyof A. capsicula, Glomus sp. and D. spurca was higher than 50 % and were recorded in all crop situations/seasons/years analysed. Acaulospora capsicula is a new record for Argentina and South America. This species was originally described from the rhizosphere of Ficaria verna growing in a forest in northern Poland (Blaszkowski, 1990) and posteriorly, Schultz, Bever, and Morton (1999) found A. capsicula together with D. spurca associated with Juncus conglomeratus, Salix triandra,Thuja occidentalis, and Triticum aestivum, in the campus of Duke University, North Carolina. Diversispora spurca has been commonly reported worldwide, with already 20 records for South America. These two species together with Glomus sp., are included within the families Acaulosporaceae (A. capsicula), Diversisporaceae (D. spurca), and Glomeraceae (Glomus sp.), which are characterized by producing a high number of spores of small size and rapid germination. In general, they are considered to be opportunistic, because they can rapidly take advantage of favourable conditions under varied and fluctuating environments (Velázquez & Cabello, 2011).
In this study, the total abundance of spores was analysed seasonally in sites with different agricultural practices, over a 2-year period. Of the variables analysed, only the effect of the years influenced the spore density. A 77 % of the total spore number was recorded in 2013. The mean density of spores was greater in 2013 (105 spores/100 g of dry soil) than in 2014 (40 spores/100 g of dry soil). Rivera and Fernández (2003) classified the spore density as low (< 200 spores/50 g of soil), average (between 300-500 spores/50 g of soil) and high (> 600 spores/50 g of soil). However, these numbers might vary depending on whether they are natural ecosystems or agroecosystems. The differences in spore density that were found between the first and second year could be attributed to rainfall. Velázquez et al. (2018) highlighted that when analysing the effect of rainfall on the AMF colonization, it should be considered not only the annual rainfall but also its distribution, particularly during the three or four months prior to sampling. These authors observed that the vegetative state of yerba mate crop at a given time better reflects the water status of the soil during the previous three to four months. In this study, the lowest number of AMF spores was recorded in 2014, when rainfall was 89 % higher than in 2013. García, Mendoza, and Pomar (2008) observed that excessive water availability reduces the spore number in soil and that fluctuations in spore density are more related to this factor than to seasonal changes. The low number of spores reported herein for I. paraguarensis is comparable with our previous work (Velázquez et al., 2018), in which a significantly less spore number and higher values of colonization were recorded in 2014 than in 2013. Raguphathy and Mahvedan (1993) observed that the presence of internal and external mycelium increases during the rainy season when germination is favoured, with the consequent increase in colonization and decrease in spore abundance and diversity in the soil during these periods.
Similarly, the species richness (S) and diversity (H’) showed the same trend mentioned above for the spore density. That is, the highest values of both indices were recorded during the first study year. The greater spore density was due to the greater number of families of Glomeromycota that led to higher species diversity.
In summary, the present study represents a diversity survey of Glomeromycota associated with I. paraguarensis, under different crop situations and natural conditions. Acaulospora capsicula is reported for the first time in South America. This study also contributes to the knowledge of the dynamics and factors that influence the structure of AMF communities over time. We hope that this information would be valuable to generate conservation strategies for this group of microorganisms, which are key players in the sustainable development of yerba mate cultivation systems, as well as in other tropical crops with similar characteristics.
Ethical statement: authors declare that they all agree with this publication and made significant contributions; that there is no conflict of interest of any kind; and that we followed all pertinent ethical and legal procedures and requirements. All financial sources are fully and clearly stated in the acknowledgements section. A signed document has been filed in the journal archives.

