


 English (pdf)
 Article in xml format
 Article references
 Send this article by e-mail
 Cited by SciELO
  Similars in
SciELO
Similars in
SciELO  uBio
uBio 
 Permalink
Many tropical estuaries are zones of high productivity due to a combination of shallowness and high nutrient input from rivers; the vegetation of the estuaries, particularly mangroves, is a contributing factor to this high productivity (Feebarani, Joydas, Damodaran, & Borja., 2016). Most tropical estuaries in developing countries are under increasing human pressure from rapid population growth, tourism, shipping activities and poor management (Lee, 2008; Lotze, 2010). Trinidad and Tobago, like other Small Islands Developing States (SIDS), has a small land mass, high population density and concentrated economic activities along the coast. In addition, development activities within smaller river basin have an almost immediate impact on the coast due to quicker runoff (Kjerfve et al., 2002).
The Caroni Swamp Ramsar Site is the largest mangrove forest in Trinidad and Tobago (Juman & Hassanali, 2013). The Caroni River Basin, the hydrometric area that encompasses the Caroni Swamp, is about 883.4 km2, equivalent to 22 % of the land surface area of the island (Juman, Bacon, & Gerald, 2002). The land-use/ land-cover throughout the Caroni River Basin is diverse. This river basin is the most populated part of the country housing approximately 33 % of the national population (CSO, 1995) and contains some of the most fertile land (Brown, Hansell, Hill, Stark, & Smith, 1966). The gently sloping foothills of the northern and central ranges and the non-flood prone areas of the Caroni floodplain are used extensively for built development, both industrial and residential. At present, there are also a number of agricultural ventures that exist in the area (Kanhai, Gobin, Beckles, Lauckner, & Mohammed, 2013). These ventures contribute to the chemical contamination of the Caroni Swamp through runoff into the rivers.
Chemical contamination of the Caroni Swamp may originate from a combination of land and marine sources (Deonarine, 1980; Phelps, 1997; Institute of Marine Affairs (IMA), 1999; IMA, unpublished). Common land-based sources may include surface runoff from roadways as well as riverine inputs, while marine-based sources may include discharges from maritime vessels operating in adjacent waters as well as tidal deposition of mainland contaminants. In addition, it must be highlighted that the operation of boats (for ecotourism and fish/shellfish harvesting) within the boundaries of the swamp may also contribute to chemical contamination in the swamp (Siung-Chang, Norman, & Dalipsingh, 1987; Kanhai et al., 2013). The Caroni Swamp is therefore susceptible to different sources of pollution, both land-based and marine-based, and from within its boundaries (Kanhai et al., 2013). While there have been many ecological assessments of this wetland (Bacon, 1970; Cuffy, 1999; Juman & Hassanali, 2013), information on the macrobenthic fauna is limited. This study includes a survey of the benthic communities along the main waterways flowing through the Caroni Swamp providing valuable information on the present pollution status of the estuary using indicator species as well as the ecological diversity along a salinity gradient.
Materials and methods
Site description: Trinidad and Tobago is situated in the southernmost end of the Caribbean island chain on the continental shelf of South America, and immediately adjacent to the outflow of the Orinoco River in Venezuela. The country has a tropical climate with two distinct seasons (Henry, 1990). The dry season occurs between January and April, while the wet season extends from June to November. May and December are considered transitional months between the two seasons. Its marine ecosystems are influenced by discharge from South American rivers, mainly the Orinoco River, while its terrestrial biota is largely South American. The tide is mixed, mainly semi-diurnal with a significant diurnal inequality (Kjerfve, 1981).
The Caroni Swamp (10°36’ 3.6” N & 61°27’ 21.6” W) is the largest estuarine mangrove forest in Trinidad occupying approximately 21.7 km of the Gulf of Paria coastline, and covering an estimated 52.6 km2 (Juman et al., 2013). This wetland has a long history of significant anthropogenic alterations, both hydrological and land-use changes (Juman et al., 2013). The Caroni River Basin, the hydrometric area that encompasses the Caroni Swamp, also experienced extensive land-use/land cover changes within the past few decades and this has had serious consequences for the Caroni Swamp; the receiving environment for the land-based runoff.
In addition to saltwater penetration, Caroni Swamp receives sediment-laden water polluted with sewage, wastewater from industry and agriculture run-off (Phelps, 1997; IMA, 1999). This has affected the quality of the habitat, and shellfish harvested in the swamp (IMA, unpublished). Fish kills and mangrove dieback seem to be a regular occurrence (Bacon, 1970; Siung-Chang et al., 1987). Frequent hydrological work to mitigate flooding in the associated catchment have negatively impacted the wetland (Juman et al., 2013). Most notably there has been a marked increase in the recorded salinity of the area, from a low value of 2.4 ‰ in 1970 to as high as 45 ‰ in 2006 (Nathai-Gyan, 2006). The Caroni River, the largest river, flows on the northern side of the wetland, while the Blue River, a channel that has been modified, flows just South of the Caroni River, and the Madame Espagnole flows on the Southern periphery of the wetland. The North South drain is a channel that was constructed between the Blue River and the Madame Espagnole River.
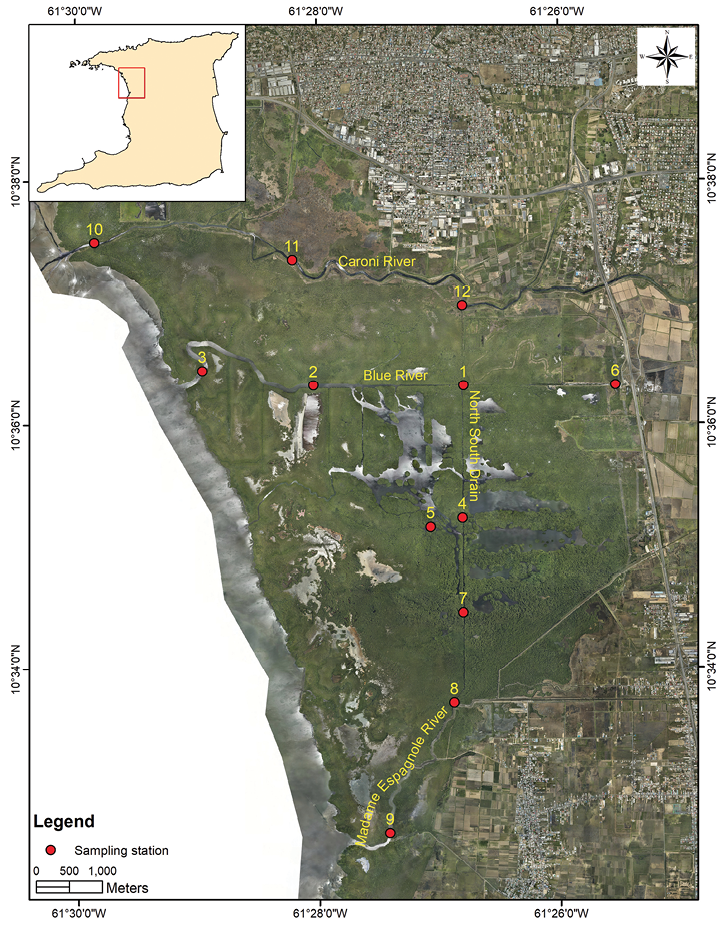
Benthic Sampling: Twelve sampling stations were selected throughout the Caroni Swamp (Figure 1). Six replicate benthic grabs were taken at each station during the dry season (March 2015) and wet season (August 2015), using a Van Veen 0.025 m2 grab. The six replicate grabs per site were determined by doing pre-sampling and constructing a species composition curve. The grab samples were filtered in a 0.5 mm sieve bucket, and stained with a 5 % formalin and Rose Bengal dye mixture. Samples were brought to the laboratory for sorting and identification. Macroinvertebrates were identified to the lowest possible taxonomic level using the following keys: The Polychaete worms (Fauchald, 1977), Aquatic Oligochaeta (Brinkhurst, 1971), Intertidal and shallow water amphipods (Paz-Ríos, Simões, & Ardisson, 2013).
Water and Sediment Quality: The physical characteristics of the water were measured during each sampling period. Salinity, temperature, dissolved oxygen (DO) and pH were measured using a YSI Professional (Pro Plus) Multiparameter Instrument. Water samples were collected during the high tide with a Wildco Niskin 2.2 L Water Sampler at 1 m depths at each sample location; once in the dry season and once in the wet. Nitrites, nitrates and total phosphates were determined according to methods outlined in APHA/AWWA/WPCF (1995). Complexing agents were added to produce coloured complexes of each anion. Quantification of these anions was performed using ultra violet (UV) spectrometric analysis. Quantification of ammonia was performed using the method outlined in Grasshoff, Ehrhardt and Kremling (1983) which is based on a similar principle.
Sediment samples were collected during the sampling periods using a Petit Ponar Grab and tested for Absorbed/Adsorbed Petroleum Hydrocarbons (AAPH) (Intergovernmental Oceanographic Commission, 1982) and Total Organic Carbon (TOC) (Buchanan & Kain, 1971). AAPH was analysed via a solvent extraction of the desired compounds from the sediment samples. These compounds were then concentrated and quantification was done using Luminescence Spectroscopy (Intergovernmental Oceanographic Commission, 1982) TOC was analysed via acid hydrolysis of the samples after which a complexometric titration was conducted to quantify the desired compounds (Buchanan & Kain, 1971).
Data Analysis: Diversity (Shannon’s Index), abundance and richness were calculated. One Way Analysis of Similarity (ANOSIM) was performed using PRIMER 6 (Plymouth Routines in Multivariate Ecological Research, version 6.1.5) (Clarke & Gorley, 2006) by season for each water body. To examine the relationship between the Bray-Curtis similarity index of macroinvertebrates and the number of species within the water quality indices, which were pH, salinity and DO. Principal Component Analysis (PCA) was performed using PRIMER 6.
For the assessment of ecological status of macrobenthic communities, two biotic indices AMBI (Borja, Franco, & Perez, 2000) and M-AMBI (Muxika, Borja, & Bald, 2007) were calculated. AMBI assigns species to one of five levels, from very sensitive to opportunistic species. M-AMBI assesses the ecological status of a sampled point through factorial analysis including Shannon’s diversity, richness and AMBI. These two indices are effective in the assessment of ecological status of benthic communities over a range of geographical areas from the tropics to high latitudes under different levels of human impact (Borja, Muxika, & Franco, 2003; Afli, Ayaari, & Zaabi, 2008; Borja et al., 2008; Cheung, Lam Wu, & Shin, 2008; Borja & Tunberg, 2011; Sigovini, Keppel, & Tagliapetra, 2013; Spagnolo et al., 2014; Feebarani et al., 2016).
AMBI and M-AMBI were calculated using AMBI 5.0 software. As some species identified in the Caroni Swamp were not included in the AMBI species list, species of the same genus present on the list were used to assign new species to the same group as described in Borja & Tunberg (2011). From the 56 taxa identified in the Caroni Swamp, 27 were not included in the AMBI list. AMBI needs reference conditions to be calculated, however, as there are no pristine conditions present in the Caroni Swamp and there is an absence of historical data, the reference conditions were determined by increasing 15 % upon the highest diversity and richness values of all replicates (Borja & Tunberg, 2011; Feebarani et al., 2016). As for the bad status, the references were based upon the azoic situation (diversity and richness equal to 0 and AMBI equal to 6) (Feebarani et al., 2016).
M-AMBI values were set at Diversity 17.6, richness 30, with AMBI being 0 for the high values (Borja et al., 2007). The threshold values for M-AMBI classification were in accordance with Borja et al., (2007): ‘high’ ecological status, > 0.77; ‘good’, 0.53 - 0.77; ‘moderate’, 0.38 - 0.52; ‘poor’, 0.20 - 0.37; and ‘bad’, < 0.20. Univariate and multivariate community analyses were carried out using PRIMER 6 with the species abundance matrix. The univariate measure, Shannon-Wiener, was calculated for species diversity. For Principal Component Analysis (PCA), normalized abiotic variables (water temperature, salinity, DO, pH, and TOC %) were used. Analysis of Variance (ANOVA) was performed using Microsoft EXCEL 2010 to test for seasonal and chemical variations. The Pearson correlation coefficient was used to examine the relationship between environmental variables and faunal parameters using Microsoft Excel.
Results
The environmental, chemical and biological parameters measured at the 12 sampling stations in the Caroni Swamp for the wet season and dry season are provided in Table 1. Salinity showed spatial (ANOVA, P < 0.05) as well as seasonal variations (ANOVA P < 0.001). Generally, salinity levels were lower in the wet season than in the dry season due to precipitation and freshwater runoff from the land. Stations 10, 11 and 12 ranged from 4.5 to 32 ppt (average 18.3 ± 13.7 ppt) in the dry season, and 0.1 to 2.3 ppt (average 0.9 ± 1.2 ppt) during the wet season. Salinity values close to 0 ppt were recorded at Stations 11 and 12 in the wet season. Stations 1-6 did not appear to be heavily influenced by freshwater inflow at the time of sampling and thus had higher salinities. Station 6 recorded the highest salinity (37 ppt) during the dry season. Stations 7-9 recorded an average salinity of 30 ± 2.1 ppt in the dry season and 14 ± 3.0 ppt in the wet season. DO and pH values were generally lower at most stations in the wet season (Table 1).
Table 1: Summary of the environmental and chemical parameters of the Caroni Swamp
| Parameters | DRY SEASON Stations | |||||||||||
| 1 | 2 | 3 | 4 | 5 | 6 | 7 | 8 | 9 | 10 | 11 | 12 | |
| Water temperature (oC) | 28.8 | 28.8 | 28 | 29 | 29.6 | 30.3 | 28.9 | 28.8 | 30.1 | 30.6 | 28.9 | 29.5 |
| Salinity (‰) | 35.53 | 35.33 | 34.91 | 35.67 | 35.44 | 37.94 | 27.66 | 29.67 | 31.94 | 31.98 | 18.66 | 4.49 |
| pH | 8.41 | 8.7 | 8.26 | 8.47 | 8.82 | 8.38 | 8.68 | 8.65 | 8.35 | 8.31 | 8.45 | 8.6 |
| DO (mgl-1) | 5.6 | 6.51 | 6.7 | 6.04 | 6.53 | 7.8 | 3.32 | 4.5 | 7.71 | 7.32 | 3.97 | 3.5 |
| AAPH | 21.647 | 1.136 | 6.386 | 9.569 | 8.867 | 4.473 | 8.485 | 6.328 | 3.066 | 7.313 | 1.526 | 8.578 |
| TOC (%) | 4.64 | 6.25 | 5.82 | 4.37 | 8.28 | 28.01 | 5.67 | 3.91 | 6.18 | 3.17 | 2.42 | 0.6 |
| NH3 (µM) | 1.73 | 0.76 | 0.315 | 15.023 | 1.327 | 1.255 | 10.717 | 51.273 | 18.125 | 55.757 | 125.553 | 145.845 |
| RPO4 (µM) | 1.68 | 1.06 | 0.79 | 1.25 | 1.10 | 2.80 | 2.87 | 6.07 | 3.02 | 12.70 | 19.97 | 30.37 |
| Parameters | WET SEASON Stations | |||||||||||
| 1 | 2 | 3 | 4 | 5 | 6 | 7 | 8 | 9 | 10 | 11 | 12 | |
| Water Temp (oC) | 28.4 | 29.5 | 29.1 | 28.9 | 28.8 | 30 | 29.4 | 29.5 | 29.6 | 30 | 28.4 | 28.9 |
| Salinity (‰) | 20.13 | 25.52 | 23.05 | 21.27 | 21.05 | 21.32 | 16.49 | 10.59 | 14 | 2.31 | 0.28 | 0.12 |
| pH | 7.2 | 7.45 | 7.41 | 7 | 6.71 | 7.27 | 7.38 | 7.48 | 7.41 | 6.93 | 7.12 | 7.35 |
| DO (mgl-1) | 2.25 | 4.16 | 5.12 | 1.5 | 0.72 | 0.33 | 0.54 | 0.32 | 0.36 | 0.96 | 0.95 | 0.26 |
| AAPH | 2.928 | 7.026 | 6.861 | 3.981 | 6.43 | 13.279 | 68.14 | 5.817 | 2.994 | 9.293 | 9.915 | 2.306 |
| TOC (%) | 5.3 | 12 | 6.67 | 4.58 | 16.1 | 13.36 | 7.48 | 3.1 | 8.16 | 1.98 | 1.91 | 0.65 |
| NH3 (µM) | 11.79 | 1.78 | 0.56 | 1.87 | 0.735 | 0.61 | 10.58 | 39.54 | 31.225 | 39.895 | 43.615 | 19.955 |
| RPO4 (µM) | 6.09 | 1.12 | 0.82 | 3.41 | 3.21 | 3.65 | 7.59 | 11.20 | 7.93 | 5.86 | 9.46 | 10.06 |
Macrozoobenthic Community Structure: Fifty-five macrozoobenthic species were recorded at the 12 stations in the Caroni Swamp.Polychaetes was the most abundance taxon with 25 species, and accounting for 45 % of the total macrozoobenthos abundance of 1 888 individuals. There were 11 amphipod species accounting for 20 % of the total macrozoobenthos abundance, nine non-segmented worm species accounting for 6 % of the total macrozoobenthos abundance, and seven crustaceans accounting for 12 % of the total macrozoobenthos abundance. The remaining four major taxa, Insecta, Mollusca, Gastropoda and Nemertia (hereafter referred to as “others”), contributed 7 % of the total macrozoobenthos abundance.
Overall, Grandidierella bonnieroides (Stephensen, 1947), Bemlos spinicarpus (Pearse 1912), Melita planaterga (Kunkel, 1910) and Apolochus neapolitanus (Della Valle, 1893) were the most abundant amphipod species and Sigambra tentaculata (Treadwell, 1941) was the most abundant polychaete species (Table 2). At Stations 1-3 in the Blue River 31 species were recorded with the majority (23 species) being polychaetes. By contrast, Stations 10 - 12 in the Caroni River recorded seven species constituted primarily of Oligochaetes and chironomid larvae at Station 12 (wet season). No organisms were recorded at Station 11 in the dry season, and no organisms were recorded at Station 10 in wet season (Figure 2).
Table 2: Average number of individuals recorded in the wet and dry seasons at the 12 sampling stations in Caroni Swamp
| Species | Station Number | |||||||||||
| 1 | 2 | 3 | 4 | 5 | 6 | 7 | 8 | 9 | 10 | 11 | 12 | |
| Globosolembos smithi | 7 ± 9.9 | 6.5 ± 0.8 | 93 ± 77.8 | 18 ± 25.5 | 0.5 ± 0.8 | 1 ± 1.4 | - | 3.5 ± 4.9 | 2.5 ± 3.5 | - | - | - |
| Bemlos spinicarpus | 19 ± 26.9 | 3 ± 2.8 | 65 ± 9.9 | 3 ± 4.2 | 0.5 ± 0.8 | - | 0.5 ± 0.8 | 6 ± 8.5 | 0.5 ± 0.8 | - | - | - |
| Melita planaterga | 5 ± 7.7 | - | 2.5 ± 3.5 | 2.5 ± 3.5 | 84 ± 114.6 | - | 2.5 ± 3.5 | - | - | - | - | - |
| Sigambra tentaculata | 16 ± 18.4 | 18 ± 22.6 | 1 | 1.5 ± 0.8 | 4.5 ± 0.8 | - | - | 4 ± 1.4 | 8 ± 11.3 | 2 ± 28.3 | - | - |
| Apolochus neapolitanus | 21 ± 29.7 | 5 ± 7.7 | 31.5 ± 0.8 | 1 ± 14.1 | 0.5 ± 0.8 | - | - | 0.5 ± 0.8 | - | - | - | - |
| Amphiporus sp.2 | 16 ± 22.6 | 6.5 ± 7.8 | 3 ± 2.8 | - | 1 | 1 ± 1.4 | - | 3.5 ± 4.9 | - | - | 1 ± 1.4 | 31.5 ± 44.5 |
| Streblospio benedicti | 8.5 ± 12.3 | - | 0.5 ± 0.8 | - | - | - | - | 2.5 ± 3.5 | - | 47.5 ± 67.2 | - | - |
| Amphiporus sp.1 | 18.5±26.2 | 23 ± 31.1 | 6 ± 5.7 | - | 0.5 ± 0.8 | - | - | 0.5 ± 0.8 | - | 4 ± 5.7 | - | 0.5 ± 0.8 |
| Nereis arroyensis | 16 ± 22.6 | 7 ± 1.4 | 3.5 ± 0.8 | 1.5 ± 2.1 | 1.5 ± 2.1 | 1 ± 1.4 | 3 ± 4.2 | 4 ± 5.7 | - | - | - | - |
| Gammarus sp. | - | - | 17 ± 14.1 | 3.5 ± 3.5 | 11.5 ± 16.3 | 0.5 ± 0.8 | - | 2.5 ± 3.5 | - | - | - | - |
| Podarkeopsis brevipalpa | - | - | 1.5 ± 2.1 | 0.5 ± 0.8 | 21 ± 15.6 | 0.5 ± 0.8 | 7 ± 1.4 | - | - | - | - | - |
| Eunice sp. | 0.5 ± 0.8 | 5.5 ± 2.1 | - | 13 ± 5.7 | 6 ± 1.4 | - | 0.5 ± 0.8 | - | - | - | - | - |
| Amphicteis scaphobranchiata | 2 ± 2.8 | 8.5 ± 9.2 | 2 | 4 ± 4.2 | - | - | - | 1.5 ± 2.1 | - | 3.5 ± 4.9 | - | - |
| Bemlos sp.1 | 9.5 ± 13.4 | 4 ± 5.7 | - | - | - | - | - | - | - | - | - | - |
| Capitella capitata | 1 ± 1.4 | 0.5 ± 0.8 | 5 ± 5.7 | - | - | - | - | 2 ± 2.8 | 0.5 ± 0.8 | 3.5 ± 4.9 | - | - |
| Leptochelia foresti | - | 5.5 ± 7.8 | 6 ± 8.5 | - | - | - | - | - | - | - | - | - |
| Bemlos sp.2 | 7 ± 9.9 | - | 3 ± 4.2 | - | - | - | - | - | - | - | - | - |
| Glycera sp. | 4 ± 1.4 | 2 | 1.5 ± 0.8 | - | 0.5 ± 0.8 | - | - | 0.5 ± 0.8 | 1 ± 1.4 | - | - | - |
| Chironomid larvae | - | - | - | - | - | - | - | - | - | - | - | 8.5 ± 12.3 |
| Scoloplos (Leodamas) rubra | - | 0.5 ± 0.8 | 3.5 ± 2.1 | 0.5 ± 0.8 | - | - | - | 0.5 ± 0.8 | 0.5 ± 0.8 | - | - | - |
| Aricidea sp.1 | - | 4 ± 5.7 | 1 | 0.5 ± 0.8 | - | - | - | - | - | - | - | - |
| Lembos unifasciatus reductus | - | - | 5 ± 7.7 | - | - | - | - | - | - | - | - | - |
| Ampelisca sp. | 2 ± 2.8 | - | 2.5 ± 3.5 | - | - | - | - | - | - | - | - | - |
| Sternaspis scutata | - | - | 4.5 ± 4.9 | - | - | - | - | - | - | - | - | - |
| Schistomeringos pectinate | - | 3 ± 1.4 | 0.5 ± 0.8 | - | - | - | - | - | - | 0.5 ± 0.8 | - | - |
| Neocallichirus grandimana | 0.5 ± 0.8 | 2 ± 2.8 | 1 ± 1.4 | - | - | - | - | - | 0.5 ± 0.8 | - | - | - |
| Micrura sp.1 | - | 1.5 ± 2.1 | 2.5 ± 2.1 | - | - | - | - | - | - | - | - | - |
| Sirella sp. | 0.5 ± 0.8 | 0.5 ± 0.8 | 0.5 ± 0.8 | - | 0.5 ± 0.8 | 0.5 ± 0.8 | - | - | 1 ± 1.4 | - | - | - |
| Nemertia sp.1 | - | 0.5 ± 0.8 | 3 ± 4.2 | - | - | - | - | - | - | - | - | - |
| Tellina radiata | - | 0.5 ± 0.8 | - | - | - | - | - | 3 ± 4.2 | - | - | - | - |
| Nemertia sp.2 | - | 3 ± 4.2 | - | - | - | - | - | - | - | - | - | - |
| Melita sp. | - | - | - | 3 ± 4.2 | - | - | - | - | - | - | - | - |
| Loimia medusa | - | 2 ± 2.8 | 0.5 ± 0.8 | - | - | - | - | - | - | - | - | - |
| Diopatra cuprea | - | 1 ± 1.4 | 1.5 ± 0.8 | - | - | - | - | - | - | - | - | - |
| Cossura soyeri | - | - | 2.5 ± 3.5 | - | - | - | - | - | - | - | - | - |
| Prionospio dayi | 1.5 ± 2.1 | - | 0.5 ± 0.8 | - | - | - | - | - | - | - | - | - |
| Chione cancellata | - | 0.5 ± 0.8 | 0.5 ± 0.8 | - | - | - | - | - | 1 | - | - | - |
| Sipunculida | - | 1.5 ± 2.1 | 0.5 ± 0.8 | - | - | - | - | - | - | - | - | - |
| Upogebia omissa | - | 1 ± 1.4 | 0.5 ± 0.8 | - | - | - | - | - | - | - | - | - |
| Paradialychone americana | 0.5 ± 0.8 | 0.5 ± 0.8 | 0.5 ± 0.8 | - | - | - | - | - | - | - | - | - |
| Lumbrineris ernesti | - | 0.5 ± 0.8 | 1 ± 1.4 | - | - | - | - | - | - | - | - | - |
| Nereis riisei | 0.5 ± 0.8 | - | - | - | 0.5 ± 0.8 | 0.5 ± 0.8 | - | - | - | - | - | - |
| Polyodontes oculea | - | 1 ± 1.4 | - | - | - | - | - | - | - | - | - | - |
| Mystides borealis | - | 1 ± 1.4 | - | - | - | - | - | - | - | - | - | - |
| Gastropoda | - | - | - | - | - | - | - | - | - | - | 1 ± 1.4 | - |
| Bispira melanostigma | - | 0.5 ± 0.8 | - | - | 0.5 ± 0.8 | - | - | - | - | - | - | - |
| Johnstonia sp. | 0.5 ± 0.8 | - | - | - | - | - | - | - | - | - | - | - |
| Nematoda | 0.5 ± 0.8 | - | - | - | - | - | - | - | - | - | - | - |
| Cirolana sp. | - | - | 0.5 ± 0.8 | - | - | - | - | - | - | - | - | - |
| Micrura sp.2 | - | - | 0.5 ± 0.8 | - | - | - | - | - | - | - | - | - |
| Cumacean | - | - | - | - | - | - | - | - | - | 0.5 ± 0.8 | - | - |
| Aricidea sp.2 | - | 0.5 ± 0.8 | - | - | - | - | - | - | - | - | - | - |
| Goniada sp. | - | 0.5 ± 0.8 | - | - | - | - | - | - | - | - | - | - |
| Carpias algicola | - | - | 0.5 ± 0.8 | - | - | - | - | - | - | - | - | - |
| Serpulidae | - | - | 0.5 ± 0.8 | - | - | - | - | - | - | - | - | - |
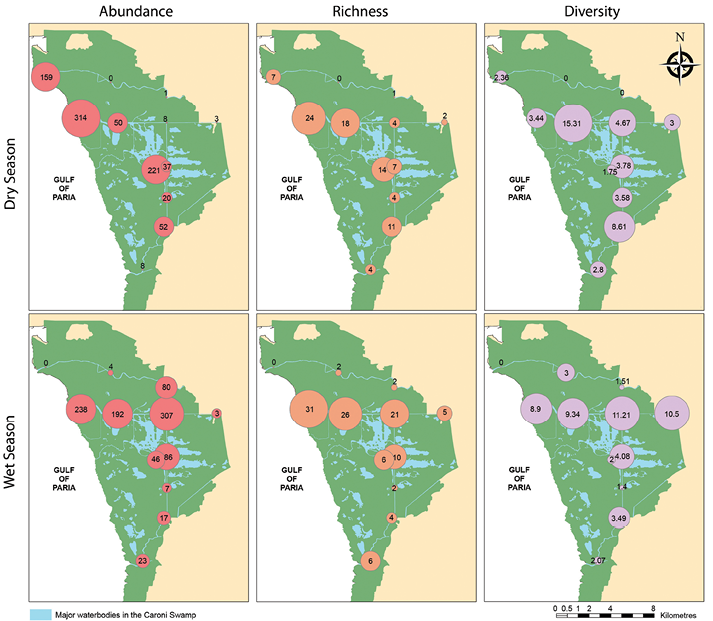
Figure 2 Abundance, diversity and richness for stations sampled along the Caroni Swamp for wet and dry seasons.
Station 3, located at the mouth of the Blue River, had the highest species richness in both dry and wet seasons. Station 3 also recorded the greatest number of individuals (314 individuals) in the dry season, while Station 1, also located in the Blue River, recorded 307 individuals in the wet season. However, only 9 individuals were found at Station 1 in the dry season (Figure 2). At Station 10, located at the mouth of the Caroni River, 159 individuals were caught in the dry season and none in the wet season. Station 11, also in the Caroni River, recorded no organisms in the dry season (Figure 2).
Station 2 had the highest species diversity (Shannon’s Diversity Index) in the dry season, while Station 1 had the highest species diversity in the wet season. Stations 10 and 11 had the lowest species diversity in both the dry and wet seasons (Figure 2). The polychaetes Sigambra tentaculata and Nereis arroyensis (Treadwell, 1941) were the most common species. S. tentaculata was found at Stations 1, 2 and 3 in the Blue River, 4, 5 and 8 in the North South Drain and Station 10 in the Caroni River in the dry season (Table 2). For the wet season, it was found at Stations 1-5, 8 and 9. N. arroyensis was found at Stations 2, 3 and 6 in the Blue River, 4, 5, 7 and 8 in the North-South Drain in the dry season, but in the wet season it was recorded only at Stations 1, 2 and 3 along the Blue River (Table 2).
ANOSIM among the three rivers was significant (ANOVA, P < 0.02) indicating the location by river influences the distribution of the infaunal communities. This difference was mostly seen between stations within the Caroni River and the other two waterways. There was no significant difference between the Blue River and the North South Drain. (ANOVA, P= 0.307), but there was significant difference between the Blue River and Caroni River (ANOVA, P = 0.03) and between North-South Drain and Caroni River (ANOVA, P = 0.01). The Global R value was 0.245 indicating a small separation among the groups.
SIMPER analysis among stations further supports the ANOSIM analysis that there is more similarity between the Blue River and North South Drain, and little relation of the two with the Caroni River. The species most accounting for this similarity is N. arroyensis, 20.62 % similar, followed by S. tentaculata, 16.06 % similar. During the wet season all stations had a similarity of 15.60. Oligochaeta sp. 2 accounted for 32.82 % of this similarity followed by S. tentaculata with 15.63 %. BEST analysis revealed that the top five species responsible for the trends recognised in the Caroni Swamp were: Glycera sp., Amphicteis scaphobranchiata (Moore, 1906) Eunice sp., G. bonnieroides, and Podarkeopsis brevipalpa (Hartmann- Schröder, 1959). One-way ANOVA (Table 3) showed a significant influence (P < 0.05) of ammonium on species abundance. Pearson correlation showed a negative relationship between ammonium and species abundance.
Table 3: ANOVA results showing the effect of seasonality, chemical and environmental parameters on abundance. Two-way ANOVA performed for Seasonal variations, one-way for chemical and environmental parameters
| Dependent variable | sum of squares | df | mean square | F | sig |
|---|---|---|---|---|---|
| Season(2-way ANOVA) | |||||
| AMBI | 10.17416 | 10 | 1.017416 | 0.260971 | 0.977392 |
| M-AMBI | 1.640146 | 11 | 0.149104 | 5.896712 | 0.003273 |
| Richness | 1518.458 | 11 | 138.0417 | 5.375867 | 0.004791 |
| Simpson’s Diversity | 1.940146 | 11 | 0.176377 | 4.899204 | 0.006952 |
| Abundance | 24398.89 | 11 | 2218.081 | 3.086872 | 0.001106 |
| Chemistry (one-way ANOVA) | |||||
| NH3-N | 32560.68 | 1 | 32560.68 | 5.531559 | 0.023013 |
| AAPH | 56970.38 | 1 | 56970.38 | 10.86523 | 0.001893 |
| RPO4 | 62058.98 | 1 | 62058.98 | 11.98096 | 0.001171 |
| TOC% | 294.7978 | 1 | 294.7978 | 15.63588 | 0.000263 |
| Environmental parameters | |||||
| Water temperature | 28919.9 | 1 | 28919.9 | 5.609052 | 0.022125 |
| Salinity | 37668.41 | 1 | 37668.41 | 7.204806 | 0.010073 |
One-way ANOVA showed a significant influence (P < 0.05) of reactive phosphates on species abundance. Pearson correlation showed a negative relationship between phosphorus and species abundance.
AMBI and M-AMBI: The three most dominant amphipod species (G. bonnieroides, B. spinicarpus and M. planaterga), recorded from the Caroni Swamp belonged to Ecological Group I, contributed up to 35 % of the macrozoobenthos abundance. The highest value of AMBI occurred at Station 12 (most disturbed station) and the lowest value of M-AMBI occurred at Station 11 (lowest ecological status) during the wet season. There were no AMBI or M-AMBI readings for either station during the dry season as the number of organisms was either too small or were not found in the AMBI index.
AMBI showed that 5 stations did not change their classes of disturbance from one season to the next (1,2,3,7 and 8) (Figure 3). Three stations changed by 1 class of disturbance (4, 5 and 6), Station 9 went through two classes of disturbance, from undisturbed to moderately disturbed, whereas the three stations associated with the Caroni River were difficult to ascertain changes in disturbance levels as so few or no organisms were found. Station 10 was classed as moderately disturbed in the dry season, while no organisms were found in the wet season. Stations 11 and 12 were classed as heavily disturbed in the wet season (Figure 3).
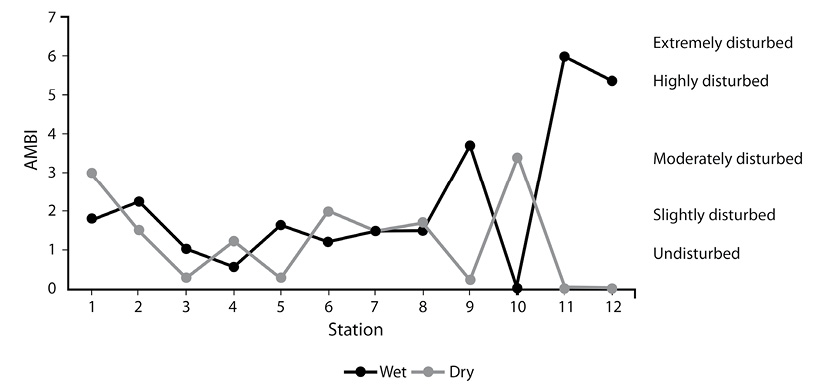
Figure 3 Spatial distribution and classification of AMBI values found for various stations of the Caroni Swamp for dry season and wet season.
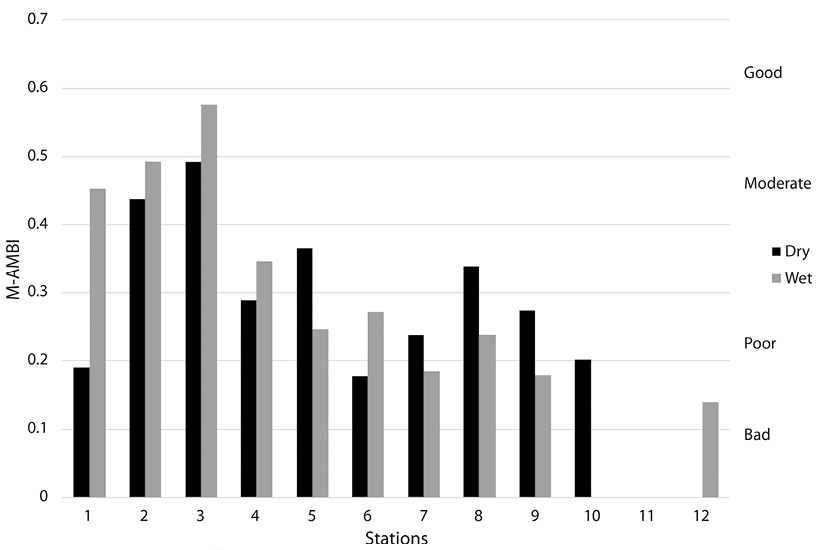
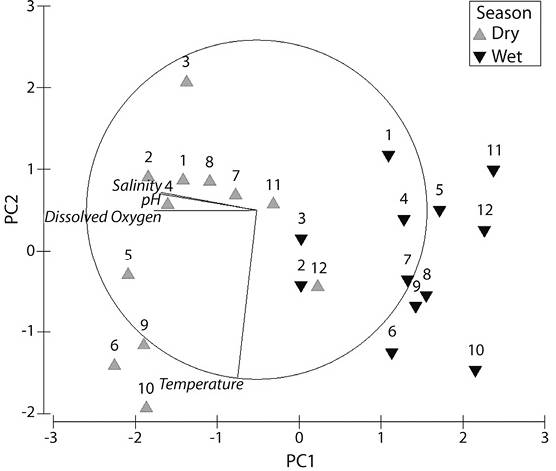
According to M-AMBI analysis (Figure 4), Station 2 showed moderate ecological status in both seasons while Station 3 showed moderate ecological status in the dry season but improved to good in the wet season. Stations 4, 5, 7, 8, 9 and 10 showed poor ecological status in the dry season. However, only stations 4, 5 and 8 maintained this status for the wet season. Stations 7 and 9 fell to bad status for the wet season. No M-AMBI value was obtained for station 10 due to lack of organisms. Stations 1 and 6 showed bad ecological status in the dry season; however, while Station 1 improved to moderate ecological status in the wet season, Station 6 decreased to poor. No organisms were found at Station 11 for the dry season, while the ones found at Station 12 were not in the AMBI library as such no dry season value was obtained for either station. However, for the wet season both showed ecological status as bad. In the PCA analysis using environmental variables, principal components 1 and 2 which were pH and salinity, accounted for 86.6 % of the variation among the samples (Figure 5). Stations were separated based on these two factors. Each station during the two seasons were aligned with stations to the left having higher pH and lower salinity, as were common for the dry season and stations to the right having lower pH and lower salinities. Results of 2-way ANOVA showed the effect of season had a significant influence on the macrozoobenthos abundances (ANOVA P < 0.05). There was no significant variation for AMBI values between seasons (ANOVA P > 0.05) indicating little change in the disturbance levels of the stations from one season to the next. M-AMBI values showed a significant difference between seasons (ANOVA, P < 0.05) indicating a significant difference in the quality of the macrozoobenthos and the status of the stations. Pearson correlation coefficients between abiotic and biotic parameters show a positive influence of salinity (ANOVA, P < 0.05) on species abundance but a negative one for pH (ANOVA, P < 0.05). Shannon’s Diversity Index and M-AMBI showed positive correlations with both pH (ANOVA, P < 0.001) and salinity (ANOVA, P < 0.001). Species richness showed a positive correlation with salinity (ANOVA, P < 0.001) but not pH (ANOVA, P > 0.05). The overall M-AMBI values showed an increase in quality following the pattern: Stn 11< Stn 12< Stn 10 < Stn 7< Stn 9< Stn 6< Stn 8< Stn 5< Stn 4< Stn 1< Stn 2< Stn 3, with values of 0.01, 0.07, 0.1, 0.21, 0.225, 0.225, 0.29, 0.31, 0.32, 0.32, 0.46, and 0.53, respectively.
Discussion
The overall benthic “slightly disturbed” class (according to AMBI) and “poor” ecological status (according to M-AMBI) indicate that the macrobenthic communities in the Caroni Swamp are experiencing effects from human pressures (Table 4). Since this is the first benthic assessment conducted in the Caroni Swamp estuary using AMBI and M-AMBI, a comparison with historical data was not possible. However, it appears that human pressures do play an important role in the level of disturbance experienced at different points of the estuary.
Table 4: Mean M-AMBI values and ecological values for each station for both seasons, together with the mean values
| Euhaline | Polyhaline | Mesohaline | Oligohaline | |||||||||
| 2 | 1 | 3 | 4 | 5 | 6 | 7 | 8 | 9 | 10 | 11 | 12 | |
| Dry season | 0.85 | 0.39 | 0.87 | 0.57 | 0.63 | 0.34 | 0.48 | 0.68 | 0.53 | 0.38 | 0 | 0 |
| Ecological status | high | moderate | high | good | good | poor | moderate | good | good | poor | N/A | N/A |
| Wet season | 0.86 | 0.82 | 0.97 | 0.65 | 0.45 | 0.54 | 0.33 | 0.46 | 0.34 | 0 | 0.12 | 0.13 |
| Ecological Status | high | high | high | good | moderate | good | poor | moderate | poor | N/A | bad | bad |
AMBI and M-AMBI showed the Caroni River as being heavily disturbed and having low ecological status, respectively. This is contrary to the rest of the stations which show slightly disturbed and good ecological status. The other hypothesis tested in this study was whether or not a gradient of increasing quality existed from heavily stressed stations at the landward stations of the wetland to less stressed stations at the seaward stations. This study does not support this hypothesis as no clear trend was observed in the ranking of the AMBI or M-AMBI indices.
The Caroni River receives water from 12 rivers that drain catchments of densely developed human settlements, industries and agriculture. This inflow of land-based pollutants may have led to the poor ecological status of Stations 10, 11 and 12. The Blue River is not a true river and does not receive water from land-based runoff which may have resulted in a higher ecological status for Stations 1-3. The ecological status of Station 4 (M-AMBI: 0.32) was higher than the rest of the stations within the North-South Drain. Station 4 was the closest to the Blue River and farthest from the Madame Espagnole River and may not have experienced the same human pressure exerted on the macrobenthic communities as the rest of the North-South Drain stations.
Benthic communities will generally respond to organic enrichment as an effect of pollution (Pearson & Rosenberg, 1978). The sources of organic enrichment such as sewage effluent can affect DO and nitrogen content (Vaalgamaa, Sonninen, Korhola, & Weckstrom, 2013), which will, in turn, impact benthic communities adversely (Hyland et al., 2005). On average, all stations within the Caroni Swamp had low sediment TOC values of > 4 % with the exception of Stations 8, 10, 11 and 12. The TOC % showed negative correlation with AMBI (ANOVA, P < 0.01). As the TOC % decreased, there was an increase in AMBI values. The high organic matter content may be due to the continuous supply of fresh matter into the system from inland sources as well as the fact that mangrove ecosystems normally act as carbon sinks resulting in higher organic content than would be expected of terrestrial ecosystems (Matsui, Meepol, & Chukwamdee, 2015).
Ammonium concentrations also showed a negative correlation with AMBI (ANOVA, P < 0.001). This could be due to inputs of wastewater from the sewage plant located along the lower reaches of the Caroni River, where the highest levels of ammonia were recorded. The average ammonia level was 35.6 µM reaching as high as 145.8 at Station 12 during the dry season in the Caroni River (Table 1). The USEPA (1995) guide to toxic ammonia sets a limit of 1.43 µM to indicate chronic toxicity to aquatic life. All stations sampled exceeded this limit apart from those in the Blue River and Station 5 along the North South Drain. For the wet season the same trend was observed. The average ammonia level for the wet season fell to 16.8 µM which is to be expected due to increased flow of the associated rivers in the swamp leading to increased flushing. The highest value during the wet season was at station 11 in the Caroni River with a value of 43.6
The TOC % remains virtually unchanged for both seasons. DO concentrations decreased from an average of 5.8 ± 1.6 mgL-1 to 1.4 ± 1.6 mgL-1 from the dry season to the wet season. DO levels below 2 mgL-1 can be described as hypoxic (Rabalais, Turner, Justic´, Dortch, & Wiseman, 1999). Stations 4-12 all recorded DO levels of less than 2 mgL-1 during the wet season. The most common cause of hypoxia is as a result of human- induced factors, the main one being nutrient pollution (NOAA, 2016). Agricultural runoff, wastewater and sewage effluent can result in increased nitrogen and phosphorus levels (NOAA, 2016). Ammonium concentrations were found to exceed the USEPA acceptable limit (1.43 µM) for aquatic life (USEPA, 1995) during the wet season except at Stations 3, 5 and 6.
There is more freshwater input into the system during the wet season as evidenced by a drop in salinity from 29.9 ‰ to 14.7 ‰. PCA showed salinity to be the most strongly correlated factor to the groupings of the wet and dry season stations observed. The salinities are generally lower in the wet season as compared to the dry season due to higher rainfall and the discharge of freshwater from surface run-off from the adjacent roads, rivers and immediate environment. The station with the lowest salinity, station 12 in the Caroni River also had the lowest number of organisms found. Station 3 located at the mouth of the Blue River had the highest number of species in the dry season. Station 10, located at the mouth of the Caroni River had the highest number of species in the wet and dry season for this river. It appears that generally, the biodiversity increases as the salinity increases.
USEPA (1995) does not provide limits for phosphorus in the environment; however, when phosphate levels were compared to those recommended by the Ministry of the Environment of British Columbia (1991) of 0.7 µM, all Stations were found to exceed this limit. These elevated levels are due to anthropogenic inputs from agricultural, domestic and industrial wastewater (Institute of Marine Affairs (IMA), 2012). Too much phosphate in the aquatic environment leads to excessive growth of algae and weeds which then use up large amounts of oxygen (Oram, 2014). As these plants die, they are broken down by aerobic bacteria which further deprives aquatic organisms of oxygen often leading to death or migration from the area (Oram, 2014). The higher salinities recorded in the dry season are due to less rainfall. The dry season also results in less land-based runoff. This lower flushing rate can result in a build-up of pollutants as evidenced by high ammonium levels recorded particularly in the Caroni River. The decrease in flushing during the dry period causes changes in pH which becomes more alkaline when compared to the wet period. Table 2 shows a decrease in pH from an average of 8.5 ± 0.2 in the dry season to 7.2 ± 0.2 in the wet season.
Average values for Shannon’s Index, species richness, AMBI and M-AMBI showed very little change in the health of the benthic communities from the dry season to the wet season. Hence, in principle, natural stress due to seasonal change does not appear to significantly affect the populations of benthic organisms. Notable exceptions were Stations 1, 6 and 9. Station 1 in the Blue River showed a marked increase in diversity, richness and abundance from the dry season to the wet season. M-AMBI values also showed a significant improvement in ecological status from bad to moderate. Station 9, located at the mouth of the Madame Espagnole River, showed a decrease in the quality of the macrobenthos as M-AMBI changed from “poor” in the dry season to “bad” in the wet season. The location of Station 9 (Figure 1), close to the mouth of the Madame Espagnole River, can leave it susceptible to increased outflow of pollutants during the wet season which, in turn, decrease the health of the benthic communities for that period. Station 6, located on the landward side of the Blue River (Figure 1), showed an improvement in ecological status from the dry season to the wet season from poor to good. Station 6 recorded a decrease in the levels of ammonium between seasons. All other stations showed either minor fluctuations of their ecological status or remained the same supporting the finding that seasonality does not significantly affect the macrobenthic communities within the swamp.
Although AMBI and M-AMBI can readily detect different human pressure (Bigot et al., 2008), they are not considered sensitive enough to natural stresses and strong seasonal change (Borja et al., 2008). Naturally, estuaries are highly stressed communities because the environmental conditions are highly variable (Feebarani et al., 2016). In estuaries, where seasonal changes exist, the values of AMBI and M-AMBI remain unchanged when there is no external modification from human pressures, while in areas affected by human pressure they respond as expected following the description of Pearson and Rosenberg (1978). In this study, benthic community abundance, richness, and Shannon’s Index varied from the dry season to the wet season. The effect of season on the benthic communities is reflected in the distribution of land-based effluents, particularly that of ammonium, which was lower in the wet season than dry season due to dilution due to increased freshwater inflow in the wet season.
In conclusion, the Caroni Swamp faces stress from human activities as evident from the overall “slightly disturbed” class (according to AMBI) and “poor” ecological status (according to M-AMBI) of the macrobenthic communities. The Caroni River, the northernmost section of the wetland was the most impacted water body. During the wet season, the quality of the macrobenthos in the wetland improves overall, while the more southern stations deviated from this trend showing degradation in their ecological status. This is the first time AMBI and M-AMBI were used in this wetland, which will enable a better understanding of the state of this wetland. This assessment is useful in developing monitoring strategies and management interventions to improve habitat quality.

